Household expenditures: India
(→Community-wise disparities) |
(→Income disparity between rich & poor growing rapidly) |
||
| Line 51: | Line 51: | ||
= Disparities in Income and consumption= | = Disparities in Income and consumption= | ||
See also [[Income Distribution:India]] | See also [[Income Distribution:India]] | ||
| + | |||
| + | ==Community-wise disparities== | ||
| + | '''Muslims have lowest living standard in India: Govt survey''' | ||
| + | |||
| + | PTI | Aug 20, 2013 | ||
| + | |||
| + | Muslims were at the bottom in rural areas, with an average monthly per capita expenditure of Rs 833, followed by Hindus at Rs 888, Christians at Rs 1,296 and Sikhs 1,498. | ||
| + | NEW DELHI: Among various religious groups, Muslims have the lowest living standard with the average per capita expenditure of just Rs 32.66 in a day, says a government survey. | ||
| + | |||
| + | At the other end of the spectrum, Sikh community enjoys a much better lifestyle as the average per capita spending among them is Rs 55.30 per day, while the same for Hindus is Rs 37.50. For Christians it is Rs 51.43. | ||
| + | |||
| + | "At all-India level, the average monthly per capita expenditure (MPCE) of a Sikh household was Rs 1,659 while that for a Muslim household was Rs 980 in 2009-10," said an NSSO study titled 'Employment and Unemployment Situation Among Major Religious Groups in India'. | ||
| + | |||
| + | The average household MPCE is a proxy for income and reflects that living standards of a family. | ||
| + | |||
| + | According to the study, the average MPCE for Hindus and Christians were Rs 1,125 and Rs 1,543, respectively. | ||
| + | |||
| + | The survey said that average monthly per capita consumption at all-India level was Rs 901 in villages and Rs 1,773 in cities. Overall, the average MPCE was Rs 1,128. | ||
| + | |||
| + | Muslims were at the bottom in rural areas, with an average MPCE of Rs 833, followed by Hindus at Rs 888, Christians at Rs 1,296 and Sikhs 1,498. | ||
| + | |||
| + | In urban areas, Muslims' average MPCE was also the lowest at Rs 1,272 followed by Hindus at Rs 1,797, Christians Rs 2,053 and Sikhs at Rs 2,180. | ||
| + | |||
| + | |||
| + | |||
| + | [[Category:Development|EHOUSEHOLD EXPENDITURES: INDIAHOUSEHOLD EXPENDITURES: INDIAHOUSEHOLD EXPENDITURES: INDIAHOUSEHOLD EXPENDITURES: INDIA | ||
| + | HOUSEHOLD EXPENDITURES: INDIA]] | ||
| + | [[Category:Economy-Industry-Resources|EHOUSEHOLD EXPENDITURES: INDIAHOUSEHOLD EXPENDITURES: INDIAHOUSEHOLD EXPENDITURES: INDIAHOUSEHOLD EXPENDITURES: INDIA | ||
| + | HOUSEHOLD EXPENDITURES: INDIA]] | ||
| + | [[Category:India|EHOUSEHOLD EXPENDITURES: INDIAHOUSEHOLD EXPENDITURES: INDIAHOUSEHOLD EXPENDITURES: INDIAHOUSEHOLD EXPENDITURES: INDIA | ||
| + | HOUSEHOLD EXPENDITURES: INDIA]] | ||
| + | [[Category:Pages with broken file links|HOUSEHOLD EXPENDITURES: INDIAHOUSEHOLD EXPENDITURES: INDIAHOUSEHOLD EXPENDITURES: INDIAHOUSEHOLD EXPENDITURES: INDIA | ||
| + | HOUSEHOLD EXPENDITURES: INDIA]] | ||
==Income disparity between rich & poor growing rapidly== | ==Income disparity between rich & poor growing rapidly== | ||
| Line 91: | Line 124: | ||
| + | |||
| + | [[Category:Development|EHOUSEHOLD EXPENDITURES: INDIAHOUSEHOLD EXPENDITURES: INDIAHOUSEHOLD EXPENDITURES: INDIAHOUSEHOLD EXPENDITURES: INDIA | ||
| + | HOUSEHOLD EXPENDITURES: INDIA]] | ||
| + | [[Category:Economy-Industry-Resources|EHOUSEHOLD EXPENDITURES: INDIAHOUSEHOLD EXPENDITURES: INDIAHOUSEHOLD EXPENDITURES: INDIAHOUSEHOLD EXPENDITURES: INDIA | ||
| + | HOUSEHOLD EXPENDITURES: INDIA]] | ||
| + | [[Category:India|EHOUSEHOLD EXPENDITURES: INDIAHOUSEHOLD EXPENDITURES: INDIAHOUSEHOLD EXPENDITURES: INDIAHOUSEHOLD EXPENDITURES: INDIA | ||
| + | HOUSEHOLD EXPENDITURES: INDIA]] | ||
| + | [[Category:Pages with broken file links|HOUSEHOLD EXPENDITURES: INDIAHOUSEHOLD EXPENDITURES: INDIAHOUSEHOLD EXPENDITURES: INDIAHOUSEHOLD EXPENDITURES: INDIA | ||
| + | HOUSEHOLD EXPENDITURES: INDIA]] | ||
[[Category:Development|EHOUSEHOLD EXPENDITURES: INDIAHOUSEHOLD EXPENDITURES: INDIAHOUSEHOLD EXPENDITURES: INDIAHOUSEHOLD EXPENDITURES: INDIA | [[Category:Development|EHOUSEHOLD EXPENDITURES: INDIAHOUSEHOLD EXPENDITURES: INDIAHOUSEHOLD EXPENDITURES: INDIAHOUSEHOLD EXPENDITURES: INDIA | ||
Revision as of 20:13, 2 March 2023
This is a collection of articles archived for the excellence of their content.
|
‘Bare necessities’
2012>18
January 30, 2021: The Times of India

From: January 30, 2021: The Times of India
‘Access to bare necessities has improved in all states’
New Index Covers Housing, Water, Sanitation, Power, Cooking Fuel
New Delhi:
Availability of “bare necessities” such as housing, water, sanitation, electricity and clean cooking fuel — has improved across all states in the country in 2018 compared to 2012, the Economic Survey for 2020-21 showed.
According to the first ever BNI (bare necessities index), released as part of the 2020-21 survey on Friday, access to these is the highest in states such as Kerala, Punjab, Haryana and Gujarat, while it is the lowest in Odisha, Jharkhand, West Bengal and Tripura. The BNI has been developed for rural, urban and all-India level using data from two NSO (rounds 69 and 76) on drinking water, sanitation, hygiene and housing conditions. The index summarises 26 indicators on five dimensions — water, sanitation, housing, micro-environment, and other facilities (assessed using indicators like access to type of kitchen, ventilation of the dwelling unit, access to a bathroom, electricity and type of fuel used for cooking).
The BNI also indicates that inter-state disparities in the access to “the bare necessities” have declined in 2018 when compared to 2012 across rural and urban areas. Access to “the bare necessities” has improved disproportionately more for the poorest households when compared to the richest households across rural and urban areas. “The improvement in equity is particularly noteworthy because while the rich can seek private alternatives, lobby for better services, or if need be, move to areas where public goods are better provided for, the poor rarely have such choices,” the survey said.
Data from the National Family Health Surveys have been studied to correlate the BNI in 2012 and 2018 with the infant mortality rate and the under-5 mortality rate in 2015-16 and 2019-20, respectively. The survey reports that improved access to “the bare necessities” has led to improvements in health indicators and correlates with future improvements in education indicators.
In rural India, the highest access to bare necessities in 2018 was recorded in Punjab, Kerala, Sikkim, Goa and Delhi, while the lowest was in Uttar Pradesh, Madhya Pradesh, Bihar, Jharkhand, West Bengal, Odisha, Assam, Manipur and Tripura.
In urban India, no state is showing the lowest level of BNI in 2018, and the states showing improvement over 2012 include Uttarakhand, Jammu & Kashmir, Punjab, Rajasthan, Madhya Pradesh, Maharashtra, Karnataka, Kerala, Tamil Nadu, Arunachal Pradesh and Manipur.
However, to bridge the gaps, it is recommended that there must be effective convergence in scheme implementation at the Centre-state and local levels. “For this purpose, a BNI based on large annual household survey data can be constructed using suitable indicators and methodology at district level for all/ targeted districts to assess the progress on access to bare necessities,” the report states.
Disparities in Income and consumption
See also Income Distribution:India
Community-wise disparities
Muslims have lowest living standard in India: Govt survey
PTI | Aug 20, 2013
Muslims were at the bottom in rural areas, with an average monthly per capita expenditure of Rs 833, followed by Hindus at Rs 888, Christians at Rs 1,296 and Sikhs 1,498. NEW DELHI: Among various religious groups, Muslims have the lowest living standard with the average per capita expenditure of just Rs 32.66 in a day, says a government survey.
At the other end of the spectrum, Sikh community enjoys a much better lifestyle as the average per capita spending among them is Rs 55.30 per day, while the same for Hindus is Rs 37.50. For Christians it is Rs 51.43.
"At all-India level, the average monthly per capita expenditure (MPCE) of a Sikh household was Rs 1,659 while that for a Muslim household was Rs 980 in 2009-10," said an NSSO study titled 'Employment and Unemployment Situation Among Major Religious Groups in India'.
The average household MPCE is a proxy for income and reflects that living standards of a family.
According to the study, the average MPCE for Hindus and Christians were Rs 1,125 and Rs 1,543, respectively.
The survey said that average monthly per capita consumption at all-India level was Rs 901 in villages and Rs 1,773 in cities. Overall, the average MPCE was Rs 1,128.
Muslims were at the bottom in rural areas, with an average MPCE of Rs 833, followed by Hindus at Rs 888, Christians at Rs 1,296 and Sikhs 1,498.
In urban areas, Muslims' average MPCE was also the lowest at Rs 1,272 followed by Hindus at Rs 1,797, Christians Rs 2,053 and Sikhs at Rs 2,180.
Income disparity between rich & poor growing rapidly
In ’12 Urban Rich Earned 15 Times More Than Poor
Subodh Varma TIG
The Times of India 2013/07/28
Everybody knows that there is a chasm between the rich and the poor. But can it be measured? And, more importantly, is this disparity growing or coming down?
Consumption expenditure between 2000 and 2012: India
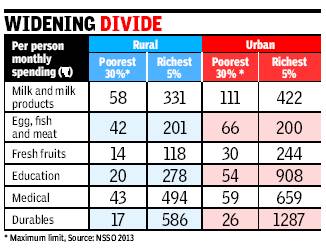
New data based on consumption expenditure surveys shows that income disparity is growing and at a rapid clip. Spending and consumption by the richest 5% zoomed up by over 60% between 2000 and 2012 in rural areas while the poorest 5% saw an increase of just 30%. In urban areas, the richest segment’s spending increased by 63% while the poorest saw an increase of 33%. The effect of inflation was removed while making these comparisons.
Here’s another way you can look at these disturbing results: in 2000, the average spend (or income) of the richest group in urban areas was 12 times that of the poorest group; in 2012, it had increased to 15-fold. In rural areas, the disparity between the haves and the have-nots increased from 7 times to 9 times in these 12 years.
These stark findings emerge from a comparison of data on household spending patterns for 1999-2000 and 2011-12. These are collected by the National Sample Survey Organisation. Consumption spending — that is, all possible expenditure done by an individual in a household on all aspects of life — is the closest measure of incomes available in the country.
Clearly, economic policy that resulted in high GDP growth for most of this period has not trickled down to the neediest. Rather, it appears to be benefitting the already affluent sections more.
Growth highest for richest 10%, lowest for poorest 10%
Many experts argue that spending and hence income of the uppermost 5% is not completely reflected in NSSO surveys because those who do their surveys hardly manage to meet and fill out questionnaires of the super-rich households. In other words, the incomes of the super-rich are probably more than what is reflected in this data.
The richest 10% of Indian society have seen highest growth while the poorest 10% have seen the slowest increase in incomes. The remaining 80% of the people have seen roughly the same levels of growth ranging between 35% and 40% in rural areas and between 40% and 50% in urban areas over 12 years. That means that for 90% of people, annual growth in income was just over 3% in rural India, and just over 4% in urban India.
In 2012, a person of the poorest segment in rural areas was spending just Rs 521 per month. So, a family of four would spend about Rs 2,084 per month. In the richest segment, a person spent Rs 4,481 per month which would translate into a monthly spend (or income) of Rs 17,925 for a family of four. In urban areas, monthly spending by the poorest segment was Rs 700 per person or Rs 2,802 for a family of four and for the richest group it was Rs 10,282 per person or Rs 41,128 for a four-member family.
Expenditure per person on food
Details of spending on different items provided by the report show that in urban areas, monthly expenditure per person on food was less than Rs 1,000 for 50% of the population while in the richest segment every person on an average spent Rs 2,859.
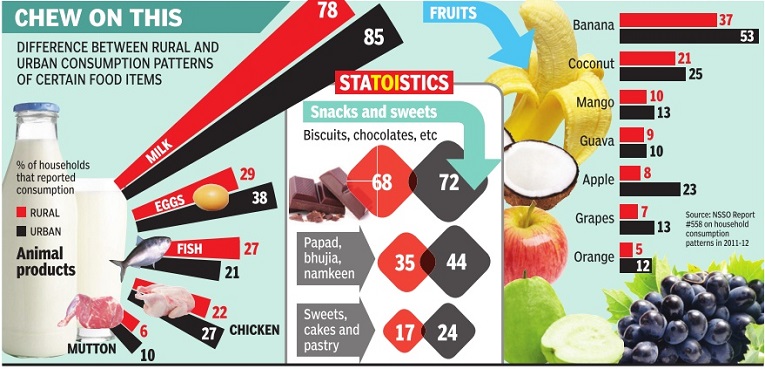
Some of the food items showing vast disparity between rich and poor included vegetables, fruits, eggs, fish and meat, and milk products.
The data blows the myth that poorer sections are consuming more of fruits, eggs, etc.
A similar multi-fold difference is seen in other key items of expenditure like education, medical and durable goods.
Household assets, rural/ urban
1981-2019
Land, Buildings Account For Bulk Of Household Assets Dec 6, 2021: The Times of India
From: Dec 6, 2021: The Times of India
See graphic:
Rural and urban household assets in India, 1981-2019
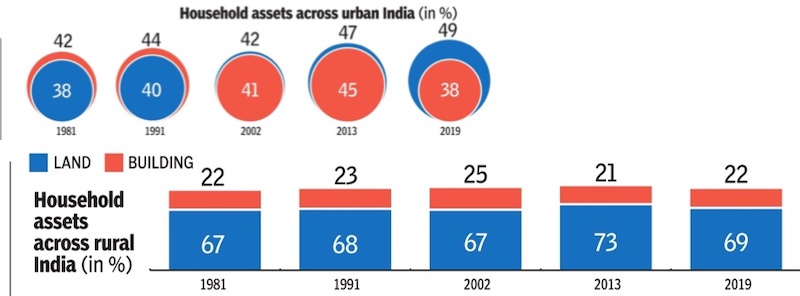
A massive 89% of household assets in India are in the form of land and buildings. In rural households, the figure is 91%, while that for urban households is 87%. This has been fairly consistent when compared to prior decades, with the numbers being around 90% of household assets in rural, and 80-90% of assets in urban. Only 7% of assets are financial — 9% in urban and 5% in rural.
Household expenditures
2018
Sep 11, 2021: The Times of India
The average rural household had a debt of just under Rs 60,000 while its urban counterpart had a debt of Rs 1.2 lakh. On the flip side, 35% of rural households were indebted compared to 22% in urban centres, a survey released by the National Statistical office (NSO) on Friday showed.
In rural areas, the average debt was Rs 74,460 for cultivator households and Rs 40,432 for non-cultivator ones. In urban areas, it was Rs1.8 lakh for self-employed households and Rs 99,353 for other households, the survey showed. In rural India, 66% of outstanding cash debt was from institutional credit agencies, but 34% was from non-institutional credit agencies. In urban areas, non-institutional lenders accounted for just 13% of the outstanding cash debt while 87% was from institutional credit agencies.
The average value of assets held by cultivator families in rural areas was Rs 22 lakh and for non-cultivators it was about a third at Rs 7.8 lakh. In urban areas, the average value of assets for self-employed households at Rs 41.5 lakh was almost twice as much as the average of Rs 22.1 lakh for other households.
The NSO’s All India Debt & Investment Survey was conducted during the period January-December, 2019 as a part of the 77th round of the National Sample Survey (NSS). The main objective of the survey was to collect quantitative information on assets and liabilities of households as on June, 30 2018.
About 84.4% of the population 18 years and above had a deposit account in banks in rural India (88.1% male and 80.7% female) not very different from the 85.2% in urban areas (89.0% male and 81.3% female). SCs had the lowest average value of assets at Rs 8.7 lakh in rural areas and Rs 13.2 lakh in urban areas. TNN
2015 or 16
See graphic: Households spends, 2015 or 16
2018-19

From: September 15, 2020: The Times of India
See graphic:
Household expenditures in Delhi, 2018-19
How Indians spend their money


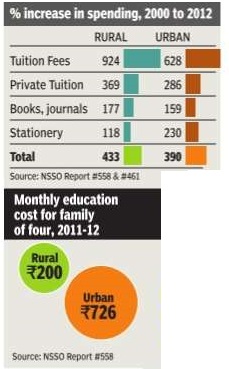


The Times of India Jul 13 2014
What's eating into our family budgets? Subodh Varma finds out
The major items of consumption/ 2004-12

From: July 5, 2019: The Times of India
See graphic, ' Expenditure on the major items of consumption/ 2004-12 '
2011-18: consumption Expenditure
July 5, 2019: The Times of India
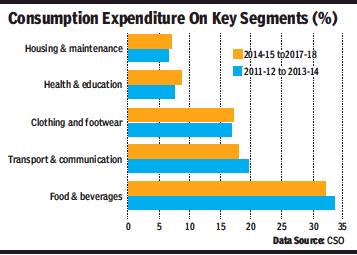
From: July 5, 2019: The Times of India
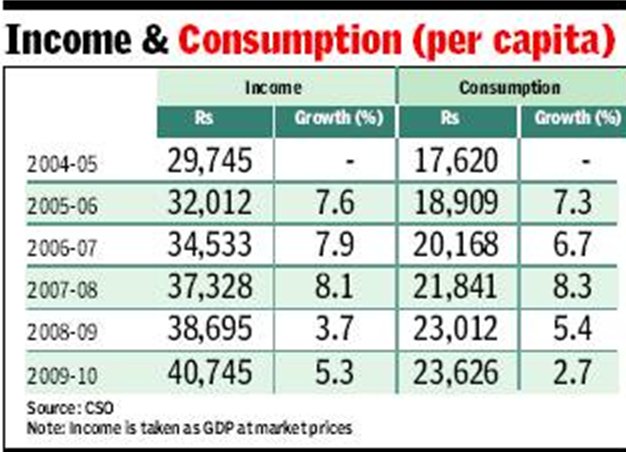
A rapid growth in per capita income is expected to translate into consumption accelerating at almost the same rate, triggering higher demand for everything ranging from TVs and motorcycles to health and education.
“India’s consumption story is a strong consumption story. One should look at it from a long-term perspective and a blip here and there really doesn’t matter. Companies are aware of this and in the next couple of years, the country’s consumption is set for a strong growth,” said founder of Future Group, Kishore Biyani.
Consumption has been a major concern with auto sales contracting for eight months in a row and consumer goods players complaining of tepid demand. A key reason for the slowdown is a slower pace of expansion in economic activity with GDP growth slowing to an 18-quarter low in January-March. During 2018-19, the economy grew at its slowest pace in five years and economists have called for reviving investment and consumption to boost growth.
The shift of consumer expenditure from necessities such as food and beverages and transport and communication towards clothing and footwear and health and education augurs well for the industry.
“Consumers have an aspiration about themselves beyond basic needs. Their non-discretionary spends reflect expression and ways to feel good about themselves. Social and digital media platforms have exposed people to the world in which they now want to experience and express,” said Puma India MD Abhishek Ganguly.
HEALTHCARE
| TESTING TIMES
We've all felt the pinch of medical bills, and now data from a recent survey on household spending shows why everyone's been feeling the pain. Total familyspend on medical bills increased by 317% in urban areas and 363% in rural areas for institutional care. At-home medical expenses increased by about 200% in both urban and rural areas.
Diagnostic tests -X-rays, ECGs, and pathological tests -are the driving force in this relentless upward movement.
For institutional care in hospitals and nursing homes, costs of tests increased by as much as 541% in urban areas between 2000 and 2012. No comparison is available for rural areas in the same period as test facilities were rare and mostly free in government hospitals. Even for the at-home patient, costs of diagnostic tests zoomed up by over 400% in the same period.
For an urban family of four, average medical expenses would be about Rs 200 per month for hospital care or nearly Rs 400 per month for at-home treatment and care. In rural areas, the average monthly costs for a similar family would work out to about Rs 120 for hospital care and Rs 250 for at home care. The higher costs even at home are mainly be cause of medicines.
Despite the enormous spending on National Rural Health Mission over the past seven years, and the attempts to expand an affordable health insurance scheme, the cost increases are substan tially more in rural areas compared to urban areas.
Thus, increases in doctors' fees in hospitals were 433%in rural areas compared to 362% in urban, hospital charges went up by 454%in charges went up by 454%in rural areas compared to 378% in urban areas and medicine costs in hospitals went up by 259% in rural versus about 200% in urban areas. Keeping the patient at home and getting treated seemed a better option in rural areas because at-home costs were not as high as institutional costs.
What this carnage of family budgets has led to is worrying but unsurprising: there has been a decline in cases of hospitalization. The number of families that reported expenditure on hospitalization dipped from 19% to 14% in urban areas and from 19% to 15% in rural areas. Lack of proper facilities at accessible distances is also a factor in dipping cases of hospitalization in rural areas.
Conversely , families that spent on patient care at home increased from 61%to 75% in urban areas and from 62%to 79% in rural areas. The new data is from a consumer expenditure survey carried out by the National Sample Survey Organisation (NSSO) in 2011-12.
EDUCATION
| COST OF FEES, TUITIONS SKYROCKETS
Even as the thirst for education has increased among Indians, the sys tem has become more expensive and its quality has gone down. Family spending on education increased by a jaw-dropping 390% in urban areas in 2011-12 and 433% in rural areas compared to 1999-2000.
The biggest increase is in the fees charged by educational institutions -628% in urban areas and an incredible 924% in rural areas. Costs of other related items of expenditure, like books and stationery, too have shot up in the past 12 years.
That there is a deep felt urge to get the children educated and thus build a better life than their elders is undoubtedly true. This is confirmed by the fact that the number of families reporting spending on education has increased from 68% to 76% in urban areas and from 54% to 66% in rural areas.
But the families have to bear a heavy burden of this cost. In urban areas, a family of four would spend Rs 726 per month on an average while in rural areas a similar family would spend Rs 200 every month.
Apart from this di rect spending, various other costs are also incurred by families including uniforms for school going children, transport to and from the school and other incidental costs.
The survey shed some light on what is called the `shadow education system', that is, private tuition and coaching. In 2012, about 12% of families in rural areas were getting their kids' education boosted by these parallel establishments, up from seven percent in 2000.
In urban areas private coaching had spread to over 17% families from 15% in 2000. Costs of such private coach ing have increased by nearly 300 percent in urban areas and 369% in rural areas. Education spending is highly dependent on how much the family's income is. And it varies sharply between rural and urban areas. The rich est 5% families in urban areas spend over Rs 900 per person while the poorest spend just Rs 16 per person.
In rural areas, the richest 5% In rural areas, the richest 5% spend nearly Rs 300 per person on education while the poorest spend only eight rupees per person in a month.
FOOD
THE ALOO-PYAAZ THALI
Ever wondered why the rise in prices of onions and potatoes sends governments into a tizzy? The reason is that 91% families in rural areas and 86% in urban areas consume potatoes. Similarly, 96% families in rural areas use onions and 91% in urban areas. So, with practically the whole population addicted to these two vegetables, it is small wonder that high prices get everybody agitated. It also indicates that those who want to manipulate prices and make a quick buck are most likely to target onions and potatoes as very few will cut these out of their meals. Of course, it is possible to hoard these two vegetables because they are not as perishable as most others.
Consumption data from a recent NSSO report shows that apart from onions and potatoes, tomato is the most widely used vegetable, with 75% of rural and 85% of urban families consuming it. Green chillies are also consumed by over 80% of the population.
What about other vegetables? Spinach and other leafy vegetables (of which there are several in India) are con sumed by about 60% of the population. Brinjal (or eggplant) is also popular -nearly 60% of rural and 54% urban families eat its preparations.
Lady's Finger (okra), cauliflower, cabbage and carrots are more popular in urban than rural arebut the whole gourd family -sweet-, long, bit ter-, bottle-gourd, along with the pumpkin family are favoured more in rural areas, perhaps because of their ease of cultivation and very low costs.
Total monthly consumption of vegetables is about 6.8 kg per person in both rural and urban areas, perhaps one of the very few consumption items where there is no rural urban divide.
What about pulses, the single biggest source of protein for a largely vegetarian population? Worryingly, consumption of pulses had been declining over the years, mainly because of its sustained high prices. But there has been a slight revival in the past 2-3 years. Even then, per capita consumption of pulses has dipped by about 7% between 2000 and 2012. Arhar (tur) is the most popular dal with about 60% rural and 75% urban families consuming it.
About a quarter of the population reported eating fish or meat, while about 38% families ate eggs. The number of non-vegetarian families has probably dropped because high prices often drive people to stop eating meat except on occasions. Households eating fish and goat/mutton have declined since 2000 while chicken is now the meat of choice with 22% rural and 27% urban families eating it.
Vegetarian, non veg- thalis, 2006-20

Per capita net national income, 2007-19.
From: February 1, 2020: The Times of India
See graphic:
The affordability of vegetarian and non- vegetarian thalis, 2006-20
Per capita net national income, 2007-19.
Cost of a Plate of Food, as in 2019
October 17, 2020: The Times of India
On an average an Indian spends 3.5% of their daily income for a plate of food compared to 0.6% by a New Yorker, according to the “Cost of a Plate of Food” report released by the UN’s World Food Programme (WFP) on Friday.
The report said that a plate of food is most expensive in South Sudan where people on average would have to spend 186% of their daily salary on basic ingredients. In the list that features 36 countries across the globe, India stands at the 28th position.
The report brought to light how countries in sub-Saharan Africa feature heavily in the list with 17 nations from this region occupying thetop 20 slot. “The region’s high dependency on food imports leaves it vulnerable to global economic conditions, while high use of informal labour means many workers are vulnerable to sudden losses of income,” it said. The report said that such a difference brings into sharp focus the huge inequalities at play between people living in the developing countries and others in more prosperous parts of the world.
2019> 2021 Jan

From: January 30, 2021: The Times of India
See graphic:
The Cost of a Plate of Food, 2019> 2021 Jan
How rural households earn, spend, invest
In the 2010s
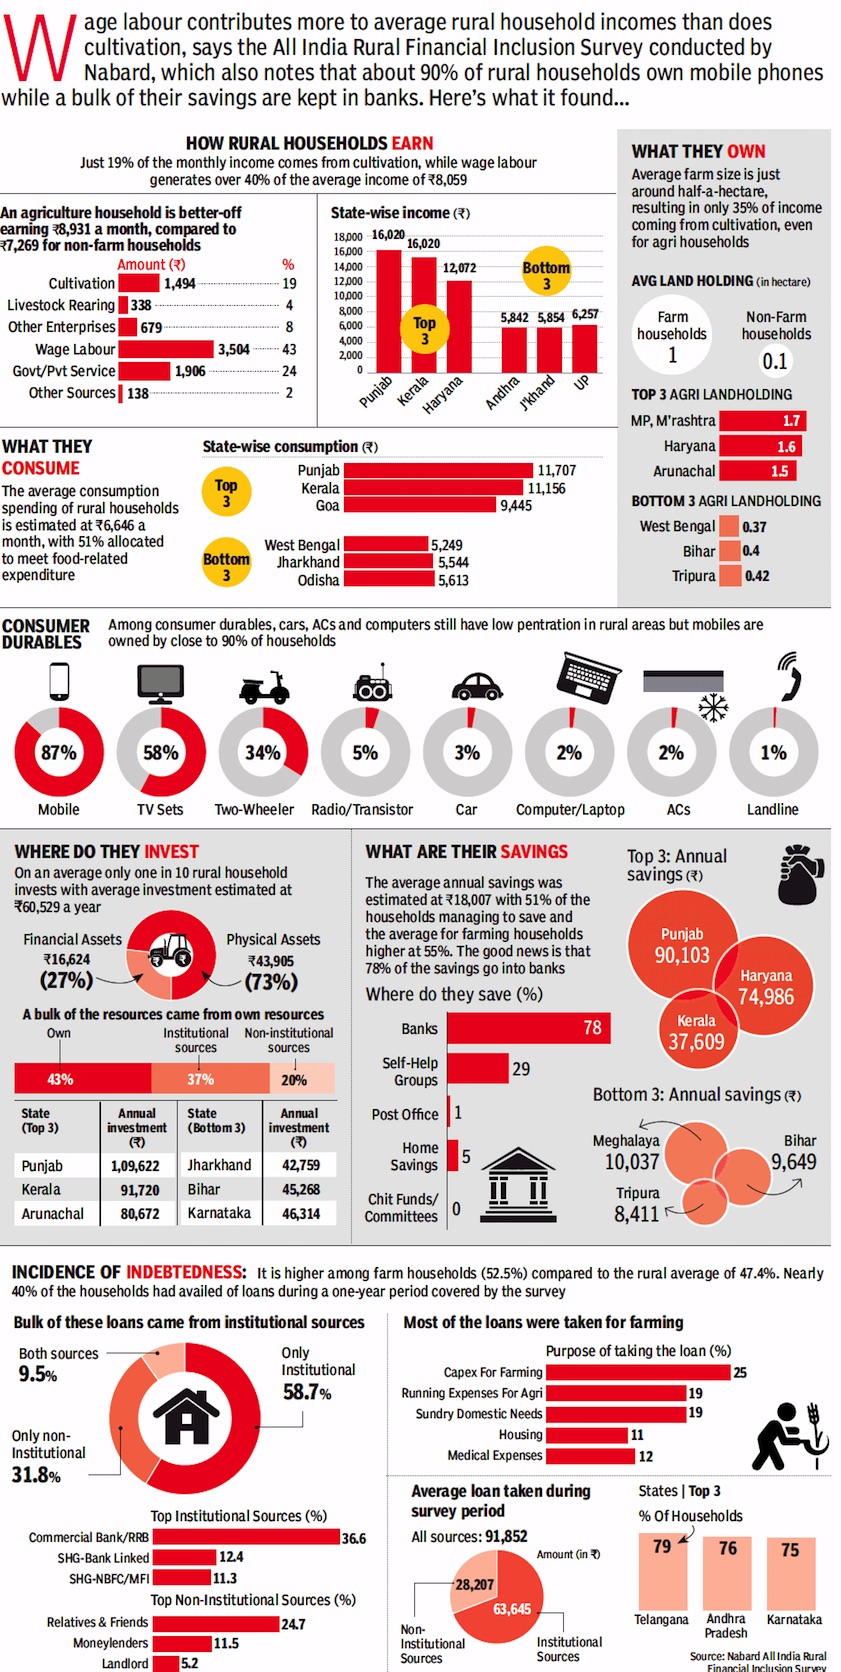
From: August 18, 2018: The Times of India
See graphic:
How Indian rural households
i) earn,
ii) spend, and
iii) invest.
iv) The states with the highest and lowest incomes.
v) Ownership of assets.
How well-off, single urbanites spend
Financial goals of the middle class, 2009> 2019
PREETI KULKARNI, Oct 21, 2019: The Times of India

From: PREETI KULKARNI, Oct 21, 2019: The Times of India
It will be remembered as the decade when the Indian middle class threw caution to the winds and turned aspirational with a vengeance. Between 2009 and 2019, the share of discretionary expenses in a household’s monthly outgo shot up from 10-20% to 25-60%, according to financial planners. Saving for a child’s marriage made way for saving for an international vacation. As an ET Wealth study involving 22 financial planners and wealth managers reveals, over the past decade, middle class households pursued the good things in life on the back of rising disposable incomes and consumerism. And it reflected in the way goals were prioritised. The study captures the changes in financial behaviour over the past decade and lays down a roadmap for the next 10 years, factoring in likely future goals.
Tracking the change
In 2009, the top five goals of an average Indian family included children’s education, marriage, buying a house and a car and saving for retirement (see chart). In 2019, international vacation figures prominently in the list, with almost every participant in the study identifying it as a key goal of their clients. On the other hand, children’s marriage seems to have dropped down the list of priorities. More than half of the study’s participants say this was a key goal for their clients in 2009. However, only a quarter identified it as a priority goal in 2019. Children’s education, buying a house and retirement, however, remain the constants in the list.
Rising lifestyle inflation is the new reality. Frequent gadget upgrades, purchase of fitness devices, private cab rides, gated housing complex charges, salon and spa expenses, pet-related spends and so on have pushed up the share of discretionary expenses.
New challenges, fresh approach
These newer expenses and goals call for tweaking the financial planning approach to avoid the risk of overspending and a debt trap, say experts. “Categorise spends into immediate, short-term, long-term and unnecessary buckets and stick to this priority list,” says Nisreen Mamaji, Founder, Moneyworks Financial Advisors.
The other strategy is to acquaint yourself with the gravity of challenges that await after retirement, to help put a lid on discretionary expenses. “This helps decide the limit on discretionary spending,” says Rahul Jain, Head, Edelweiss Personal Wealth Advisory. Besides buying a pure risk life cover that is equal to at least 10-15 times your annual income, ensure you buy a health cover of at least ₹5 lakh and review it every five years. Also, to manage health expenses, do not rely solely on a health insurance policy.
Eye on the future
The next 10 years are unlikely to defy the ‘change is the only constant’ adage. According to financial planners, some expenses that do not weigh heavily on your finances today and seem like luxuries could become must-haves in future. These include cost of hospitalisation with single occupancy, senior living expenses, inflated water bills due to paucity, high-end security systems, gadgets, regular upskilling, pet-related expenses, installing air purification plants at home and so on.
Besides, one will have to plan for regular goals like retirement and children’s higher education, and create additional cushion to deal with unexpected situations. “Planning for job losses and redundancies is a must as such incidents could be more frequent in future,” adds Vishal Dhawan, CEO, Plan Ahead Financial Advisors. He recommends controlling lifestyle expenses and increasing exposure to growth assets like equities to beat inflation, besides ensuring that your portfolio has exposure to international funds for diversification. Similarly, investment for long-term care of senior citizens, your parents or yourself, is non-negotiable.
Besides the ‘newer’ expenses listed earlier, the future could see the emergence of completely unforeseen expenses, which would need an investment buffer. “Therefore, you have to start setting aside 10% of your income every month for these futuristic expenses,” says Rachit Chawla, Founder & CEO, Finway.
As in 2018

From: Namrata Singh, New class of single urbanites emerges as ‘super consumers’, August 20, 2018: The Times of India
Move over DINKs, WSUs are the new “super consumers”.
Distinguished from other demographics in their lifestyle, such as DINKs (double income, no kids), and defining the trend of premiumisation, a new class of wealthy, single urbanites (WSUs) has emerged. WSUs are 28-42-year-olds, forming 1% of India’s 1.3 billion people, which makes them 13-million strong. Going by their standards of living and greater disposable incomes — earning upwards of Rs 50,000 per month — marketers call them “super consumers”.
Life choices of “super consumers” include staying away from their families, but, at the same time, keeping their kitchens well stocked and using high-tech gadgets and appliances, which has made WSUs a discerning consumer base for marketers.
A study on WSUs by Nielsen, shared exclusively with TOI, finds that single-person households have increased by about 35% between 2007 and 2017, mainly in urban areas. “This is primarily because of millennials migrating to bigger cities for jobs. As they do not have familial responsibilities, it is up to their discretion to spend their disposable income. Due to their risk-taking attitude and willingness to try unconventional things, they will be the first movers in any category which interests them,” said Arjun Urs of Nielsen India. Of the WSUs, 25% have air purifiers in their households, a category that is fairly new in India.
The study, which carved out WSUs from 440 millennials, found that the new consumer segment spends a significant amount of their income on food and drinks ( see graphic). They save 18-22% of their monthly incomes, indicating that they take financial planning very seriously. They spend on a variety of clothes for every occasion. Approximately 40% of Indian and party wear clothes are washed separately from regular clothes.
What’s more, WSUs work for long hours and place career and money matters as topmost priorities. Marriage appears to take a back seat among these single urbanites. But breaking away from earlier myths associated with single-working people living independently, Nielsen found that WSUs like to cook, socialise and find the time for sporting activities. They’re also health conscious. Of WSUs, 75% don’t mind having a salad — even at parties held indoors — and 70% have either a gym or sports club membership.
Although WSUs have a higher disposable income, they are poor on time. Few tech-appliances and gadgets to which WSUs are early adopters, include virtual assistants and devices like smart slow cookers.
They’re big on ready-to-eat products and packaged foods as well. ITC divisional CEO (foods division) Hemant Malik said, “As a result of their hectic schedules, these urbanites are vulnerable to several lifestyle-related complications, yet they never compromise on health, neither do they let go of their share of indulgence, fun and luxury.”
Marketers have designed products that cater to such aspirations and at the same time help companies premiumise their offerings and move up on the value sales chart. Given the need for personalisation for mostly such affluent consumers, Shoppers Stop introduced ‘Personal Shopper’ service across its stores, and the same reflects in the ticket size having tripled of those availing this service in-store.
Shoppers Stop MD & CEO Rajiv Suri said, “We’ve noticed single-urban wealthy consumers are frequent shoppers with higher disposable incomes. In contrast to families, their buying behaviour is convenience-driven and is coupled with high brand sensitivity, affinity and a disposition towards premium apparels, beauty and accessories, given the higher discretionary income, no dependents and an asset free life with the emergence of platforms for transport to homes.”
Shoppers Stop digs into its vast data and analyses it to offer differentiated buying experiences. “This has helped us to identify and display customised premium brands, while offering curated fashion relevant for a store in Juhu versus Chembur or Vashi in Mumbai,” said Suri.
Rural poor
2012: Poor in villages live on Rs 17 a day, in towns on Rs 23 a day
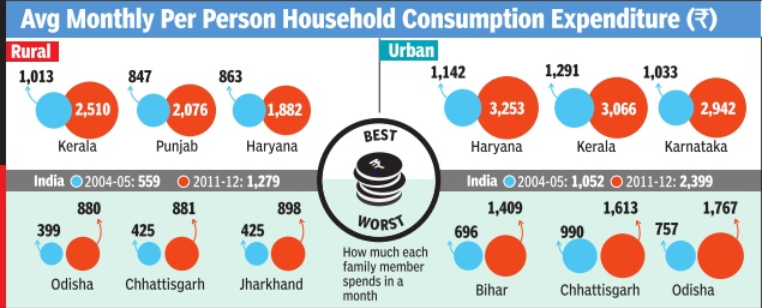
Mahendra Singh, TNN | Jun 21, 2013
Poor in villages live on Rs 17 a day, in towns on Rs 23 a day: Survey
The average monthly spending on all-India basis was around Rs 1,430 for rural India and around Rs 2,630 for urban India, a government survey has revealed. The poor in rural areas spend only Rs 17 per day while those living in cities and towns spend Rs 23 a day, a government survey has revealed.
Top and bottom 5%
The bottom 5% of the population had an average monthly per capita expenditure of Rs 521.44 in rural areas and Rs 700.50 in urban areas, according to National Sample Survey (NSS) data for 2011-12 (July-June).
The top 5% of the population had an average monthly spending of Rs 4,481 per month in rural areas and Rs 10,282 in urban areas.
While there is no upper limit for spending for the top 5% segment, the maximum spending by those falling at the bottom of the ladder is Rs 616 a month (Rs 20.5 a day) in rural areas and Rs 827 (Rs 27.5) in urban areas.
The average monthly spending on all-India basis was around Rs 1,430 for rural India and around Rs 2,630 for urban India. This means those living in cities are spending about 84% higher than their rural counterparts.
Food
In cities and towns, food accounted for 42.6% of the value of household consumption which included 9% on beverages, refreshments and processed food, 7% on milk and milk products, and 6.7% on cereals and cereal substitutes. Education accounted for 6.9%, fuel and light 6.7%, conveyance 6.5%, and clothing and footwear 6.4%.
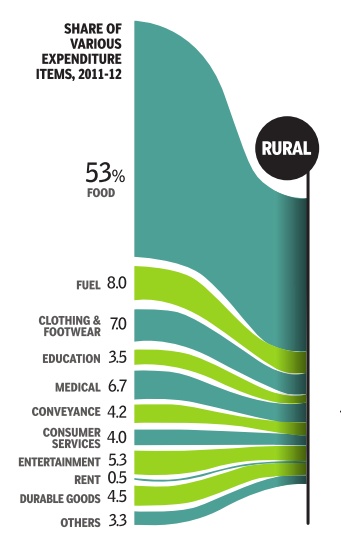
In rural India, food accounted for 52.9% of the value of consumption that included 10.8% on cereals and cereal substitutes, 8% on milk and milk products, 7.9% on beverages, refreshments and processed food, and 6.6% on vegetables.
Non-food items
Among non-food items, fuel and light for household purposes (excluding transportation) accounted for 8%, clothing and footwear for 7%, medical expenses for 6.7%, education for 3.5%, conveyance for 4.2%, other consumer services (excluding conveyance) for 4% and consumer durables for 4.5%.
Even in rural areas, spending on cereals has seen a declining trend as it came down from 18% in 2004-05 to 12% in 2011-12. In urban India, it came down from 10.1% in 2004-05 to 7.3% in 2011-12.
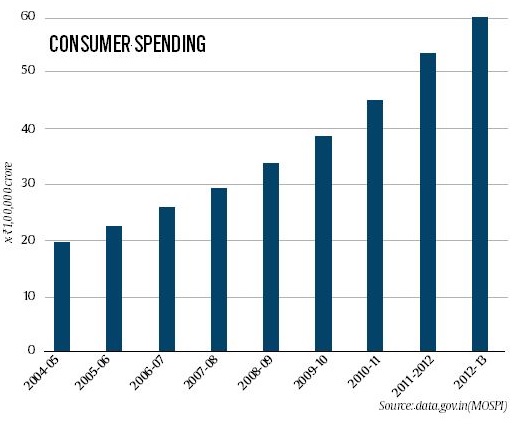
Apart from beverages, none of the food items such as grams, pulses, milk, fish, vegetables showed any noticeable increase in share in both rural and urban India. The spending on pan, tobacco and intoxicants fell noticeably over the years since 1993-94 though the decline appears to be flattening out.
The spending on "miscellaneous goods and services" category (including education, medical care and entertainment) has grown significantly — from 23.4% in 2004-05 to 26% in 2011-12 in rural areas and from 37.2% in 2004-05 to nearly 40% in urban areas.
As far as states are concerned, consumption expenditure in villages of Odisha and Jharkhand were the lowest, followed by Bihar, Madhya Pradesh and UP. In urban areas, Bihar had the lowest expenditure followed by Chhattisgarh, Odisha, Jharkhand and UP.
Rural consumption
2015-16: Chrome DM's detailed breakdown of expenditure
2015-16 has been presumed
NamrataSingh, Rural India spends more on booze than health, Nov 01 2016 : The Times of India
Monthly FMCG Bill Is Rs 504 With Foods Accounting For More Than Half Of It
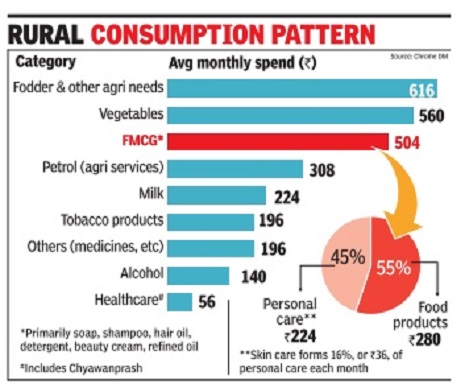
Rural India spends about three times more on alcohol (Rs 140) and tobacco (Rs 196) than healthcare (Rs 56) each month. And Rs 500, which could perhaps be the price of a meal for two at McDonald's, is what an average rural household spends every month on fast-moving consumer goods (FMCG) like foods items, soaps, detergents, shampoos and hair oil.According to a survey , shared exclusively with TOI, the monthly expenditure on other items including medicines in rural India is restricted to Rs 196.
The report showcasing consumption patterns reveals that arural household spends Rs 504 a month on FMCG products, roughly 18% of the total monthly budget of Rs 2,800. Of this, food products contribute a major chunk -55% or Rs 280. Skincare and cosmetics are still a luxury with a monthly average spend of Rs 36, according to the rural establishment report by Chrome Data Analytics & Media (Chrome DM), a primary research and data analytics company .
Total monthly spend on FMCG is higher as compared to expenditure on milk (Rs 224) and petro for agriculture services (Rs 308), the survey reveals. “Rural households rely heavily on the milk produced by the cattle that they own,“ said Pankaj Krishna, MD, Chrome DM, “ As for the low expenditure on healthcare, rural India still prefers domestic cure and natural home remedies over medicine.“ The survey , conducted in 50,000 villages across 19 states, says merely 1% of the households spend more than Rs 1,000 a year on skincare and cosmetics, while a majority (63%) spends less than Rs 400 a year on this category . Krishna says skincare products are still part of luxury budget in rural India, and spending on the category is affected by low disposable income. There is also an availability issue of the brands. According to the report, 17% use unbranded skin products, while 21% of the households do not use any skincare product whatsoever.
Jean-Christophe Letellier, MD, L'Oreal India, said Rs 36 per month per rural household on skincare and cosmetics is a fair assessment. “Two years ago, the number would have been lower for a rural household. In comparison, an average urban household spends Rs 150 per month on skincare and cosmetics. So, it's four times the rural spends as of now. If you take just the middle class urban consumer, the spend would drop to half (Rs 75 per month per household).It is still double the rural spends.When we talk about shifting consumption, India is slowly but surely following an upgradation process on beauty categories in general,“ said Letellier.
On rurbanisation -rural markets acting like and evolving into urban markets -Letellier said, “We see a slow but regular upgradation of rural consumers acting as urban consumers. The rural part of India is relatively dynamic even though the monsoon has been bad (for two previous years). In our categories, the rural market is growing structurally faster than urban markets.“
It is mostly low-unit price packs and accessible formats like product sachets that are sold in rural areas. Rural regions contribute nearly 36% to the overall Rs 3,20,000-crore FMCG market.
Rural and urban spending
Gujarat slides in both rural & urban spending
Data Raises Doubt Over Devpt Model
Subodh Varma TIMES INSIGHT GROUP
The Times of India 2013/07/22
How are people in their states actually faring? How does one know whether one ‘development model’ is better than another?
One way is to look at how much a person spends on an average every month; this gives an indication of how much people are earning. Comparing recently released data on consumer expenditure with data from a decade ago provides a fair idea of which state governments are delivering and which are sliding. There’s a surprise lurking there.
Gujarat slides down
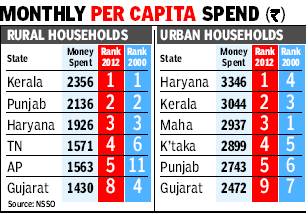
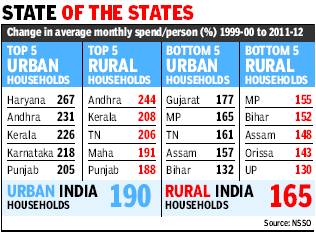
Gujarat has slid from fourth to eighth in the ranking of states for rural spends, and from seventh to ninth in urban expenditure, according to a comparative analysis of data on monthly per capita spending between 2011-12 and 1999-2000, both of which are put out by the National Sample Survey Organisation.
Amartya Sen backs Bihar’s growth model
Nobel laureate Amartya Sen on Sunday backed Bihar’s growth strategy arguing that growth was not independent of social transformation.
“What is needed is an integrated approach for development and growth,” Sen said at a book release event. The noted economist suggested that without education and proper health facilities, it was difficult to achieve balanced growth. “Educated labour force is the biggest guarantor. Education and healthy labour force is able to produce everything from IT to auto parts,” Sen said.
At the same time, he recognized the impressive growth rate, of over 11%, recorded by the eastern state during the 11th five-year plan (2007-2012) and said it was an important indicator.
Sen’s praise for the Bihar model is significant because the build-up to the general elections has also been framed as a duel between competing models of growth. One is the inclusive growth model which UPA and Bihar claim to represent, which won praise from Sen. The other, Gujarat’s emphasis on higher rate as the solution to poverty reduction, is backed by the likes of Jagdish Bhagwati and Arvind Panagariya.
While the state ranks poorly on most human development indicators, its performance has improved in recent years, which economists say is driven by better administration and steps to improve literacy and health facilities. Bihar is demanding special state status — to access more central funds and offer tax incentives to attract investment to bolster its growth and development. Chief minister Nitish Kumar has been at the forefront of the demand and even organized a rally in the national capital to press for the tag.
Renowned economist Nicholas Stern, who has co-edited the book with Rajya Sabha member N K Singh, pushed for a special status tag. “From the point of view of poverty, distribution of income and point of view of demonstrating change, a special category status would be appropriate,” he said.
Andhra, TN climb on progress graph
Gujarat may be the poster boy of development and economic growth, but is one of the few states that have slid in economic rankings. Consumption expenditure of people in Gujarat is growing at a slower rate than the national average, according to a comparative analysis of data on monthly per capita spending between 2011-12 and 1999-2000, both of which are put out by the National Sample Survey Organisation (NSSO)
Andhra, The best-performing state
The best-performing state is Andhra, which has dramatically improved from 11th place in 2000 to fifth in 2012 in rural households and from 11th to sixth in urban households.
Another state that has shown major movement in rankings is Tamil Nadu, moving down from second to seventh place in urban per capita expenditure but improving from sixth to fourth in rural.
Kerala, Punjab, Haryana, TN and AP are the top five states in rural households; Haryana, Kerala, Maharashtra, Karnataka and Punjab are the top five in urban households.
Growth rates of household expenditures
The same reality is reflected in growth rates of household expenditures over the period. At the national level, average per person spends grew by 165% in rural areas and 190% in urban areas between 2000 and 2012. Among the states with MPCE growth of urban households lower than the national average, Gujarat (177%) lies tied with Rajasthan, lower than Uttar Pradesh and West Bengal but higher than Assam and TN.
Among rural households, per capita spend in Gujarat grew by 165%, again below the national average of 170%. Most of the poorer states like UP, Bihar, MP and Odisha were also below the national benchmark. In Haryana too rural incomes are barely above the national average.
At the other end, the states with high expenditure growth were AP, Kerala, Punjab, Maharashtra in both rural and urban areas, with TN only joining the leaders for rural households.
Rural vis-à-vis urban consumption
2014> 21

From: August 30, 2021: The Times of India
See graphic:
Rural vis-à-vis urban consumption in India, 2014> 21
Urban consumption
2012-15: An increase
The Times of India, Aug 20 2015

Urban consumption shows signs of revival
Rupali Mukherjee
Urban consumption growth appears to be showing signs of improvement, with the fastest-growing segments for the top 200 cities being multiplexes, retail apparel and quickservice restaurants. Not only consumption patterns, job opportunities and financial infrastructure have also shown a revival over a four-year period since March 2011. Given India's favourable demographics and rising income, the stage is set for urbanization growth to continue for years to come, though the density of the drivers is still not enough to meet the requirements and in come of the population, analysts say. Since 2011, growth in the financial infrastructure index has outpaced that of the other indices (consumption and job opportunities).
Financial infrastructure has been the fastest-growing segment among the three indices, with ATMs being the key driver for the strong growth, says an analysis done by Morgan Stanley of over 250 cities across the country .
The ATM to bank ratio rose to 1.3x from 0.8x since March 2011 for the top 50 cities, while for the top 200 cities, it increased to 1.2x from 0.7x. The annual growth in ATMs is about 25% for the top 50 and 200 cities. In fact, the top 200 cities showed the fastest growth in the consumption index since March 2011, while overall it showed a stable and steady growth through the period.Multiplexes, followed by luxury cars and restaurants (new age food chains) have been the fastest-growing components with in the consumption index, while retail hypermarkets have been the biggest laggard in terms of growth. The shares of luxury car dealerships and multiplexes have grown the most in the consumption basket during the period, at the cost of lost shares for retail hypermarkets and non-luxury car dealerships. The AlphaWise City Vibrancy Index (ACVI) studied the drivers of urbanization and the rate of change, with key ingredients including infrastructure, job opportunities, modern consumer services, and a city's ability to mobilize savings. On a 12month basis, however, the ACVI for the top 50 cities grew 13% YoY as against 15% YoY in F2014. The consumption index showed a slight acceleration in growth to 13% year-on-year, while job opportunities and financial Infrastructure decelerated to 8% and 17% in F2015 as against a growth of 12% and 20.5% respectively in F2014.
