Bihar: Economy and development
This is a collection of articles archived for the excellence of their content. |
Contents |
Caste and economic status
Poverty among ‘upper’ castes
2022

From: Abhay Singh TNN, Nov 8, 2023: The Times of India
See graphic:
Poverty among the ‘upper’ castes of Bihar, 2022
Developmental indicators
1960, 2019

From: November 11, 2020: The Times of India
See graphic:
Bihar, Developmental indicators: 1960, 2019
1990-2020
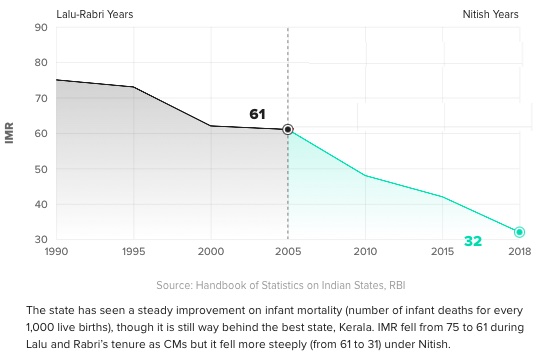
From: October 31, 2020: The Times of India

From: October 31, 2020: The Times of India

From: October 31, 2020: The Times of India
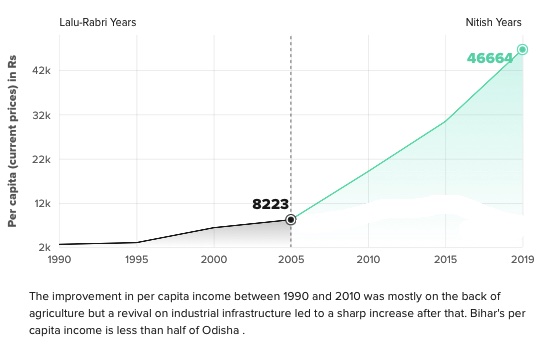
From: October 31, 2020: The Times of India

From: October 31, 2020: The Times of India

From: October 31, 2020: The Times of India

From: October 31, 2020: The Times of India

From: October 31, 2020: The Times of India
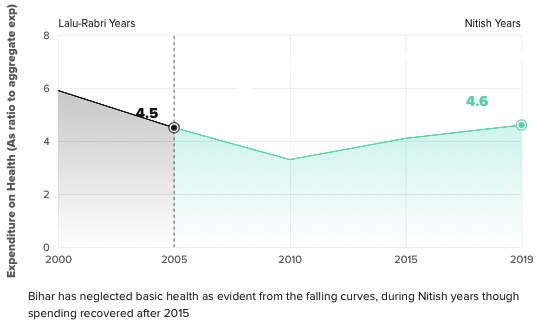
From: October 31, 2020: The Times of India

From: October 31, 2020: The Times of India
See graphics:
How safe is Bihar to be born in?
Life expectancy in Bihar, 1997- 2017
GSDP- Bihar, 1991- 2019
Per capita (current prices) in Rs., 1990-2019
No. of factories in Bihar, 1990- 2017
Total IPC crimes in Bihar, 1990-2019
Total IPC crimes in Bihar, 1990-2019
Murders in Bihar, 1990-2019
Rapes in Bihar, 1990-2019
Expenditure on Health in Bihar, 2000-2019
Expenditure on Education in Bihar, 2000- 2019
Economic/ developmental indicators
1960-2020
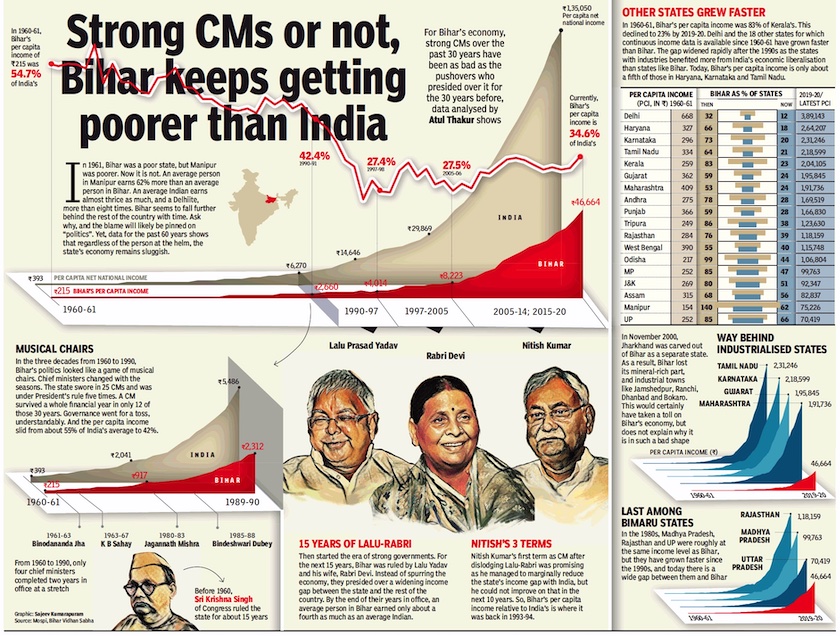
From: October 16, 2020: The Times of India
See graphic:
Bihar, economic indicators, 1960-2020
2004-15
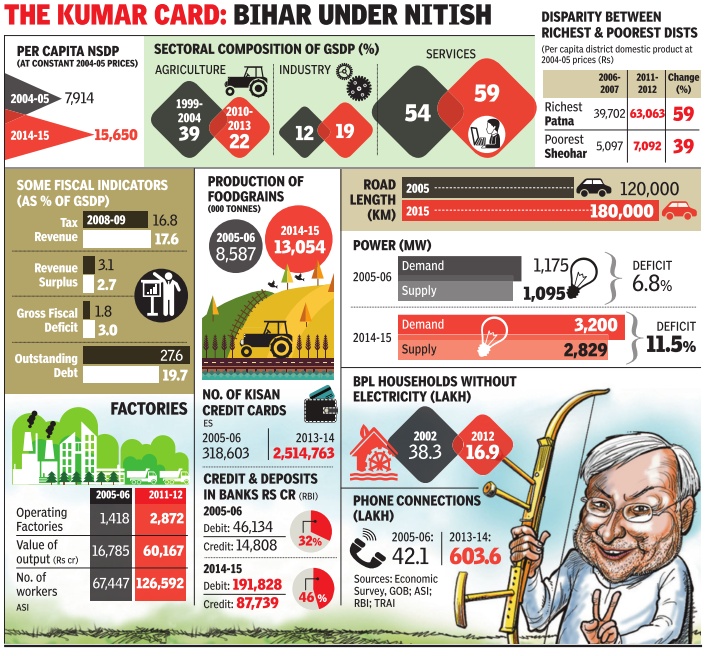
See graphic:
Bihar, developmental indicators, 2004-15 (The ‘Nitish Kumar years)
Employment
Unemployment
2018,2019
Atul Thakur, October 26, 2020: The Times of India
The latest estimate of the Periodic Labour Force Survey conducted by the National Statistical Office, which is the primary source to gauge the job situation in the country, shows that between July 2018 and June 2019, Bihar saw one of the country’s highest youth unemployment rates.
Among large states, only Kerala with 35.2% reported a higher unemployment rate among the youth (15-29 years of age) than Bihar’s 30.9%. About a third of youth in these two states couldn’t find jobs despite actively seeking employment.
‘Once a biz hub, Mokama shadow of former self’
Akhilesh Kumar, a 21-year-old youngster from Puraibagh village in Barh Vidhan Sabha constituency, says job prospects in the state are bleak. Kumar, who stays in Patna and is preparing for various competitive exams, asserts that hard work is the only key to success, and with perseverance he will soon land a government job. “What will Nitish do in this?” he asked. Kumar’s words are echoed by Pawan, a younger relative who too is a student in Patna. Both are satisfied with Nitish Kumar and say their families will vote for him this time too.
“Our first duty is to stop ‘Jungle Raj’ from coming back,” says an assertive Gyan Ranjan Kumar, a 25-year-old Rajput youth who, like Akhilesh and Pawan, is sure that the BJP candidate will win easily in Barh constituency. Rajgir Yadav, who is approaching his 40s, works in Gujarat and has been stuck in his village for the past few months, agrees that BJP has an edge in this seat as the caste arithmetic is working in its favour.
On the way from Barh to Mokama, this reporter met three more youngsters who were contractual employees of NTPC Barh and were on their way home. While they complained about the exploitative nature of contractual employment and the absence of public transport, they refused to be named in the story.
“A few days ago, a 21-yearold drowned at this ghat,” says Amit Kumar from Mokama Ghat. A 25-year-old unemployed B.Com graduate, Kumar is a Paswan who usually lives in Benaras for his exam preparation but has been stuck in Mokama since the lockdown. “Every year, at least 20 people drown here and nobody seems to be concerned,” adds Jwala Kumar, a 20-year-old Chandravanshi Kahar, who was forced to discontinue his studies and supports his family by doing various odd jobs that also include manual labour.
Asked why youths were seeking only government jobs, Amit points to the lack of decent private jobs in the state. “Today we have to migrate to other cities, but Mokama was once an industrial town that attracted migrant workers from elsewhere,” he says. Among large states, Bihar has the lowest labour force participation rate (LFPR) among its youth (15-29 yrs population). Economists blame the low LFPR to unwilling withdrawal of labour from the job market. Compared to the national average of 38.1%, only 27.6% of Bihar’s youth actively seek jobs.
Incidentally, Jim Corbett started his career from Mokama, where he, as an 18-year-old teenager, was employed by the railways at Mokama Ghat. “Today, the city is a shadow of itself. Factories of Bata and United Spirits have shut down and there is no hope of them reopening,” says Amit. Tarun Kumar, a footwear engineer who was a contractor with Bata, says, “The Bata factory ceased operation in 2014 while the whiskey factory shut down in 2016.”