Nutrition: India
This is a collection of articles archived for the excellence of their content. |
Contents |
1993-2011: Changes

Dec 27 2014
India's eating habits may have changed, but not nutrition levels
Subodh Varma
In the past two decades, India's eating habits have changed but the nutritional level seems to be the same, a recent survey has found. Across the board, people are eating less cereals, replacing them with more fat and snacks, beverages and processed foods. Protein consumption has declined in rural areas and remained the same in urban areas. The average calorific val ue of food consumed was 2,099 kilocalories (Kcal) per person per day in rural areas and 2,058 Kcal in urban areas in 2011, according to the survey report released last week by the National Sample Survey Organisation (NSSO).This is less than the nutritional value in 1993-94, when a similar survey had found the levels at 2,153 in rural areas and 2,099 in urban areas.
The National Institute of Nutrition, ICMR, recommends 2,320 Kcal a day for a man aged 18-29 years, weighing 60kg and in a sedentary job. Kerala, Tamil Nadu and Gujarat have nutritional levels that are almost 10% lower than the national average for rural areas while UP, Punjab, Haryana and Rajasthan have levels 10 to 20% higher, according to a National Sample Survey Organisation (NSSO) survey .
Another shocking aspect is the huge difference in nutritional intake of the poor and the rich. In rural India, a person belonging to the poorest 10% of population has a daily calorie intake of less than 1,724 Kcal, which includes 45g of protein with protein consumption at about 45g and 24g of fat. At the other end, a person from the richest 10% segment consumes more than 2,531 Kcal every day , almost 47% more than the poor person. A similar chasm can be seen in protein and fat consumption too.
In urban areas, this gap is worse. The poorest people get less than 1,679 Kcal per day while the richest get over 2,518 Kcal each -a difference of nearly 50%.
80% in rural India don't get required nutrition
Almost 80% of rural people and 70% of urban people are not getting the government-recommended 2,400 Kcal per day worth of nutrition, a situation that has very harmful health implications, apart from its sheer in humanity .
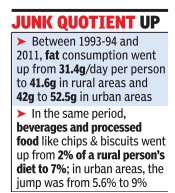
At the national level, daily protein consumption dipped from 60.2g for a person in 199394 to 56.5g in 2011-12 in rural areas and from 57.2g to 55.7g in urban areas. Oil and fat consumption increased from 31 to nearly 42g in rural areas and from 42 to 52.5g in urban areas.
The shares of items like fruits and vegetables, dairy products and egg, meat and fish was about 9% in 1993-94 which has marginally changed to about 9.6% in 2011-12.
The only food item that has seen a substantial jump in intake is classified as `other' in the survey and consists of various hot and cold beverages, processed food like chips, biscuits etc. and snacks. In 1993-94 these made up just 2% of a rural person's nutritional intake but rose to over 7% in 2011-12. In urban areas, this was 5.6% earlier and increased to about 9%.
The report also estimates that the survey would have counted food bought and prepared in a household but eaten by visitors or employees. If this is accounted for, calorific values get reduced by as much as 15-17% in rural areas and 5-6% in urban areas.
Nutrition surveys in South Asia
Apr 05 2015
Rema Nagaraja
No nat'l nutrition survey in last 10 yrs
Neighbours Pak, Bangladesh & Nepal Have Been Holding Regular Audits
They may have lower growth rates than India, but Bangladesh, Pakistan and Nepal are more prompt about conducting regular surveys on the nutritional status of their population. The last nutrition survey done in India was ten years ago despite its unacceptably high levels of malnutrition. Neighbouring nations have each completed two surveys each during this period.
There has been no district level nutritional survey in India since 2002, more than 13 years back. National Statistical Commission chairman Pronab Sen when speaking at a round-table event on nutrition data said that there was “too little nutrition data“ for policy makers and the new National Family Health Survey (NFHS) data would be cru cial for rolling out new policy programmes to address malnutrition and other health issues.
“There is enough evidence to show a huge variance in the status of nutrition of children in tribal and nonaccessible areas in a state vis-à-vis urban areas. For any nutrition or health scheme to be planned and implemented, it is therefore essential to have the district level data. However, it is ironic that the `latest' government data for districts available is 13 years old (DLHS -2, 2002). It is appalling that the planning of our nutrition related schemes is being done primarily based on the state data, without taking into consideration the critical variance within the states with respect to the most affected and marginalized,“ said Komal Ganotra, director of policy, research and advocacy in the NGO CRY -Child Rights and You. The Integrated Child Development Services (ICDS), a maternal and child nutritional programmes, is supposedly on a mission mode in almost 200 backward districts to address malnutrition. Districts are supposed to draw up a project implementation plan (PIP). But district ICDS officers are expected to draw up the PIP on the basis of 13-year-old data.
After NFHS 3 in 2005-06, the field work for NFHS-4 is currently on. After data collection there is the laborious and time-consuming process of checking data quality , verifying data, cross checking and then analysis. The data is not expected before the end of this year and district level data from it might not be available till well into 2016. The first round of NFHS survey took place in 1992-93, the second round in 1998-99 and the third round in 2005-6, after which there have been none.
Data from the Rapid Survey on Children (RSOC) carried out by Unicef and the women and child development (WCD) ministry in 2013 is yet to be made available.The data was sent to the health ministry for review about six months back by the WCD ministry , but nothing has moved since.
Even the district level household and facility survey (DLHS) in 2013 did not provide any district-level nu tritional data. Even if, as RSOC national level data suggests, stunting levels among children has fallen from 48% to 39%, it is still very high and probably masks much higher levels of undernutrition at state and district level.
Over two decades, close to 300 Multiple Indicator Cluster Surveys (MICS) have been carried out in more than 100 countries with the support of Unicef for generating data on key indicators on the well-being of children and women, and helping shape policies. However, India withdrew from MICS in 2000 after two rounds. This year the MICS programme completes 20 years of operation and five rounds of surveys. Bangladesh, Pakistan and Nepal are part of the MICS surveys. “Standard gap for carrying out such surveys is three to five years to enable taking stock and to do mid-course correction,“ said a public health expert.
Products: Nutrition Index
The Times of India, December 15, 2016

Indian Food Cos Far Short Of Providing Nutritional Qualities To Fight Malnutrition
The largest food and beverage manufacturers in the country need to pull up their socks when it comes to offering nutritious products to consumers. Research by the Netherlands-based The Access to Nutrition Foundation (ATNF) has found that food and beverage companies in India are falling far short of what they need to do to help fight malnutrition.
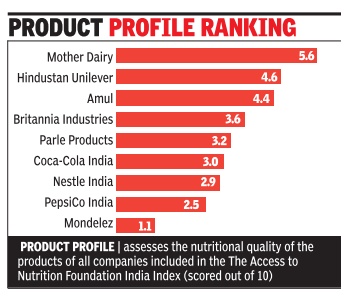
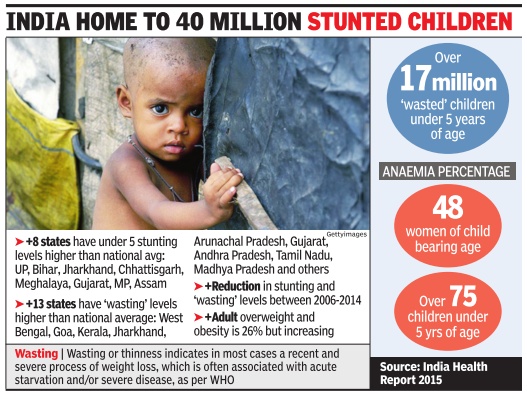
For instance, despite having the strongest nutrition and under nutrition-related commitments and policies, Nestle India, maker of Maggi noodles, scored the second lowest for nutrition qualities of its products among all the companies assessed under the India Access to Nutrition Spotlight Index. On the other hand, Mother Dairy scored the highest. “India faces the serious and escalating double burden of malnutrition, with a large undernourished population, as well as growing numbers of overweight and obese people who are developing chronic diseases,“ said Inge Kauer, executive director of ATNF. “Food and Beverage (F&B) manufacturers in India have the potential, and the responsibility, to be part of the solution to this double burden of malnutrition.“ Factor this: India is home to the largest number of stunted children in the world -48 million under the age of 5 -while at the same time, childhood obesity is reaching alarming proportions.The obesity prevalence rate reached 22% in children and adolescents aged between 519 years over the last five years, the report said.
Under the index, companies have been scored out of a maximum of ten in two ways -corporate profile and prod uct profile. While the former assesses companies' nutrition and undernutrition-related commitments and policies, practices and disclosure in seven areas of their business, the latter assesses the nutritional quality of the products of all companies included in the India Index.
The leading companies on the corporate profile -Nestle India and Hindustan Unilever -with scores of 7.1 and 6.7 respectively -have done more than the other seven companies assessed to integrate nutrition into their business models.
In the product profile segment, Mother Dairy , Hindustan Unilever and Amul, on the other hand, sell the largest proportion of healthy products among the Index companies. Mother Dairy scored 5.6 out of 10, Hindustan Unilever scored 4.6 and Amul scored 4.4.
2014: sources of dietary energy
Apr 25 2015
The diet of a particular group of people is influenced by various factors including income, prices, personal and cultural preferences and geography. This also leads to different sources of dietary energy given the diverse dietary habits in different countries or regions. In India, about 60% of the dietary energy comes from cereals.Meat products contribute only 0.8% of the total energy, which is among the lowest in the world. In most Western countries, in contrast, cereals provide less than 30% of energy while more than 10% comes from meat products SOURCE: Food and Agriculture Organisation of the United Nations Research: Atul Thakur ; Graphic: Asheeran Punjabi
Indians' poor food habits fuelling diabetes
The Times of India, Nov 06 2015

Malathy Iyer
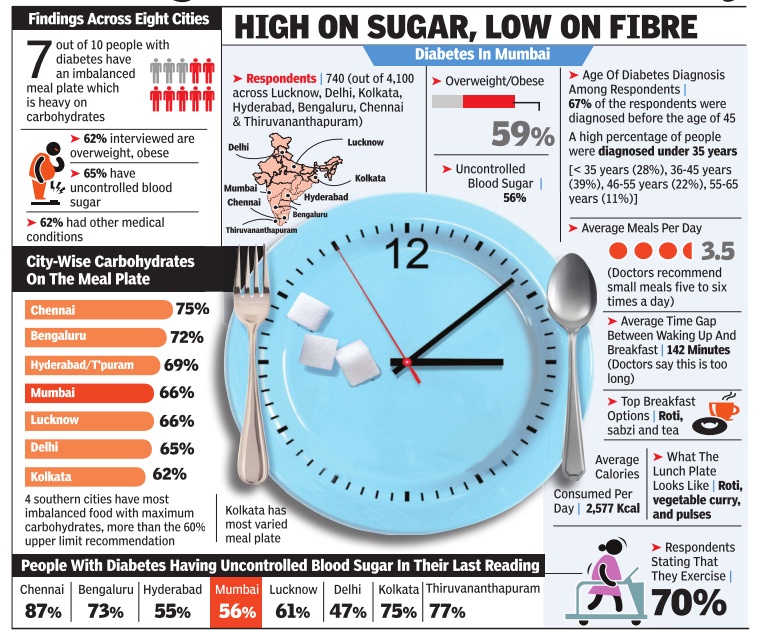
Indians' poor food habits fuelling diabetes, finds survey What Indians eat and how could be fuelling the dia betes epidemic across the coun try, suggests a new survey that interviewed 4,000 diabetic pa tients across eight cities. The main culprit could be the Indian craving for rice, fine flour rotis or upma -all carbo hydrate-based foodstuff high on calories but low on muchneeded fibre. “Rice accounts for 48% of the daily calorific intake of most Indians, said endocrinologist Dr V Mohan from Chennai.
Considering that most types of white rice rapidly increase the blood sugar levels, caution is advised.
But urban Indians who suffers from diabetes seem far from cautious. The new survey , titled Food, Spikes and Diabetes Survey, showed seven out o f 10 people with diabetes in urban India paid little attention to what and how much they eat.Carbohydrates are supposed to comprise only 60% of the plate, but 70% of those surveyed in Mumbai and 84% of those in Chennai consumed more.
There is also a problem with how Indians eat. “Indians tend to eat so fast that the pancreas struggle to produce adequate insulin for metabolising the food, said Dr Shashank Joshi, president of the Indian Academy of Diabetes.
Indian diabetic patients also fail to observe healthy gaps between meals, said Dr Joshi.
2006- 2014: Child malnutrition declines, but still very high

The Times of India, Dec 11 2015
Malnutrition down, but not enough
Child malnutrition in India has declined but continues to be among the highest in the world. Between 2006 and 2014, stunting levels in children under five declined from 48% to 39% as compared to global level of 24%, the India Nutrition Report says. Being stunted means that the affected children are not fulfilling their potential either in childhood or as adults and their brain and immune systems are compromised, often for their entire life, the reports says. However, there has been an increase in the decline rate of stunting at the national level. “Though India's national rate of stunting decline has increased from 1.7% in 200506, to now 2.6%, it is not fast enough,“ said Lawrence Habbad, senior researcher from International Food Policy Research Institute. A global report assessing India's performance vis-à-vis 193 countries concluded that India was on track to meet only two of the eight global targets on nutrition though it had significantly improved its performance in the past 10 years.
The India Nutrition report and the Global Nutrition Report was released by Union ministers J P Nadda and Maneka Gandhi on Thursday .
Nadda urged for suggestions to accelerate action at state level and strengthening and accountability for impact of nutrition programmes.
In order to strengthen the ICDS programme, women and child development ministry has been undertaking capacity building measures for Anganwadi workers equipping them with tablet devices and giving them promotional abilities, Gandhi said.


