China vis-à-vis India: Levels of development
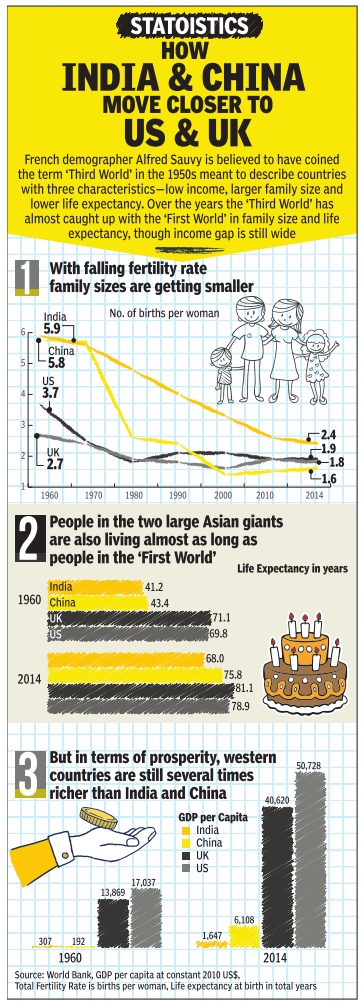
(→Fertility rate, life expectancy, GDP, 1960-2014) |
(→GDP per capita, 1978-2015) |
||
| Line 19: | Line 19: | ||
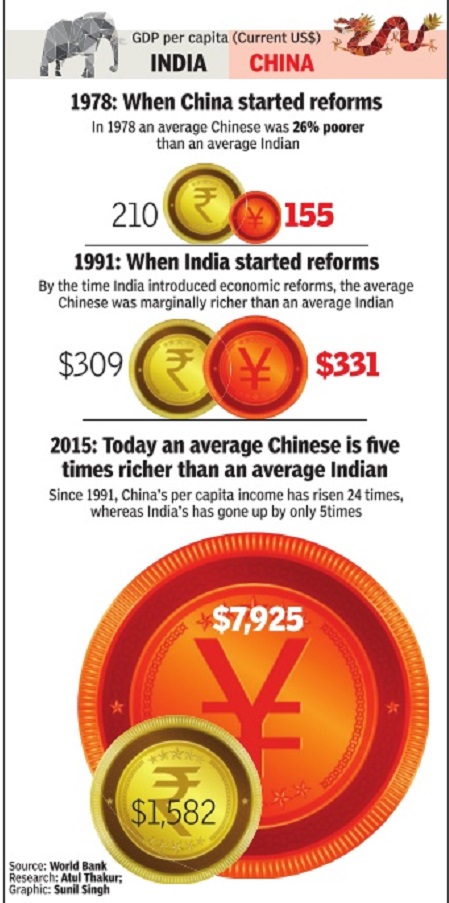
==GDP per capita, 1978-2015== | ==GDP per capita, 1978-2015== | ||
| − | See graphic. | + | See graphic. |
| + | |||
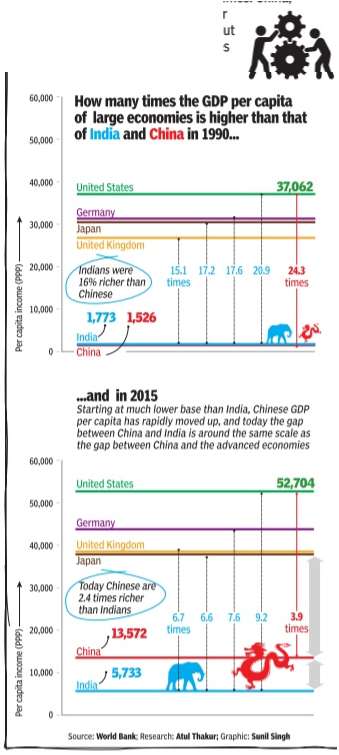
| + | ==GDP per capita, 1990-2015== | ||
| + | See graphic. | ||
| + | |||
| + | [[File: GDP per capita income, China versus India, 1990-2015.jpg|GDP per capita income, China versus India, 1990-2015; [http://epaperbeta.timesofindia.com/Article.aspx?eid=31808&articlexml=STATOISTICS-HOW-CHINA-MOVED-FROM-BEING-POORER-THAN-26052017012014 The Times of India], May 26, 2017|frame|500px]] | ||
=Corporations= | =Corporations= | ||
Revision as of 20:47, 28 June 2017

China's economic reforms have worked much better than India's. That's perhaps because before starting its reforms China ensured three things: land reforms, better access to education and slower population growth
The Times of India Oct 29 2016
This is a collection of articles archived for the excellence of their content. |
Contents |
Developmental indicators
Fertility rate, life expectancy, GDP, 1960-2014
See graphic.

i) fertility rate and family size,
ii) life expectancy, and iii) GDP per capita,
in 1960 and 2014., The Times of India, April 4, 2017
GDP per capita, 1978-2015
See graphic.
GDP per capita, 1990-2015
See graphic.

Corporations
Top 200 companies: China, India
The Times of India, Aug 03 2016
Top 200 Indian cos set to beat Chinese peers
According to a report by S&P Global Ratings. “Our analysis of India's top 200 companies by market capitalisation against their Chinese counterparts shows that government influence is far greater for listed companies in China than in India,“ said S&P Global Ratings credit analyst MehulSukkawala.
“This directly affects companies' flexibility to reduce capital spending, generally results in weaker profitability, and eventually shows up in higher leverage,“Sukkawal said. The difference in the size of the private sectors in India and China is significant. Private entities account for about 75% of net debt and EBITDA (earnings before interest, taxes, depreciation, and amortisation) of the top 200 Indian companies, compared with less than 20% for the top Chinese companies.
Indian private companies outperform both the Indian government-related entities (GREs) and Chinese companies by registering the highest (and relatively stable) returns. Leverage has peaked for Indian companies overall but continues to increase for Chinese GREs. At the same time, India faces the risk of debt concentration.
About 15% of the companies in the sample account for 60% of net debt. India also suffers from a high interest rate environment when compared with other emerging Asian economies.
This reduces the debt servicing ability of leveraged companies in India and can result in financial stress. On revenue growth, S&P expects the performance for India's top companies to improve over the next two to three years, even though revenue growth for companies in both India and China has been trending down.
A better operating environment with increasing government spending and a likely improvement in the domestic economy will support growth. But much of the improvement in operating conditions in India could depend on its infrastructure, which remains inadequate.
Poor infrastructure is among the biggest hurdles facing the Indian government's ambitious “Make in India“ programme that aims to turn the country into a top global manufacturing destination, opined S&P .