Exports, imports (international trade): India
This is a collection of articles archived for the excellence of their content. |
Contents |
Benefits of exports
Benefits to states
January 30, 2018: The Times of India
See graphic:
1. States that export more internationally, and trade more with other states, tend to be richer
2. Top 1% of Indian firms account for 38% of exports-in other countries, they account for a substatially greater share
3. The relief from embedded state taxes (ROSL) announced in 2016 boosted exports of ready-made garments (but not others) by about 16%
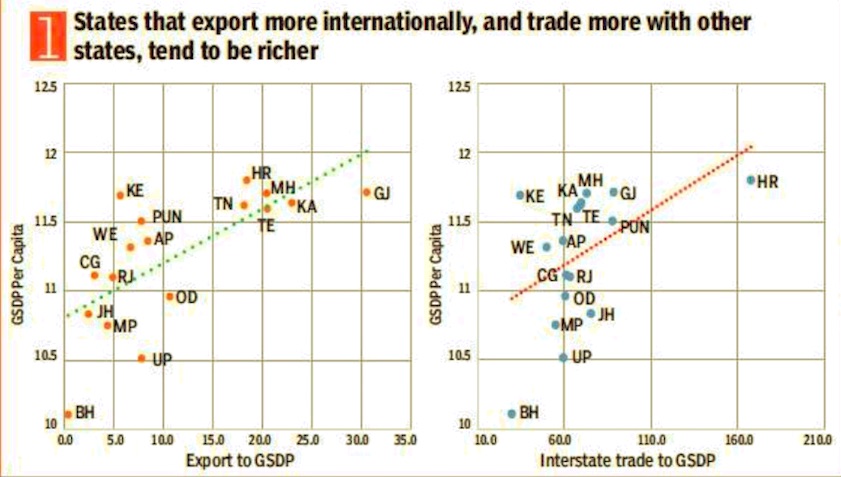
From: January 30, 2018: The Times of India
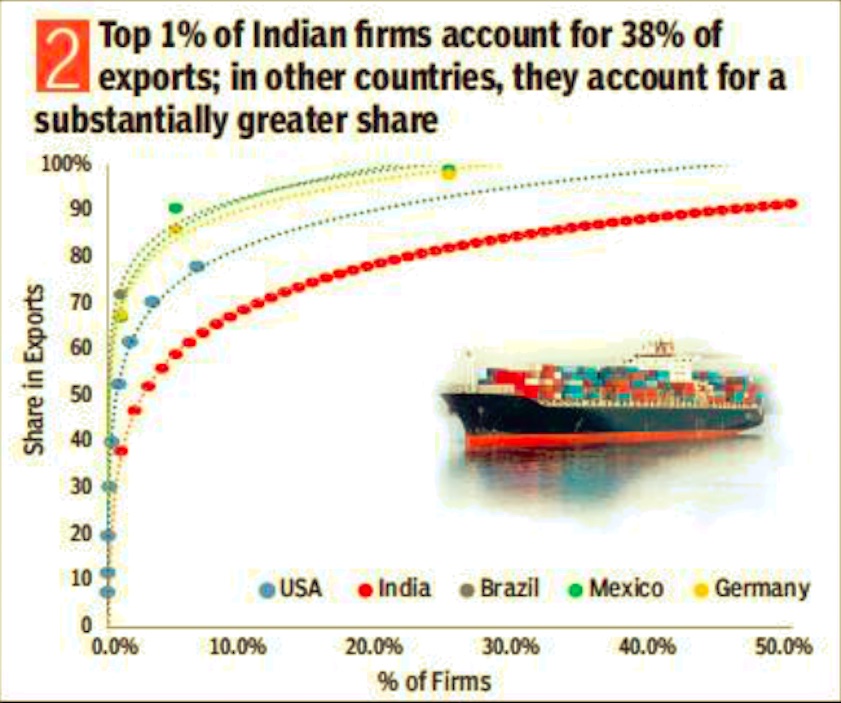
From: January 30, 2018: The Times of India
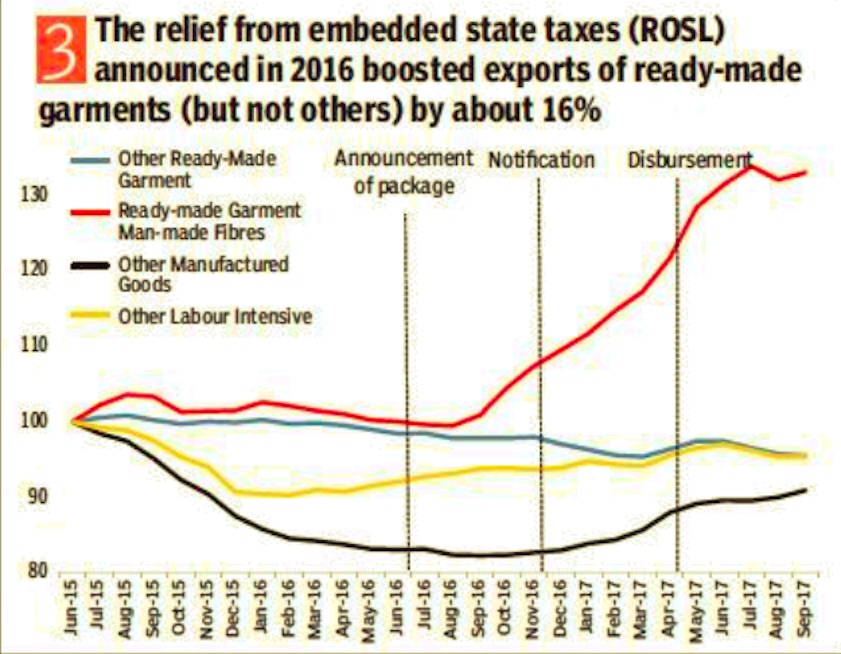
From: January 30, 2018: The Times of India
Global trade is seen as a crucial element in the strategy to propel growth, given its link to the overall development. The Economic Survey cites the experience of garments where incentives helped push shipments
Exports from India
1991-2015, the Top 5

See graphic:
Top 5 exports from India, 1991-2015
Petroleum products, 2005-15

See graphic:
India’s export of petroleum products, 2005-15
2005-15: The main sectors that exported goods/ services
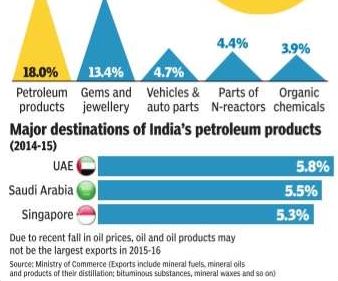
See graphic:
The sectors that contributed to Indian exports in 2005-15
2013-19

India’s imports and trade deficit: 2017-19
From: April 16, 2019: The Times of India
See graphic:
India’s exports: 2013-19
India’s imports and trade deficit: 2017-19
2014> 2019: exports
Exports in 2018-19 set to finally scale 2013-14 level, March 16, 2019: The Times of India
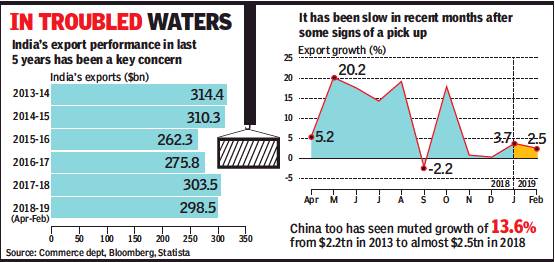
From: Exports in 2018-19 set to finally scale 2013-14 level, March 16, 2019: The Times of India
Officials Blame Global Slowdown For Recent Sluggishness
Exports appear on course to finally cross the 2013-14 level during the current financial year despite the sluggishness seen in recent months.
Data released by the commerce department showed that exports inched up by 2.5% to $26.7 billion in February as several key sectors, such as engineering goods, chemicals, rice and cotton yarn and fabrics reported tepid growth, while oil product exports fell by 7.7%. And, with gold, electronics and crude imports shrinking in February, the overall import bill fell by over 5.4% to $36.3 billion, narrowing the trade deficit to $9.6 billion, compared to $12.3 billion in February last year. In fact, during February, 12 of the 30 closely watched segments showed a decline in the value of shipments.
During April-February, India’s exports are estimated to be 8.8% higher at $298.5 billion, while imports are up a shade under 10% at $464 billion.
Policymakers and trade experts are keeping close tabs on the export numbers, as the Modi government has so far fallen short of scaling the level of exports that it had inherited. Government officials blame it on the global export slowdown as well as growing protectionism across the world, especially in the US, which had been an advocate of free trade.
With March expected to see a year-end rush of shipments, the Modi administration expects to close the year with exports of around $330 billion, helping it scale the record $314 billion reached during UPA’s last year in office.
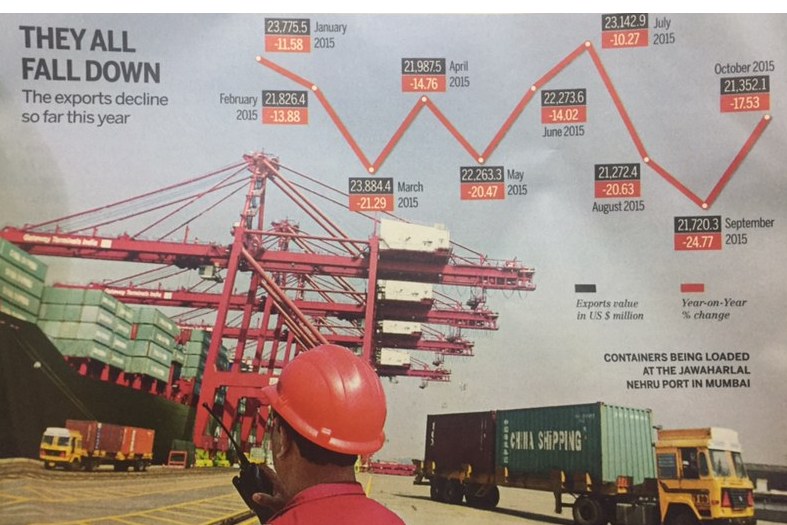
2015: exports decline
See graphic:
Exports value in US $ million; Year-on-year % change, 2015
2018: 9% increase
Exports rise 9% to touch record $331bn, April 16, 2019: The Times of India
Exports rose 9% to touch a record high of $331billion during 2018-19 as sectors such as petroleum and electronics drove the growth. But with imports too rising at nearly the same pace, the trade deficit widened to $176 billion, compared with $162 billion a year ago.
It was, however, the export numbers that were being cited as a major achievement in the wake of a global trade slowdown that has been attributed to protectionist policies, especially in the United States.
It will also come as a shot in the arm for policymakers as the NDA government’s track record on the export front had been poor. In fact, in the first two years, it had seen a contraction. A pickup in exports is seen to be crucial to revive the manufacturing sector, where growth has slowed down in recent months.
Export of creative goods and services
2012-13
The Times of India, September 25, 2015
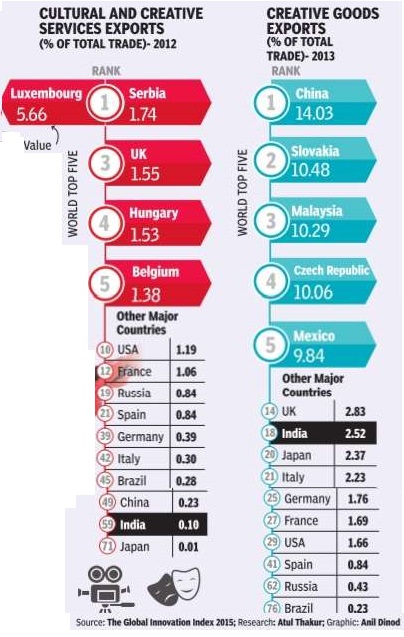
India's soft power through the export of entertainment movies, music, television sitcoms and cricket -is indisputable. Data on the export of creative goods and services as a proportion of total exports, however, suggests it is a bit overrated. According to the recently released global innovation index, India was 59th in the world in the export of cultural and creative services (audio visual and other recreational services). In exports of creative goods (merchandise, processing and repairs of goods categorised as creative), India is ranked 18th.Interestingly, China is ranked above India in both these categories.
Garments
Second-hand clothes: import, export of
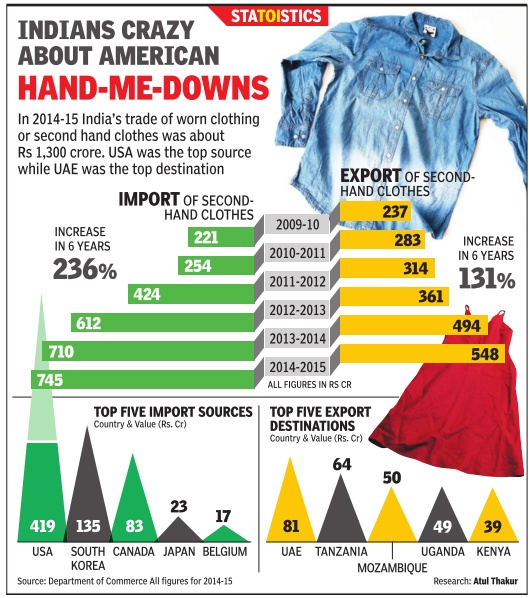
See graphic:
2014-15: The import and export of second-hand clothes
Imports into India
1991-2015, the Top 5
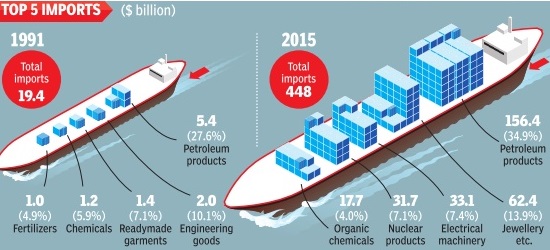
See graphic, ' Top 5 imports into India, 1991-2015 '
2011-18: the three main imports
October 9, 2018: The Times of India
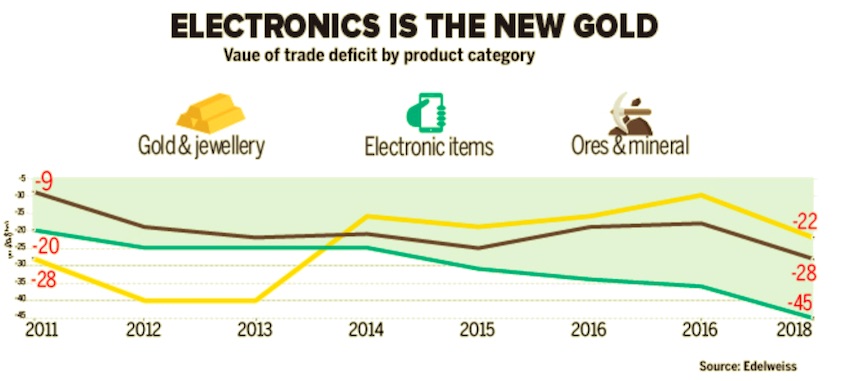
From: October 9, 2018: The Times of India
See graphic:
2011-18: India’s three main imports
One of the triggers for the rupee’s weakness — both in 2013 and 2018 — has been the rising current account deficit (CAD). Imports of gold, which was one of the main reasons of the currency’s depreciation in 2013, have almost halved in five years. But electronic imports are the new gold, with the net deficit in electronics trade nearly doubling to $45 billion in 2018 from $25 billion in 2013.
Perception of quality of Indian products
2018: Countries in which goods made in India are perceived positively, and negatively
March 22, 2018: The Times of India

From: March 22, 2018: The Times of India
HIGHLIGHTS
Are 'Made in India' products making the kind of wave across the globe that the Narendra Modi-government had envisaged? TOI brings to you data that shows which parts of the world think our products are 'slightly or very positive'
The Narendra Modi-government's flagship 'Make in India' project launched in 2014, has, so far, received mixed responses. While few doubt the government's intent behind pushing the manufacturing sector's agenda, experts have raised concerns on the implementation of the project.
A data set by Statista.com -- a statistics, market research and business intelligence portal-- shows that products manufactured under the 'Make in India' initiative are particularly valued in the middle-east. Respondents from United Arab Emirates (UAE), Bahrain and Saudi Arabia top the chart in opining that products made in India are 'slightly or very positive.'
38 per cent of Chinese and a quarter of respondents from the US and UK also believe the same.
The ranking displays the results of the worldwide Made-In-Country Index 2017, a survey conducted to show how positively products "made in..." are perceived in various countries all over the world. 43,034 respondents answered the question "On a lot of products you can find a label stating where the product was made. How do you feel about products labeled with…?" on a 5-level scale. The sample represents 90 per cent of the global population, according to Statista.
"Never was the volume of international goods transport higher than during this decade. Today, the meaning of the "made in" label is more important than ever," the research firm said. In the Economic Survey for the financial year 2017-18 released earlier this year, the government earmarked 10 sectors, including capital goods, auto, defence, pharma and renewable energy to push growth in manufacturing and generate job opportunities.
The other sectors are biotechnology, chemicals, electronic system design and manufacturing, leather, textiles, food processing, gems & jewellery, construction, shipping and railways.
Christening the initiative as 'Make in India 2.0', government identified these sectors as the ones which have potential to become global champions and drive double-digit growth in manufacturing.
State-wise performance
2017

From: March 2, 2018: The Times of India

From: March 2, 2018: The Times of India
See graphics:
The share of India’s Top 8 exporting states in India’s exports, 2017- I
The share of India’s 9th-15th (rank-wise) exporting states in India’s exports, 2017- II
Trade deficit
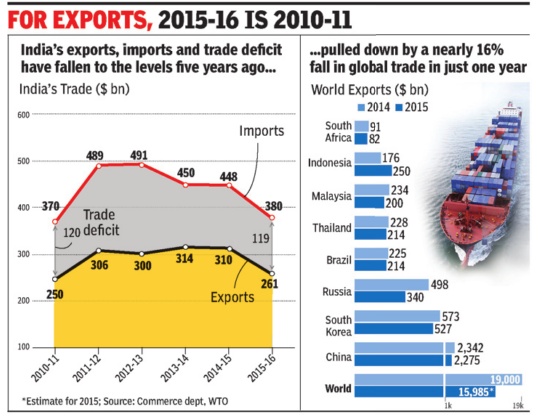
2005-16
See graphic 'India's exports, imports and trade deficit levels in 2015-16...'
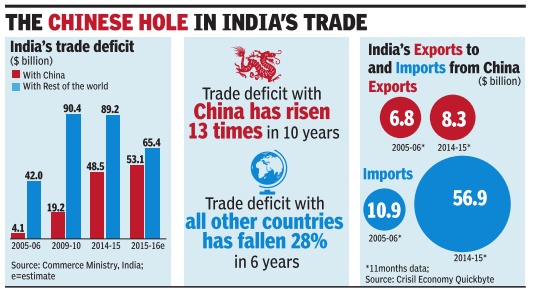
2013-16
The Times of India, May 10 2016
India has trade deficit with 27 countries
India has a trade deficit with as many as 27 major countries, in cluding China, Australia, Iraq and Iran, during the last three years. With these countries, India has trade deficit continuously during the last three years, commerce and industry minister Nirmala Sitharaman said in a written reply to the Lok Sabha.
She said India generally runs a deficit with those countries from which highdemand commodities are sourced. These include items like crude oil, gold, diamond and fertiliser.
In 2015-16, India's trade deficit fell 14% to $118.4 billion. Other countries with which India has a trade gap include Indonesia, Korea, Germany , Canada, Taiwan, Russia and Ukraine.
In a separate reply , she said India's exports have been adversely affected by recessionary trends across the globe, including in the EU and the US. India's agriculture exports during April-February 2016 worked out at $18.8 billion as against $18.7 billion in 2014-15, the minister said.
2014-17
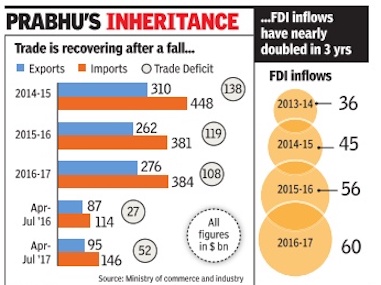
ii) FDI inflows, 2013-17
From The Times of India, September 4, 2017
See graphic, ' India’s external trade, 2014-17'
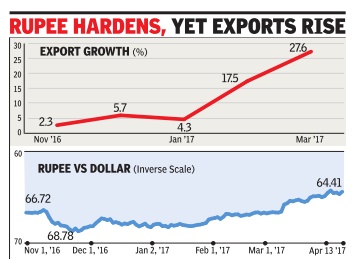
Nov 2016-April 2017
See graphic:
Nov 2016-April 2017: Indian exports rise despite the rupee appreciating in value
2017-18: Exports expand 9.8%, fastest in six years
Exports expand 9.8% in FY18, fastest in six years, April 14, 2018: The Times of India
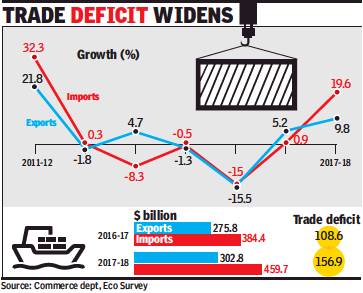
From: Exports expand 9.8% in FY18, fastest in six years, April 14, 2018: The Times of India
India’s exports rose 9.8% during 2017-18, the highest growth rate in six years, while imports went up nearly 20% as commodity prices pushed up the value of shipments in and out of the country along with a pick-up in global trade.
But, exports dipped 0.7% in March to $29.1 billion, led by a decline in shipments of gems and jewellery and petroleum products from the country, latest data released by the commerce department on Friday showed. This was the first decline in four months as oil exports dropped 13%, while gems and jewellery exports fell nearly 17%. During March, import growth too slowed down, rising 7% to $42.8 billion, leaving a trade deficit of $13.7 billion.
In 2017-18, trade deficit was estimated to have widened to $157 billion, compared to $109 billion in 2016-17. “With the expansion in imports nearly twice as high as export growth in FY2018, the merchandise trade deficit widened by 44% in the just-concluded fiscal. ICRA expects the current account deficit to more than triple to $47-50 billion (around 1.9% of GDP) in FY2018 from $15 billion in FY2017,” said Aditi Nayar, principal economist at the ratings agency. While exporters’ lobby group Fieo said that the overall number was positive, it warned about the adverse impact of protectionism and geo-political uncertainty.
2018: August
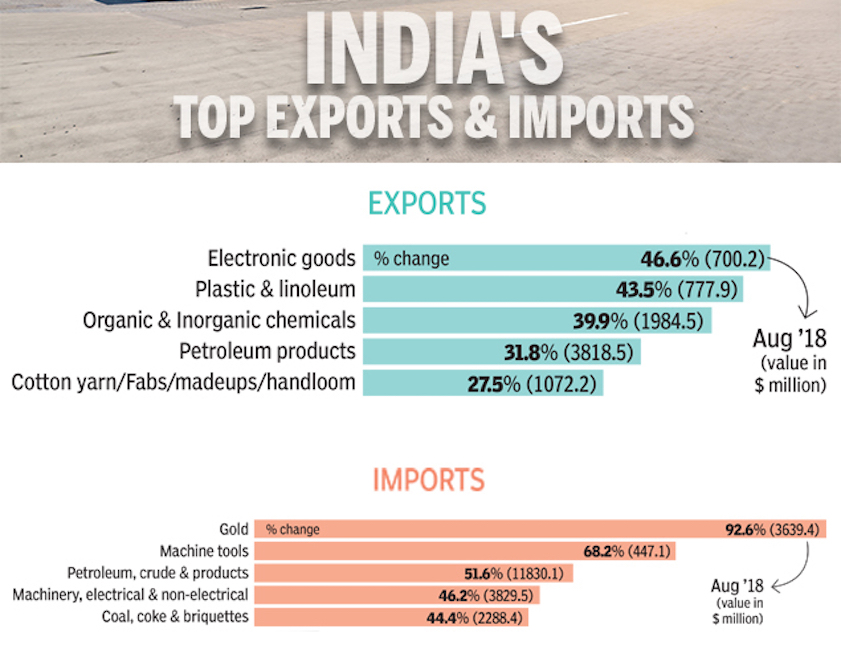
From: September 17, 2018: The Times of India
See graphic:
India's top exports and imports- August 2018
Sep: exports dip 2% despite ₹ depreciation/ Imports up
Exports dip 2% despite sharp Re depreciation, October 16, 2018: The Times of India
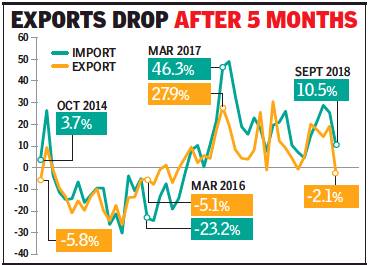
2018, Sep: exports dipped 2% despite ₹ depreciation; imports rose
From: Exports dip 2% despite sharp Re depreciation, October 16, 2018: The Times of India
India’s exports declined over 2% in September, despite a steep depreciation of the rupee, but the government dismissed it as a blip and blamed high base for the first fall in value of shipments in five months.
A late evening statement showed a decline across sectors — from gems and jewellery (down 22%) to readymade garments (-33.6%). On the other hand, gainers included oil products (26.8%) due to higher global prices, along with plastics and linoleum (28%) and chemicals (17%).
Typically, exports become more attractive due to a weakening currency. The rupee has depreciated over 15% since January, making it the worst performing Asian currency so far this year. But, exporters said they have gained little so far since the orders were booked before rupee’s free fall began. Besides, buyers are now demanding lower prices citing a weaker rupee.
In September 2018, exports were estimated at close to $28 billion, compared to $28.6 billion a year ago. Imports, however, rose 10.4% to $41.9 billion, resulting in a trade deficit of nearly $14 billion. Oil imports surged 33.6% to $10.9 billion, while gold shipments were 51% higher at $2.6 billion, mounting pressure on trade deficit.
Trade-GDP ratio
Vulnerable India's trade-GDP ratio higher than US, China's
The Times of India, Aug 30 2015
Atul Thakur
India's trade-GDP ratio higher than US, China's Country
More vulnerable to global crises
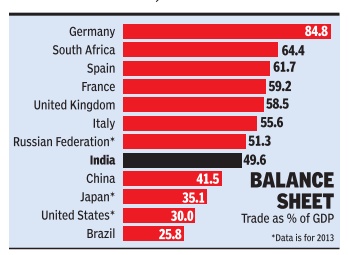
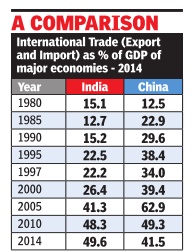
Historically, India has been viewed as being far less vulnerable to global financial crises than other large economies because it was much less integrated with the global economy than countries like, say , the US or China. Today , however, at least as far as trade goes, the opposite is true. World Bank data shows that in 2014 India's total trade (exports plus imports) was equivalent to about 50% of its GDP. This was higher than the trade to GDP ratio of the US, Japan or China. Dur ing the 1997 Asian financial crisis, which India escaped relatively unscathed, total foreign trade was equivalent to only 22.2% of the country's GDP.
One way to measure the extent to which an economy is globally linked is by comparing its international trade with its GDP. By this yardstick, India's aggregate exports and imports of goods and services was 49.6% of the country's GDP in 2014, compared to China's trade to GDP ratio of 41.5% for the same year. In 2013, the year till when Bank data is available for the US and Japan, international trade was about 30% of GDP for America and 35.5% for the Japanese economy . Of course, the US, China and Japan are far larger economies than India at the nominal exchange rate and hence a lower trade ratio doesn't mean their trade volumes are lower than India's.
The data shows that among major economies, countries of Western Europe have the highest degree of integration with the global economy . For instance, the ratio was 84.8% for Germany , Europe's largest economy . For the UK, Italy , Spain and France, trade was about 60% of GDP .
Three decades ago, in 1984, China and India had a similar degree of globalization with the trade to GDP ratio 16.6% for China and 13.8% for India. The Chinese economy experienced exponential growth thereafter and it was reflected in the growth of its international trade as well.The trade to GDP ratio steadily increased to a peak of 64.8% in 2006. Since then it has been decreasing as China's domestic market has expanded with increased per capita incomes.
India, on the other hand, continues to be in a phase where its global trade expands at a faster pace than its economy , resulting in a steadily climbing trade to GDP ratio.
Trade, merchandise
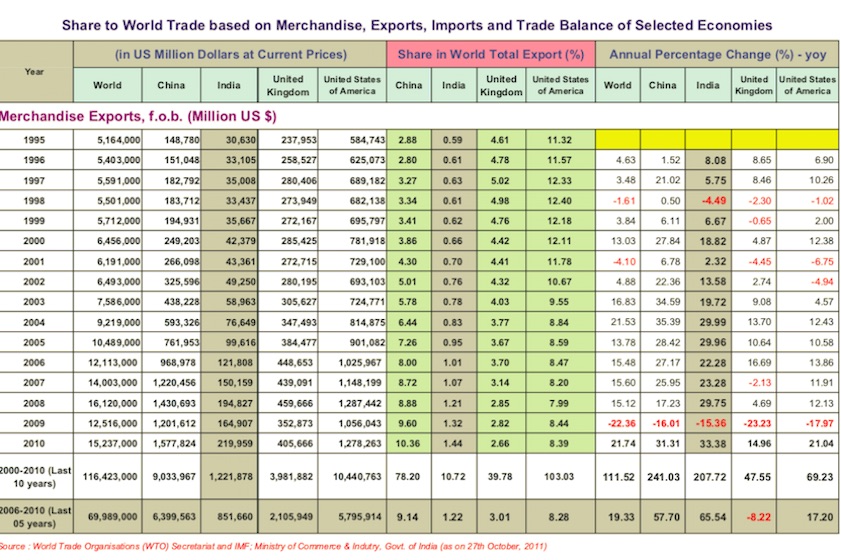
From: December 22, 2014: The Planning Commission
From: December 22, 2014: The Planning Commission
See graphics:
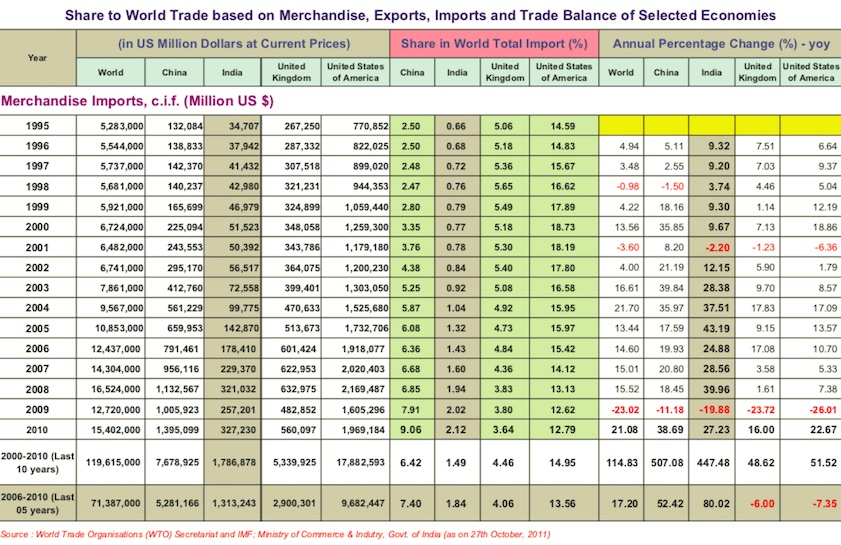
1. Share to World Trade based on Merchandise, Exports, Imports & Trade Balance of Selected Economies - (1995-2010)- MERCHANDISE EXPORTS
2. Share to World Trade based on Merchandise, Exports, Imports & Trade Balance of Selected Economies - (1995-2010)- MERCHANDISE IMPORTS
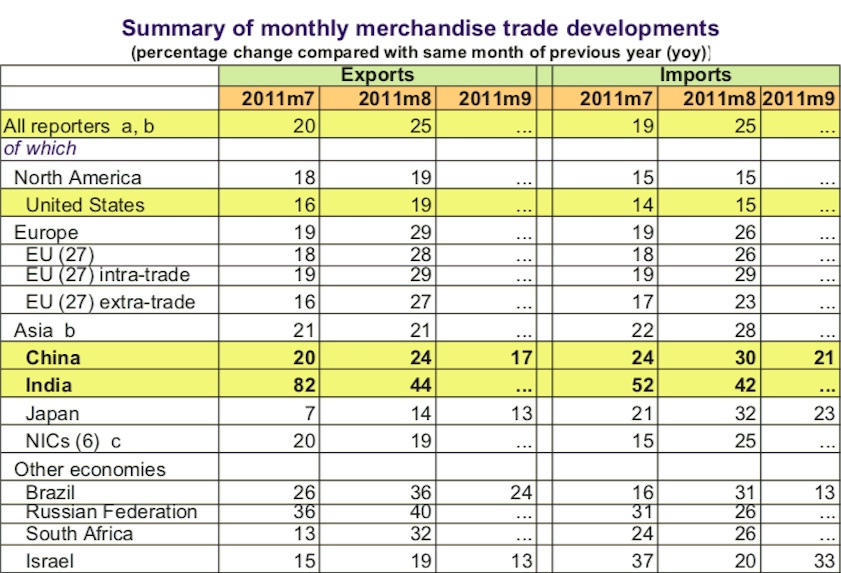
Summary of monthly merchandise trade developments
From: December 22, 2014: The Planning Commission
From: December 22, 2014: The Planning Commission
From: December 22, 2014: The Planning Commission
From: December 22, 2014: The Planning Commission
See graphics:
1. Summary of monthly merchandise trade developments- (percentage change compared with same month of previous year (yoy))
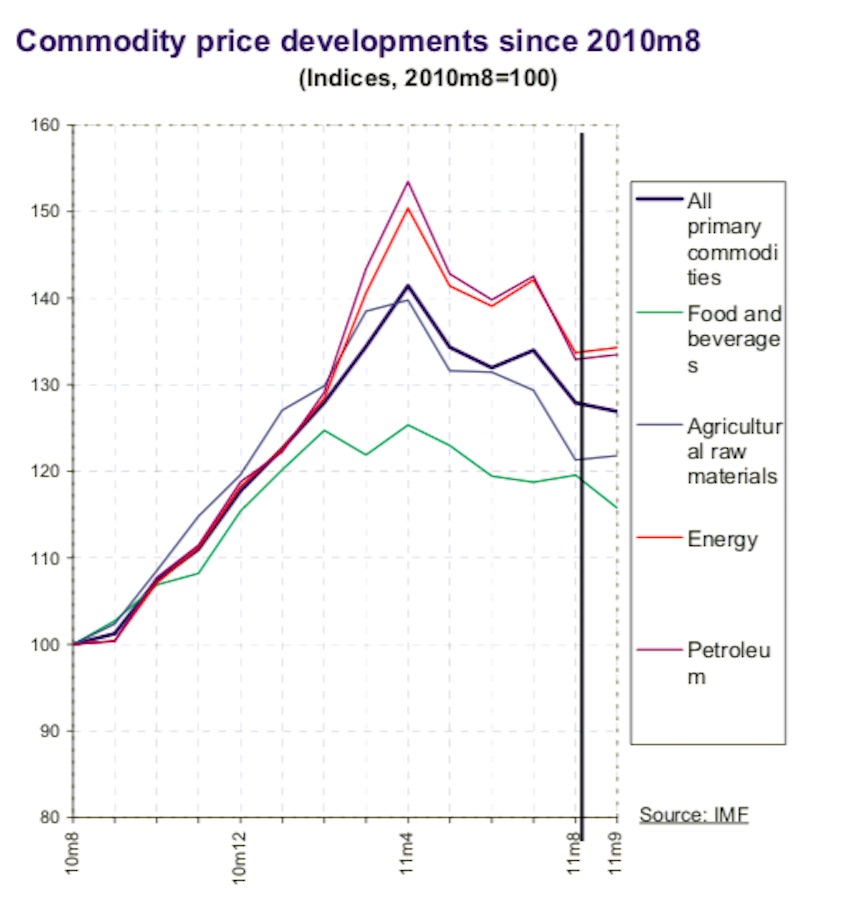
2. Commodity price developments since 2010m8
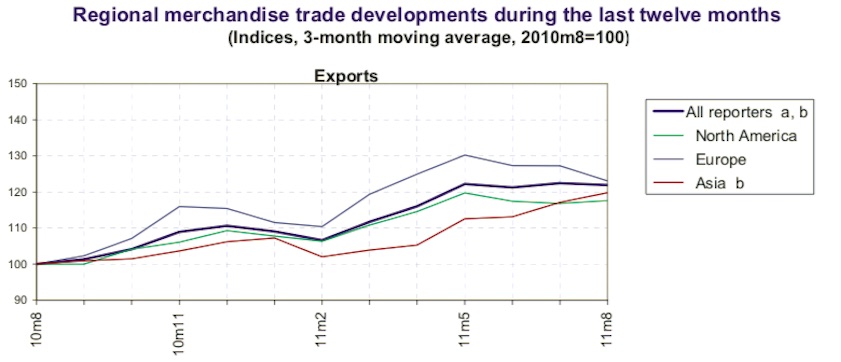
3. Regional merchandise trade developments during the last twelve months- (Indices, 3-month moving average, 2010m8=100)- EXPORTS
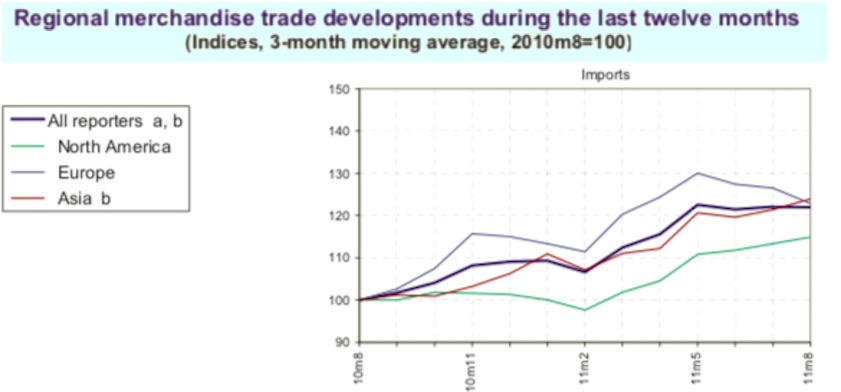
4. Regional merchandise trade developments during the last twelve months- (Indices, 3-month moving average, 2010m8=100)- IMPORTS
Trading partners, India’s main
2017-18
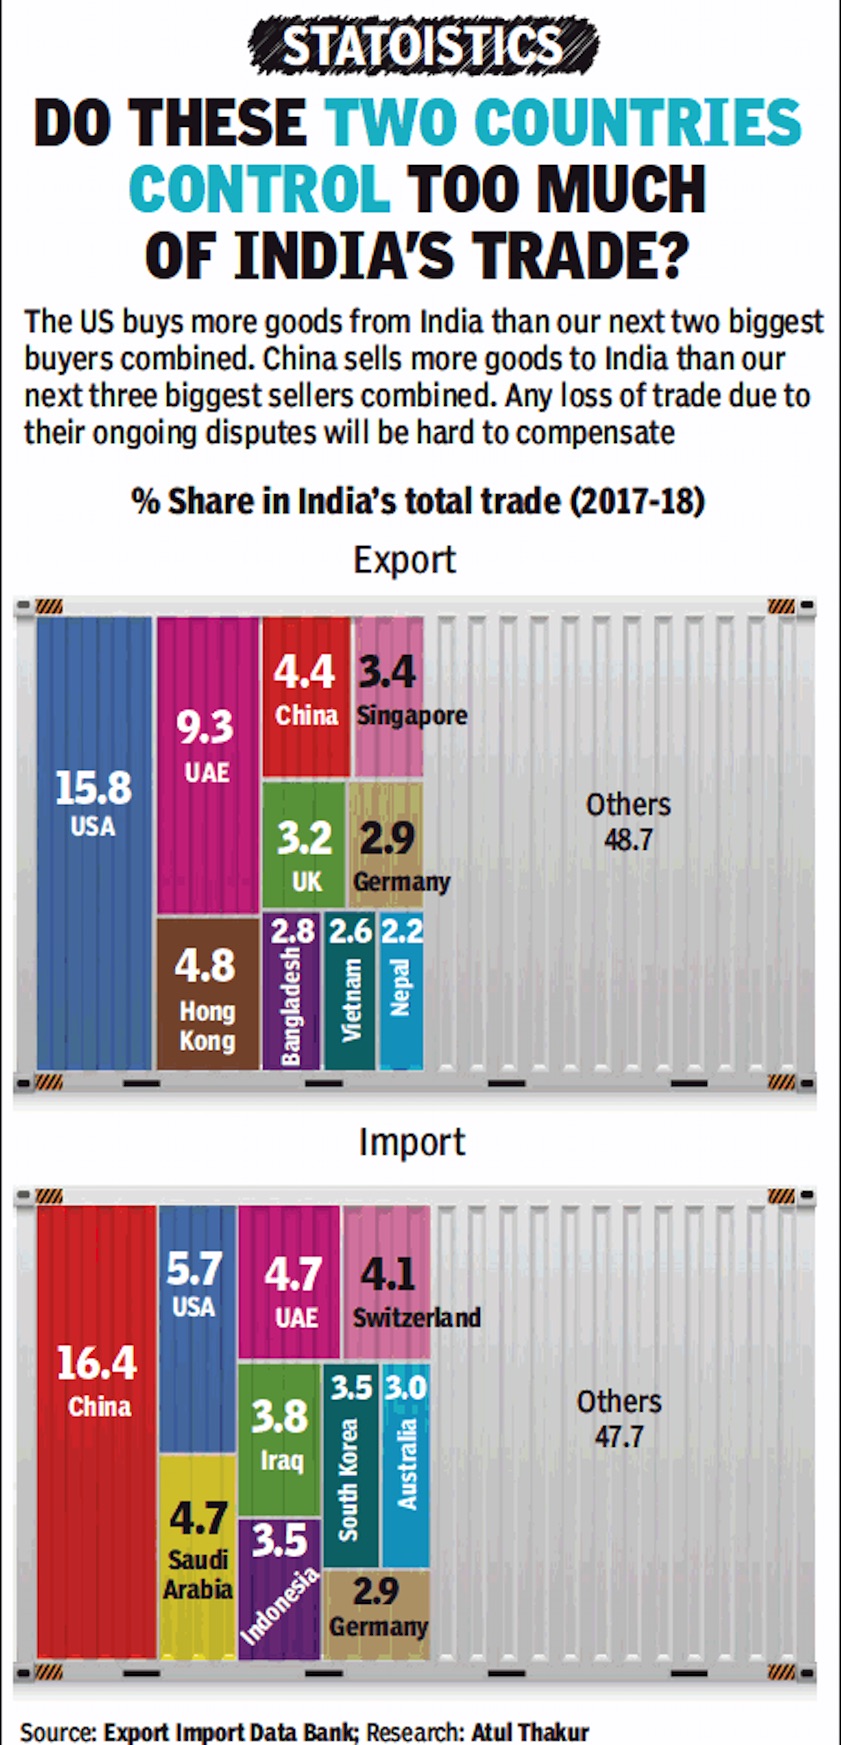
ii) The main countries from which India imported their goods,
in 2017-18.
From: July 5, 2018: The Times of India
See graphic:
i) The main countries to which India exported its goods, and
ii) The main countries from which India imported their goods
See also
Commerce: Indian government data
Exports, imports (international trade): India
