Petroleum, diesel, kerosene, India: I
This is a collection of articles archived for the excellence of their content. Readers will be able to edit existing articles and post new articles directly |
Statistics, graphics

Graphic courtesy:The Times of India, March 23, 2016

Statistics, graphics
Consumption in India...
Consumption of Diesel
2012-13

Graphic courtesy: The Times of India,December 16, 2016
Over 13% diesel consumed by high-end cars, SUVs in India, study says
PTI | Jan 28, 2014
Over 13 per cent of subsidized diesel in the country is consumed by high-end cars and SUVs, says a study commissioned by the oil ministry, showing that cheaper fuel is finding usage by unintended beneficiaries.
A study conducted by Nielsen for the ministry's Petroleum Planning and Analysis Cell (PPAC) found that private cars consumed 13.15 per cent of the 69.08 million tonne diesel consumed in the country in 2012-13.
Commercial vehicles used another 8.94 per cent and three-wheelers, a further 6.39 per cent.
Commercial vehicles such as trucks however constituted the largest user base of diesel at 28.25 per cent, the study said, adding that 70 per cent of the diesel was being used in the transport sector.
Agriculture tractors and pumps used 13 per cent of the diesel.
Industries and electricity generators consumed almost 9 per cent diesel, while mobile towers used 1.54 per cent.
The study found that 99.6 per cent of petrol is consumed in the transport sector alone.
"Of this, majority consumption of 61.42 per cent is accounted for by two-wheelers while cars use 34.33 per cent, followed by 3-wheelers at 2.34 per cent," an official statement said.
It was also revealed that in Odisha, Bihar and Rajasthan, petrol consumption by two-wheelers exceeds 70 per cent.
The consumption by three-wheelers is very low in states like Delhi, Haryana, Gujarat and Odisha, where consumers have shifted to CNG or diesel.
"While pricing of petrol was deregulated, diesel prices are still being regulated, with subsidy running at Rs 8.47 per litre currently," the statement said.
The total subsidy on diesel during 2012-13 was Rs 92,061 crore, constituting 57.2 per cent of the total fuel subsidy.
"The question as to where the Diesel is getting consumed is very relevant in this context," it said.
The statement added: "Based on sector-wise consumption pattern of diesel, it would mean that of the total under- recovery of Rs 92,061 crore on account of diesel during 2012- 13, about Rs 12,100 crore went to owners of private cars and utility vehicles, about Rs 8,200 crore to commercial cars and SUVs, about Rs 26,000 crore to trucks, about Rs 8,800 crore to buses, about Rs 12,000 crore to agriculture sector and about Rs 15,600 crore to other sectors."
Consumption of oil, natural gas
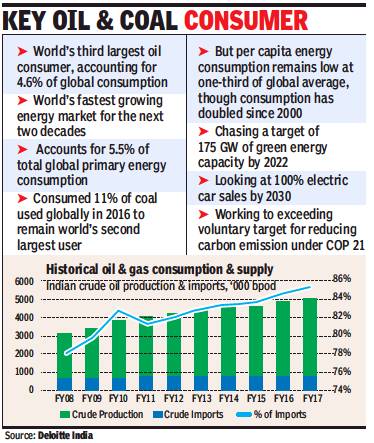
2008-17
Sanjay Dutta, Energy meet cements India’s pole position, April 6, 2018: The Times of India
From: Sanjay Dutta, Energy meet cements India’s pole position, April 6, 2018: The Times of India
Summit Of 72-Member Group Starts Next Week
India is hosting the 16th ministerial round of International Energy Forum, a grouping of 72 member countries accounting for almost 90% of global supply and demand for oil and gas, in yet another proof of New Delhi’s pole position in the world energy market. The meet will kick off next week.
This will be the second time in less than a month after the International Solar Alliance summit in March when policymakers and corporate leaders from around the world will congregate in India’s capital for a platform for discussing future challenges and changes in the energy sector.
On the surface, ISA and IEF appear contradictory. But scratch and you will find they have a lot in common. ISA is about developing a global ecosystem for promoting solar power. This is as much about supplying affordable power to improve people’s lives as it is about mitigating climate change. Similarly, IEF’s meet will also look for a balance in the oil and gas industry – ensuring affordability, stability and sustainability of supplies while moving towards a low-emission future.
IEF allows India an opportunity to leverage its position as world’s fastestgrowing energy market and to cement its role as moderator between producer and consumer countries.
2019-21

From: August 11, 2021: The Times of India
See graphic:
Consumption of Petroleum, diesel, kerosene, LPG, naphtha, aviation fuel etc in India: 2019-21
Economy: India's oil economy
Imports: domestic production ratio

HOW DEAL WITH RUSSIA WILL CHANGE INDIA'S OIL ECONOMY Oct 18 2016 : The Times of India
HOW DEAL WITH RUSSIA WILL CHANGE INDIA'S OIL ECONOMY Oct 18 2016 : The Times of India
Till the early 1990s, India used to produce over 70% of the oil it consumed. Now the share of domestic production is nearing 20%. Not only have imports surged, most of the oil is imported from only one region.The deal with Russia will make India's import basket more diversfied, a key requirement for oil security
See graphic
India's oil economy, Imports: domestic production ratio and sources, 2016
2018: ‘Oil has lower impact on economy than believed’
May 22, 2018: The Times of India
Oil is now thought to be less of an independent driver of economic cycles than was previously believed, according to a report by SBI. The study estimates that $10 per barrel increase in oil price will increase the import bill by around $8 billion and decrease gross domestic product (GDP) by 16 basis points (1 percentage point = 100 basis points, or bps).
According to the report by SBI chief economic adviser Soumya Kanti Ghosh, diffusion of technology, user of alternative sources of energy and more importantly, abundance of skilled labour resulting in muted increase in real wages are keeping inflation in check. Ghosh points out that use of alternative source of energy has increased 1.4 times in the last four years in India.
In FY18, the oil import bill rose by $22 billion with crude oil prices rising from $53 to $70. “The current average oil price for FY19 is $73.6 per barrel. Considering the price of oil increases to $90 by March 2019, the average oil price for FY19 will be nearly $84. The worst case scenario is where we assume oil price to hit $90 in June 2018 and reaches $100 by March 2019,” said Ghosh.
He adds that such a scenario will reduce the GDP by 31 bps, increase inflation by 58 bps and the fiscal deficit by 40 bps, assuming a Rs-3 cut in excise duty.
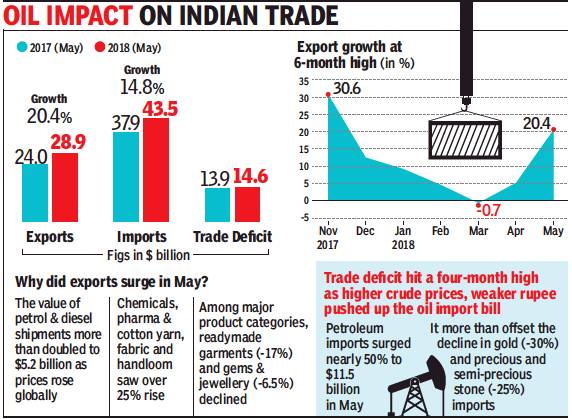
The impact of oil on India’s trade, 2017, 18
From: Sidhartha, Govt looks to boost dollar funding for exporters, June 16, 2018: The Times of India
See graphic:
The impact of oil on India’s trade: 2017, 2018
Export, import
2014-18

From: August 3, 2020: The Times of India
See graphic:
The Export and import of major petrochemicals from and to India, 2014-18.
2002-2021

From: August 12, 2021: The Times of India
See graphic:
Export of petroleum products, 2002-2021
Gas fields
Deepwater
Off the Andhra coast
Curtains for India’s first deepwater gas field, February 4, 2020: The Times of India
Reliance Industries and BP shut down the D1 D3 field in the KG-D6 block off the Andhra coast, bringing down curtains on India’s remarkable deepwater debut that was dogged by controversy right from the word go.
The joint venture is expected to re-enter the gas market by bringing to production three projects worth $5 billion in the same block — R cluster, Satellite cluster and MJ fields — by the middle of this year. The three projects have reserves of 3 tcf (trillion cubic feet) of gas, equivalent to 500 million barrels of oil. The D1 D3 field was put into production in April 2009 but soon saw output dip drastically due to drop in reservoir pressure and water ingress. The shortfall in production left some 24,000 MW power plants planned or built stranded. This prompted allegations of goldplating and led to the federal auditor’s report – first reported by TOI in June 2011 – saying the government favoured 3 explorers, including RIL for the KG-D6 project. That report prompted several policy changes to bring in transparency. The KG D6 Block has so far produced an overall 3 TCF resulting in energy import savings of over $30 billion. This field also established several global benchmarks in terms of operational performance including 99.9% uptime and 100% incident-free operations.
The RIL-BP joint venture managed to extend the life of D1 D3 field by five years, which otherwise would have ceased production in 2015 due to the geological issues.
Imports
Top sources of import
2012-19: imports and their origin
See graphic:
2012-19: India’s oil imports, and their origin
2018, 2019

From: Sanjay Dutta, February 26, 2020: The Times of India
See graphic:
The top ten nations that India imported oil from in 2018, 2019
Crude oil
2015-16

See graphic:
Total import of crude oil, 2015-16
2018-22

From: Sanjay Dutta, July 12, 2022: The Times of India
See graphic:
India’s import of crude oil, and products, 2018-22
From Iran
2013-18

From: Sanjay Dutta, June 29, 2018: The Times of India
See graphic :
India's oil import from Iran- (in million tonnes per annum), 2013-18, year-wise
From Nigeria
Nigeria says India now its largest crude importer
AFP | Jun 19, 2014
Oil-rich Nigeria said in June 2014 that India has replaced the United States as its largest crude importer, accounting for more than a quarter of its daily output.
"The US, which had traditionally taken the bulk of Nigeria's crude, has in recent months drastically reduced its demand, which now stands at about 250,000 barrels per day," the Nigerian National Petroleum Corporation (NNPC) said in a statement.
"India, however, now purchases some 30% of Nigeria's daily crude production which currently hovers around 2.5 million barrels," it said, quoting senior official Tim Okon.
The state-run NNPC said after India, China and Malaysia were also ahead of the United States, and that Nigeria, which is Africa's largest oil producer, would supply to customers around the world.
From OPEC
2018
From: Sanjay Dutta, Amid rising prices, India gives OPEC a strong message, June 15, 2018: The Times of India
See graphic:
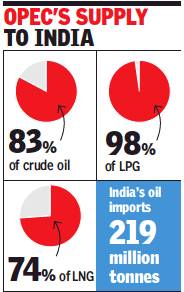
OPEC’s share in India’s imports of crude oil, LPG and LNG, presumably as in 2018
From Russia
Currency issues
As in 2023
Oct 21, 2023: The Times of India

From: Oct 21, 2023: The Times of India
India is rejecting pressure from Russian oil suppliers to pay for crude imports in the Chinese currency as tensions between New Delhi and Beijing continue to simmer.
Russia has accumulated billions of dollars worth of rupee assets given its wide trade surplus with India, but it’s struggling to use the funds. At the same time, Russia’s demand for yuan has grown sharply in the past year as its economy becomes more reliant on China for imports. Russian businesses have been settling more of their trade in yuan, with the Chinese currency replacing the dollar as the most traded currency in Russia this year.
Indian refiners mostly pay for Russian oil imports in dirhams, dollars, and a small amount of rupees — if oil prices are above the $60-a-barrel cap imposed by the US and its allies on Russian oil. While the yuan is sometimes used in smaller transactions, Russian oil suppliers are requesting that the Chinese currency be the main unit of transaction for oil trade, a senior government official said.
India’s resistance to transacting in yuan underscores its difficulty in balan cing relations between Russia — an important economic ally — and China, a geopolitical rival. At the same time, relations between India and China have remained strained on the back of continuing border disputes. The government won’t agree to those requests, according to the two people and two other government officials. Almost 70% of India’s re finers are government-owned, which means they would need to follow orders on payment instructions from the finance ministry.
Spokespeople at RBI, the finance ministry and the petroleum & natural gas ministry didn’t immediately respond to emails. Indian Oil, Bharat Petroleum and Hindustan Petroleum also didn’t respond.
BLOOMBERG
2023-24: Russian crude imports cut India’s oil bill by $8bn
Russian crude imports cut India’s oil bill by $8bn in FY24
New Delhi : India saved an estimated $7.9 billion in oil import in the 11 months of 2023-24 financial year ended March 31, compared to $5.1 billion over the whole of 2022-23, by purchasing higher volumes of Russian crude at deep discounts, ICRA Research said on Tuesday, reports Sanjay Dutta.
The savings leads to a “compression” of 15-22 basis points in India’s current account deficit-to-GDP ratio in 2023-24, it said. However, it added that if the low levels of discounts prevail, India’s net oil import bill could widen to $101-104 billion in 2024-25 from $96 billion in 2023-24, assuming an average crude price of $85 per barrel.
Based on commerce ministry data, the note pegs the share of Russian crude in India’s oil import basket rising to about 36% during the April 2023-February 2023 period, marking a jump of 1700% from about 2% in 2021-22.
2012- 22
Atul Thakur, April 6, 2023: The Times of India

From: Atul Thakur, April 6, 2023: The Times of India
India’s dependency on imports to meet its energy needs went up between 2012-13 and 2021-22 for all major sources — crude oil, natural gas and coal — shows data in a report recently released by the National Statistical Office (NSO). The jump was particularly pronounced in the case of natural gas, where the net import dependency rose from just over 30% to nearly 48%.
Overall, India’s energy import was 34. 2% of its energy consumption in 2012-13. This ratio had increased to 41% for 2021-22, the latest year for which data is available.
The analysis of net import dependency in the report Energy Statistics India, 2023 excluded petroleum products, the final products made from crude oil. Although India is a net exporter of petroleum products it has to import crude oil to manufacture them.
The report also shows that the import dependency has increased because the production growth couldn’t keep up with the consumption growth. For natural gas — which saw the highest increase in import dependency, in 2012-13 India was producing 70. 9% of its natural gas consumption which steadily declined to 53. 2% by 2019-20. Crude oil which saw a 4. 7 percentage point increase in import dependency also has a similar trend. In 2012-13 India was able to produce 17. 3% of its crude oil consumption which declined to 12. 3% by 2021-22. For coal and lignite, while the country was producing 78% of its consumption in 2012-13, this had declined to 75. 7% in the provisional estimates for 2021-22.
There has been a steadyincrease in the net import of most these energy products. In 2012-13 for instance, India’s net import of coal was 143. 3 million tonnes (MT) which has increased to 207. 8 MTs in 2021-22. Unlike coal, which India exports as well as imports, India doesn’t export crude oil and natural gas. Crude oil has also seen a similar increase in imports. Compared to 184. 8 MTs of imports during 2012-13, the corresponding figures were 212 MT for 2021-22. The import of natural gas rose from 17. 6 BCM (billion cubic meter) during 2012-13 to 30. 8 BCM in 2021-22.
2016-20

From: June 11, 2020: The Times of India

From: April 2, 2021: The Times of India
From: April 2, 2021: The Times of India
See graphics:
India’s import of petroleum products, 2016-20.
India's share of oil imports from key suppliers, 2000-20, year-wise.jpg
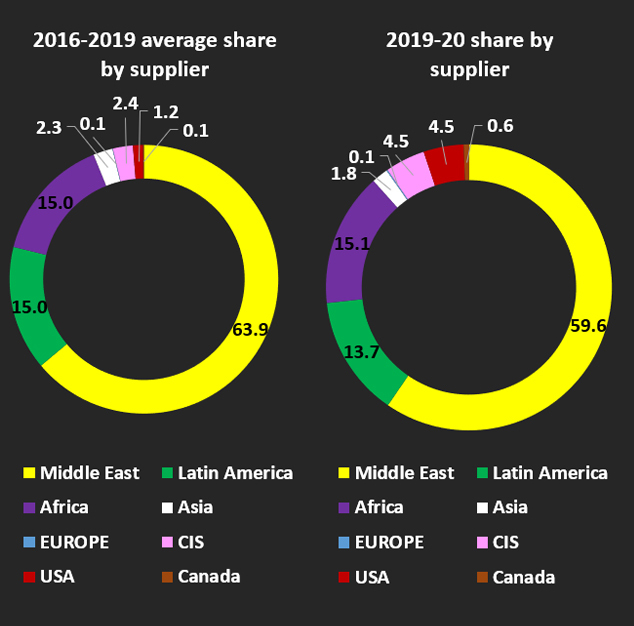
Import of oil in India- 2016-19 average share per supplier; 2019-20 share by per supplier
2018
July 24, 2018: The Times of India

From: July 24, 2018: The Times of India
Iran displaced Saudi Arabia as India’s second-largest oil supplier in the first quarter of the current fiscal, regaining a position it lost seven years ago, as state-run refiners scrambled to take advantage of Tehran’s attractive financial terms before the US sanctions covering the oil industry come into force in November.
Oil minister Dharmendra Pradhan told Parliament that state-run refiners imported more oil from Iran in the April-June period than Saudi Arabia, which has now been relegated to third position. Iraq remains India’s top oil supplier. The development could deepen the dilemma for New Delhi as it faces the prospect of having to reduce — or completely stop — oil imports from Iran if it fails to get a waiver. But industry sources said there’s enough time to wind down Iranian oil flow and tap other sources — if the need arises — by the sanctions deadline.
Iraq, Saudi Arabia and Kuwait could fill the gap, though there will be some incremental increase in costs as they may not offer the sweeteners on freight and insurance that Iran offers.
Besides, the high degree of technical capability gives Indian refineries flexibility to process a variety of oil, precluding dependence on particular types of crude.
Iran was India’s second largest oil supplier after Saudi Arabia till 2010-11
The diverse basket of India’s oil supplies also helps. The real challenge for India is balancing its age-old relations with Tehran and the financial/ strategic stake in the Chabahar port project, the outpost for New Delhi’s Af-Pak policy, and the imperative of avoiding confrontation with the US.
Iran was India’s secondlargest oil supplier after Saudi Arabia till 2010-11. But it dropped to seventh position after India gradually reduced import of Iranian oil to meet conditions of waiver granted by the US administration under President Barack Obama when it had imposed sanctions to curb Tehran’s nuclear prog ramme.
Imports were gradually ramped up after the sanctions were lifted following the July 2015 deal on Joint Comprehensive Plan of Action with Iran. State refiners, however, cut imports in 2017-18 by a quarter in retaliation of Tehran delaying the contract for Farzad-B gas field discovered by a consortium of Indian companies. But once again India’s oil trade with Iran may find itself back to square one. Unlike the sanctions by Obama’s presidency, Trump’s Washington so far appears totally unforgiving. The big two private refiners – Reliance Industries and Nayara led by Russia’s Rosneft – have stopped Iranian imports.
And the oil ministry has told the state refiners to look up alternative supplies in case India does not get a waiver.
Kerosene
2011-12: Use of kerosene in Indian households
The Times of India, Aug 03 2015

Mahendra Singh
`Kerosene hardly used for cooking, key lighting source'
The latest survey released by the National Sample Survey Organization (NSSO) has revealed that in rural areas, subsidized kerosene was used in less than 1% of kitchens, which relied largely on firewood and chips as the primary source of energy for cooking during 2011-12. After firewood (67% share), cooking gas cylinders have emerged as the second most preferred kitchen fuel in rural areas, with a share of 15%. In urban areas, of course, they now fire over 68% of the stoves, while the share of kerosene is estimated at 5.7%, lower than firewood (14%).
But when it comes to lighting homes in villages, the share of kerosene is estimated at 26.5%, with electricity's share estimated at 72.7%. In urban India, 3.2% of households uses kerosene for lighting while the share of electricity is 96%.
The data points to what several economists have argued for years: there is reduced dependence on kerosene despite the government doling out subsidized fuel, which is suspected to be used in large quantities for adulteration or finds its way into the open market, where there is no subsidy .
Currently , the government pays Rs 18.51 as subsidy for every litre of kerosene sold through the public distribution system. The underrecovery on the sale of kitchen fuel by the oil marketing companies added up to Rs 24,800 crore during the last financial year, with the government taking over around Rs 5,000 crore of the burden and forcing the state-run companies to bear the additional burden. But the findings of the NSSO survey showed wide divergence in fuel used across states such as Bihar and Uttar Pradesh still relying on dung cake and firewood to a large extent. The use of firewood and chips for cooking has declined, but slowly , over the years in rural India. It declined from 78.2% of all rural households in 1993-94 to 67.3% in 2011-12. LPG use in rural households has grown relatively fast, from fewer than 2% of rural households two decades ago to 15% in 2011-12. Cow-dung cake remained one of the major fuels for cooking for rural households in Ut tar Pradesh (33.4%) followed by Punjab (30.3%), Haryana (24%) and Bihar (20.8%).
Tamil Nadu had the highest use of LPG among rural households, with over a third using it for cooking, followed by Kerala and Punjab. The use of LPG was least in Chhattisgarh (1.5%) followed by Jharkhand (2.9%) and Odisha (3.9%).
When it comes to lighting, 73.5% of rural households in Bihar still use kerosene as primary source of energy for lighting, followed by Uttar Pradesh (58.5%) and Assam (36.8%).
Bihar also tops the chart when it comes to use of kerosene for lighting in urban areas with 17.2% of households still depending on kerosene.Followed by Bihar were Uttar Pradesh (10.8%), Assam (7.9%), Gujarat (5.2%) and West Bengal (5%).
The use of electricity was the highest in rural Andhra Pradesh, Punjab, Tamil Nadu and Kerala, where nearly all rural households used electricity to light their homes. In contrast, just 25.8% of rural Bihar and 40.4% of rural Uttar Pradesh households had electricity .
The problem with the kerosene subsidy
Of India's many subsidies, the kerosene subsidy is the worst. Yet it has been such a sacred cow that no government has dared tackle it for decades. Different states levy different taxes, but in most cities subsidised kerosene retails at around Rs 23litre (it is just Rs 13.50 in Chennai, because of the state's additional subsidy). The open-market price of kerosene (used for commercial purposes) is far higher, around Rs 57litre.
The government has announced that the price of subsidised kerosene will be raised by 25 paise per fortnight until the subsidy goes. At this speed, the losses suffered by refiners could end in a little over a year.However, the retail price (including taxes) needs to be raised to equal the diesel price. That alone will end the adulteration of diesel with kerosene.
Studies show that up to 40% of subsidised kerosene is diverted from poor beneficiaries to the adulteration of diesel, which is more than twice as costly. Adulterated diesel produces massive pollution, much more than ordinary diesel, and the additional truck fumes sicken and kill poor people living on roadsides. The extra pollution hits cities where shopkeepers and industries use diesel gensets to overcome power shortages. Villages using diesel for tractors and pumps also suffer. Subsidising kerosene means subsidising disease and death for millions through pollution.
Besides, kerosene-adulterated diesel damages the engines it is used in. Trucks, gensets, tractors and diesel pumps wear out much faster than they should. The subsidy kills machines as well as humans. The major beneficiaries are crooked adulterators. That's why it is the worst subsidy.
Many left-wing critics have said on TV that the poor will not survive if kerosene becomes costly. Really?
In 2014, Delhi was declared kerosene-free -all sales, subsidised or not, were banned -with consumers having to shift to cooking gas. Chandigarh became kerosenefree in 2016. Did the poor in these cities cease to live?
Did they flee to areas where cheap kerosene was available? Not at all. Indeed, thousands kept migrating from kerosene-available to kerosene-free areas. Haryana has just become kerosene-free last April. All such areas have reduced pollution and hit adulterators, without causing mass distress.
What matters for the poor is not the price of this or that item but overall inflation. But consumer price inflation is now down to 1.54%, the lowest for decades. The gradual upward price drift of kerosene will impact the index only marginally. There will never be a better time to decontrol the price. The needy can be given a free solar lamp for lighting, or a direct cash transfer.
Subsidies are palliatives. Only rapid economic growth accompanied by rising wages can cure poverty.Subsidies are nevertheless warranted for the needy . But, as Swaminomics has argued for decades, the right approach is to give cash to the needy, instead of subsidising goods that may well be used by the rich or crooks.The subsidy on urea, for instance, goes mainly to richer farmers with large holdings, while some is smuggled into Bangladesh. Ultra-cheap urea discourages the use of green manure which is environment friendly. It also means farmers use an excess of urea and not enough potassic or phosphatic fertilisers (which are not subsidised), and this ruins soil quality. Just as subsidising kerosene benefits the wrong people and activities, so too does subsidising urea, or rural power, or almost anything else.
Narendra Modi can no longer be called just an incremental reformer. True, he has moved in baby steps in many areas. But cumulatively they are adding up to a substantial change. When the price of oil was at its height, explicit and implicit subsidies on petroleum products were 2% of GDP. The UPA government devised the strategy of raising the price of petrol in baby steps.The Modi government has extended this to all petroleum products, and buttressed the change with direct cash transfers to the needy. Soon oil subsidies may be down to zero, freeing lakhs of crores to be spent on improving infrastructure, health and skills.
The risk is that new subsidies will take the place of the old. The farm loan waiver that started in UP has spread to other states, and looks certain to be announced in all states going to the polls in the next 18 months. UP, Rajasthan and other states are starting subsidised canteens along the lines of Tamil Nadu's “Amma Canteens“. Ending the kerosene subsidy is a step forward, but the battle for sensible government spending is nowhere near won.
LPG (Liquefied Petroleum Gas)
Price
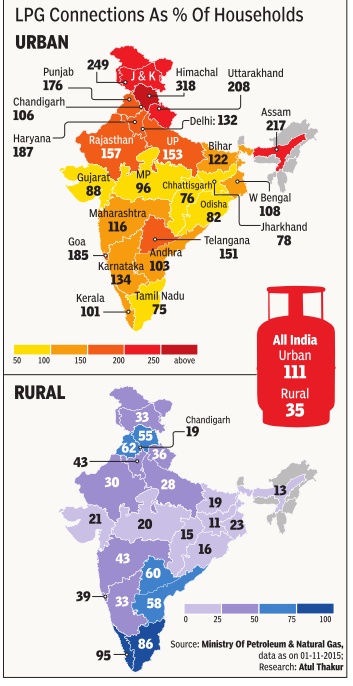
2016> 21
March 10, 2021: The Times of India
LPG price has doubled in 7 yrs, and the subsidies are gone too
New Delhi:
The price of a household cooking gas, or LPG, refill has doubled in the last seven years and subsidy has been erased by raising rates in small doses over the years.
Simultaneously, the government’s tax collection from petrol and diesel sales has risen four and a half times as a result of increased taxes during this period, according to oil minister Dharmendra Pradhan’s written replies in the Lok Sabha. According to replies to a bunch of questions on rising fuel prices on Monday, an LPG refill cost Rs 410.5 cylinder on March 1, 2014 and has risen to Rs 819 this month. The prices are for Delhi, the reference market, and vary in accordance with state taxes elsewhere.
LPG refill price jumped Rs 125 per cylinder in the last 32 days alone as a result of four increases since February 4, stretching budgets of poor households. On the previously unheard levels of fuel prices, Pradhan said petrol and diesel had been decontrolled from June 26, 2010 and October 19, 2014, respectively, and retailers set prices in line with “international product prices, rupee exchange rate, tax structure, inland freight and other cost elements”.
With taxes accounting for the bulk of the retail prices, revenue collection from fuel sales stood at Rs 52,537 crore in 2013, which rose to Rs 2.1 lakh crore in 2019-20 and Rs 2.9 lakh crore in the 11 months of 2020-21.
Petrol carries an excise duty of Rs 32.9 per litre and diesel Rs 31.8 a litre. Excise on petrol was Rs 17.98 a litre in 2018 and Rs 13.83 on diesel.
Pradhan said that the central government’s total excise collection from petrol, diesel, jet fuel, natural gas and crude oil has increased from Rs 2.4 lakh crore in 2016-17 to Rs 3 lakh crore during April-January 2020-21.
Oil bonds
Team TOI Plus, August 18, 2021: The Times of India
From: Team TOI Plus, August 18, 2021: The Times of India
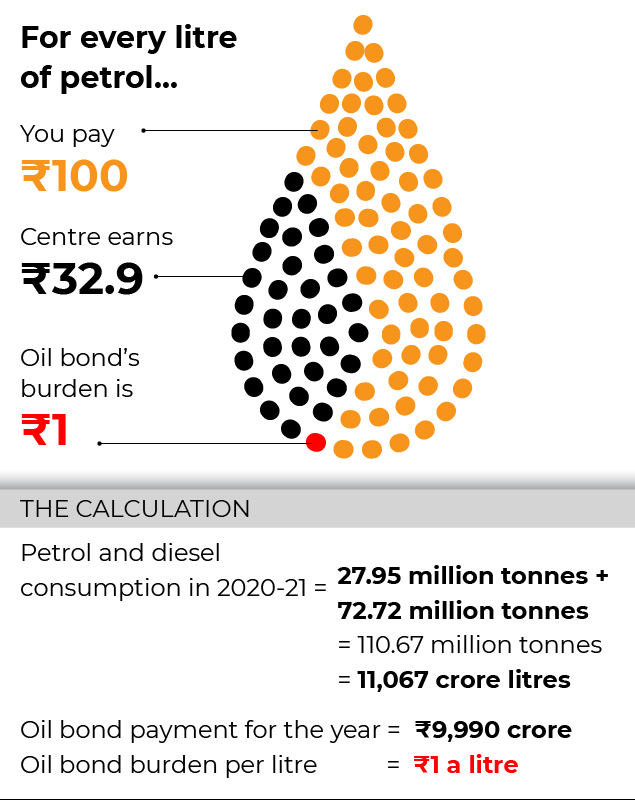
The calculation: Petrol and diesel consumption in 2020-21
From: Team TOI Plus, August 18, 2021: The Times of India
The prices of petrol and diesel have been going up relentlessly for more than a year now, crossing Rs 100 a litre of petrol in many places. In the past few weeks, an opposition campaign brought high fuel prices to the forefront, forcing the government to acknowledge the price hikes.
In what has become a trademark defence, finance minister Nirmala Sitharaman blamed the previous UPA government for issuing oil bonds, which the present NDA government has to service. "If I did not have the burden to service the oil bonds, I would have been in a position to reduce excise duty on fuel. Previous government has made our job difficult by issuing oil bonds," Sitharaman has said, effectively ruling out a cut in excise duty on petrol and diesel to ease prices. With petrol prices zooming, Sitharaman has been under pressure to reduce taxes on auto fuel as levies account for over half the retail prices.
The story of oil bonds
Till 2010, the retail prices of petrol and diesel bore little relation to international prices. The government artificially controlled prices, refusing to ask the general population to pay more for fuel. The result was that oil marketing companies were buying fuel at far higher prices than they sold it, leading to what the government called “under-recovery”. Oil marketing companies were compensated by the government through fuel subsidies allocated in the Union budget.
When global crude oil prices started going up dramatically after America’s invasion of Iraq in 2003, the UPA government headed by Manmohan Singh decided not to pass on the burden to consumers and kept retail prices low. Crude prices continued to rise in the following years, reaching a high of $147 in 2008 (they are hovering around the $70 a barrel mark now), and so did the under-recoveries of the oil marketing companies. That also meant huge subsidy bills for the government and the chance of the budget's fiscal deficit (the difference between what government earns and what it spends) targets going haywire.
So, instead of compensating the oil companies with cash, the government decided to turn it into a sort of a loan by issuing long-term ‘oil bonds’. These bonds carried an annual rate of interest and a schedule for repayment of the principal amount. The oil bonds did not show as budgetary expenditure and the liability of payments was pushed to the future.
Where’s the burden?
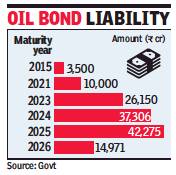
Between 2005 and 2010, the UPA government had issued oil bonds worth Rs 1.44 lakh crore with a tenure of 10-15 years; Rs 1.34 lakh crore worth of bonds became due after 2014 and only two bonds that have matured till now and are worth Rs 3,500 crore have been paid back till now. Two more bonds adding up to Rs 10,000 crore mature this year in October and November and need to be paid. The annual interest payments have continued. The UPA-II government had also paid Rs 53,163 crore in interest for oil bonds between 2009-10 and 2013-14.
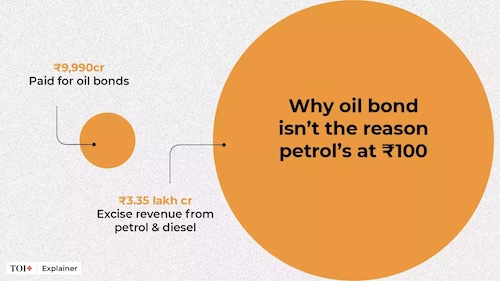
This is what Sitharaman is worked up about – paying Rs 10,000 crore later this year. However, bond payment – interest as well as capital – are a tiny fraction of what the government has collected by keeping fuel prices artificially high through taxes. Excise duty on petrol was hiked from Rs 19.98 per litre to Rs 32.9 last year. This helped the government soak up the benefit that would have reflected in retail prices after international oil prices had plunged to multi-year low as pandemic gulped demand. The excise duty on diesel was raised to Rs 31.8 from Rs 15.83 a litre. This led to excise collections on petrol and diesel jumping to Rs 3.35 lakh crore in 2020-21, from Rs 1.78 lakh crore a year back. In 2018-19, excise collections on petrol and diesel were Rs 2.13 lakh crore. In comparison, in 2014-15, when the NDA government first came to power the central excise duty collected was Rs 29,279 crore on petrol and Rs 42,881 crore on diesel. The interest payments on the oil bonds have continued for almost two decades now and have been a part of the government’s budgets.
The oil bonds that are due now are not the first ones issued. The first set was, in fact, issued during the NDA government of 2002. The then oil minister had said that the Reserve Bank of India had issued bonds worth Rs 9,000 crore to liquidate 80% of the oil pool deficit. Apart from bonds for oil, past governments have issued similar bonds to compensate fertiliser companies for losses incurred due to low government-mandated prices. The current government has issued bank recapitalisation bonds worth over Rs 2.5 lakh crore to government banks as these won’t require money to be allocated from the budget. It has also used the National Small Savings Fund (NSSF) to keep the food subsidy bill outside the budget.
Interest liability
2014-21
See graphic:
Interest liability on Oil bonds, 2014-21
Subsidies and Oil Bonds
As in 2018
From: Sanjay Dutta, ₹1.3L cr oil bond burden limits scope for tax cut, September 14, 2018: The Times of India
The oil price spike during the global economic boom may be history but the Centre is still dealing with unpaid subsidy bills of over Rs 1.3 lakh crore dating back to a decade, leaving the Narendra Modi government little fiscal headroom to reduce tax on petrol and diesel.
The Atal Bihari Vajpayee government had ended subsidy on petrol and diesel in April 2002. But the UPA brought back the subsidy regime to keep pump prices artificially low under pressure from coalition partners, particularly the Left parties.
The subsidy regime was implemented through a three-way burden-sharing mechanism. Under this scheme, the government bore one-third of the under-recovery on fuels through subsidy and the remaining part was split among state-run oil refiners such as IndianOil and BPCL and upstream companies such as ONGC.
The UPA government finally freed up petrol pricing in June 2010 but continued the subsidy on diesel. As the subsidy bill continued to swell, it decided on a ‘graded’ increase to wipe out the gap between cost and market price.
ONGC and Oil India Ltd had for more than 13 years paid as much as 40% of the under-recoveries arising from fuel retailers selling petrol, diesel, domestic LPG and kerosene at a government-mandated price, which was way below cost.
A part of the subsidy liability was shifted for future by issuing oil bonds of over Rs 1.4 lakh crore, a part of which will mature in 2021 and continue through 2026. Of the total bonds, only three tranches adding up to Rs 11,500 crore have matured till 2015. Government sources said the bonds entail huge annual interest payout as the papers were issued at an average 8% interest rate.
The Modi administration has been under pressure to lower excise duty on petrol and diesel to arrest runaway retail prices. On Thursday, petrol touched a record high of Rs 81 a litre and diesel soared to 73.08 a litre in Delhi, the benchmark market where state taxes are among the lowest in the country.
Oil storage, trading hub in India
2018: Abu Dhabi oil in Mangaluru’s underground storage facility
1st oil ship from UAE docks at Mangaluru, May 22, 2018: The Times of India
The first shipload of crude sent by ADNOC (Abu Dhabi National Oil Company) for storing in the Mangaluru underground storage facility arrived on Monday, marking India’s first step towards becoming a regional oil storage and trading hub.
Vessel ‘MT Inspiration’ carrying two million barrels of crude docked at the Mangaluru port after sailing for a week, the oil ministry said. ADNOC had in February signed a deal with Indian Strategic Petroleum Reserve Ltd to lease storage capacity for six million barrels of crude at the Mangaluru facility.
This is the first investment from the UAE into an Indian oil project and marks a turning point in Delhi’s buyerseller ties with West Asian oil producers. India wants to reshape its traditional ties with West Asian oil producers into strategic partnership by investing oil projects. The storage puts on tap oil stock for India, enhancing energy security in times of emergency.
Oil spills
Steps to control impact of oil spills
2019: Chitosan/ switching into extremely water-repelling to extremely oil-repelling and vice-versa
R. Prasad, A gel to selectively remove oil or water, March 17, 2019: The Hindu

From: R. Prasad, A gel to selectively remove oil or water, March 17, 2019: The Hindu
A natural biopolymer, chitosan (a kind of polysaccharide obtained from a chitin shell such as the shrimp’s), which is water-soluble, has been chemically modified by researchers at the Indian Institute of Technology (IIT) Guwahati to selectively remove either an oil or water phase from an oil-water mixture. This becomes possible by making the chitosan-based material, also biodegradeable, to exhibit either an extremely water-repelling property in air (like the lotus leaf) or an extremely oil-repelling property under water (like a fish scale).
In a breakthrough, the researchers have also made it possible to switch the chitosan-based material’s property — from being extremely water-repelling to extremely oil-repelling and vice-versa — by treating it with certain chemicals. It is also possible to repeatedly switch from one property to another.
Fabrication
To prepare the water or oil repelling chitosan, a team led by Dr. Uttam Manna from the institute’s Department of Chemistry and Centre for Nanotechnology first converted the material into nanoparticles and then to a stable gel material by treating it with a chemical (5Acl). This gel was found to have chemically active residues (amines and acrylate), which when treated with a small amine resulted in optimisation of the two very different properties in the same material.
Says Nirban Jana from the institute’s Department of Chemistry and first author of a paper published in the journal Chemistry of Materials, “This is the first time that the liquid repellency property of the material is made switchable, from superhydrophobic to superoleophobic under water and back to superhydrophobic by treating the material at low pH and ethanol, respectively.”
The chitosan — which is converted into a stable gel — allows the researchers to selectively remove the oil or water phase from an oil-water mixture by making the material either superhydrophobic or superoleophobic, respectively. For example, if the oil spill (in water) is less, the material can be made water-repelling to remove or collect the oil. In case the spill is huge and the water phase relatively less, the material can be made extremely oil-repelling to collect or remove water.
Property switch
By treating the material with acid (pH 1) for about 15 minutes, the team (led by Dr. Uttam Manna from the institute’s Department of Chemistry) was able to completely switch the property of the material — from being extremely water-repelling to becoming extremely oil-repelling under water.
Similarly, by treating the biopolymer with ethanol for 10 minutes followed by air drying, the team was able to switch the property from being oil-repelling to becoming water-repelling.
Says Dr. Manna, “The water contact angle of the superhydrophobic biopolymer is over 152º and the oil contact angle under water is nearly 159º.” The higher the contact angle the greater is the liquid repellency of the material.
Superior performance
The researchers tested the ability of the biopolymer to separate oils — kerosene, motor oil, olive oil and even crude oil — of different densities from water. Says Dr. Manna, “Under water, we were able to completely remove even crude oil from the water phase. The selective separation efficiency for both oil and water phases was above 95% immaterial of the viscosity of the oil.”
The biopolymer’s superhydrophobic property remained intact under diverse chemical conditions such as extreme pH (pH 1 and pH 13), sea and river water for seven days, and high (100º C) and low (10º C) temperatures.
The material was found to retain both hydrophobicity and oleophobicity even when the top surface of the biopolymeric material was physically abraded using sand paper. Despite the abraded surface being cleaved through manual peeling using an adhesive, the liquid repellence property remained intact. No change in this was seen after the mechanically damaged material was subjected to even a continuous stream of sand grains. Exposure to UV light for a month too did not destroy this repellence property.
Output
2015-19
August 3, 2020: The Times of India

From: August 3, 2020: The Times of India
See graphic:
Output of major petrochemicals in India, 2015-19
Petrol pumps
2017: number of pumps, increase in 6 years
November 29, 2017: The Times of India
India has recorded 45 per cent jump in the number of petrol pumps in the last six years, possibly the highest growth rate in the world, as public and private sector firms jostled to capture retailing sites.
With 60,799 outlets dispensing petrol and diesel at the end of October, India is behind only US and China in number of petrol pumps, data available from Petroleum Planning & Analysis Cell of the Oil Ministry.
In 2011, the country had 41,947 outlets, of which 2,983 or 7.1 per cent, were owned or operated by private retailers like Reliance Industries and Essar oil.
Private firms own 5,474, or 9 per cent of the total outlets, with Essar being the leader with 3,980 stations. US and China have around one lakh petrol stations each.
Several countries around the globe have seen the number of petrol pumps drop as they moved towards Electric Vehicles (EVs) and alternate forms of energy but they have grown in India, which is the world's fastest growing oil consumer.
India had in 2015 overtaken Japan as the world's third- largest oil consuming country behind US and China. Fuel consumption grew by 9.5 per cent in the April-October period of the current fiscal.
Oil ministry data showed that 18,852 outlets were added between 2011 and 2017. Of the 60,799 petrol pumps in the country, 55,325 are owned by state-owned fuel retailers. India Oil Corp (IOC) owns and operates 26,489 petrol stations, of which 7,232 are rural outlets. Hindustan Petroleum Corp Ltd (HPCL) is the second biggest fuel retailer with 14,675 outlets, 3,159 being rural sites. Bharat Petroleum Corp Ltd (BPCL) owns 14,161 outlets, of which 2,548 are rural outlets.
In the private sector, Reliance Industries owns 1,400 outlets while Royal Dutch Shell has 90 stations. Besides, there are 1,273 outlets dispensing CNG to automobiles, the most number of 423 being in Delhi, the data showed.
Industry officials said public sector oil companies will continue to add at least 2,000 petrol pumps per annum over the next few years. In the private sector, Essar, which was recently taken over by Russia's Rosneft, had been the most aggressive. It had 1,382 outlets in 2011 and now has 3,980, which it plans to take up to 5,600 by March 2019.
Reliance Industries is going slow on the fuel retailing business and hasn't added any new site recently. It has concentrated on reopening the pumps that were shut because it could not compete with subsidised price of fuel at PSU outlets.
With deregulation of petrol in June 2010 and diesel in 2014, private players have once again become active on fuel retailing expansion.
Pipeline
2019/ South Asia’s first cross-border pipeline
Prices
How petroleum is priced in India
Why level of petroleum tax is open to debate, January 29, 2018: The Times of India
From: Why level of petroleum tax is open to debate, January 29, 2018: The Times of India

From: Why level of petroleum tax is open to debate, January 29, 2018: The Times of India

From: Why level of petroleum tax is open to debate, January 29, 2018: The Times of India
From: Why level of petroleum tax is open to debate, January 29, 2018: The Times of India

From: Why level of petroleum tax is open to debate, January 29, 2018: The Times of India

From: Why level of petroleum tax is open to debate, January 29, 2018: The Times of India
See graphics:
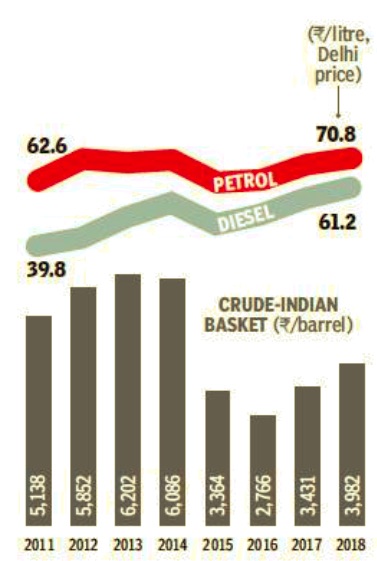
1. Petroleum prices in India, 2011-18
2. India vis-à-vis other big economies, oil consumption and prices
3. What is tax on petrol and diesel, India, January 2018
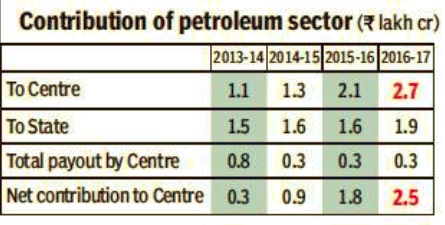
4. Contribution of petroleum sector to centre and state, 2013-17, year-wise
5. India's import dependency for crude oil and domestic consumption, 2013-14, year-wise
6. India vis-à-vis other big economies, petrol prices, GDP per capita and prive of litre of petrol as % of daily per capita GDP
India’s daily consumption of crude oil is 4.5 million barrels (1 barrel about 159 litres), the third highest globally. Only the US and China consume more than us. We however have way smaller domestic oil reserves and are dependent on imports for about 80% of our total oil consumption.
How is petroleum priced in India?
The government gotinvolved in regulating oil prices from 1948, and decided that international prices alone could not be the determinant as indigenous production and refining capacity was increasing. From the70s to the early 2000s, the oil prices committee recommended an administered pricing mechanism based on domestic cost of production. In 2010, petrol prices were deregulated, while diesel was freed up in 2014.
How do global crude prices reflect in India?
In 2012, 2013 and 2014 crude prices crossed unprecedented levels and impacted our petrol prices, at the time deregulated. Subsequently, the priceof theIndian basket of crude has fallen but fuel prices in the domestic market have gone up becauseof taxes. Incidentally, prices are not completely dependent on the international market.
So, does the govt make no money from petroleum products?
Data for the past four years shows both Centre and states make large sums from petroleum products. For instance, in 2013-14, the Centre collected Rs 1.1 lakh crore as taxes from petroleum of which Rs 0.8 lakh crore was spent in payouts including subsidies. This translated into a net gain of Rs 0.3 lakh crore for the Centre. This gain increased to Rs 2.5 lakh crore in 2016-17.
Isn’t it fair to tax petroleum and use that money for welfare?
In most advanced countries (barring the US) petroleum is a highly taxed commodity. But these countries have way higher incomes as compared to the average Indian and the cost doesn’t pinch as much as it does Indians. In this scenario, a high tax on petrol in a country at our income level remains a matter of debate.
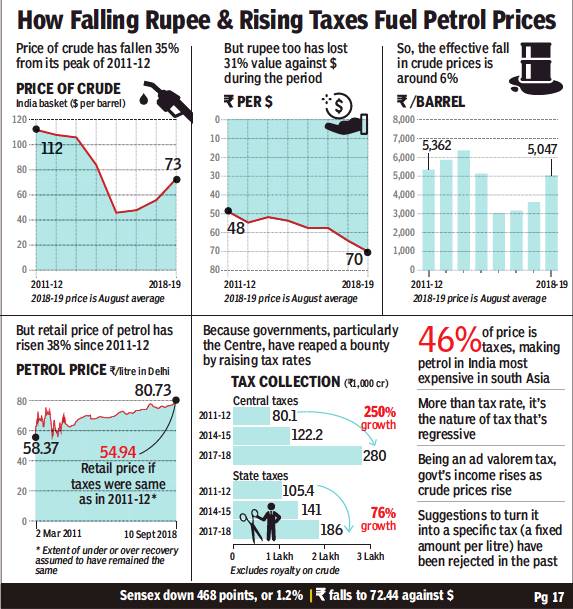
2011-18: impact of rupee’s value and taxes
September 11, 2018: The Times of India
From: September 11, 2018: The Times of India
See graphic:
2011-18- The impact of the rupee’s value and taxes on the price of petroleum
Imports are low but pricing assumes imports: 2015-18
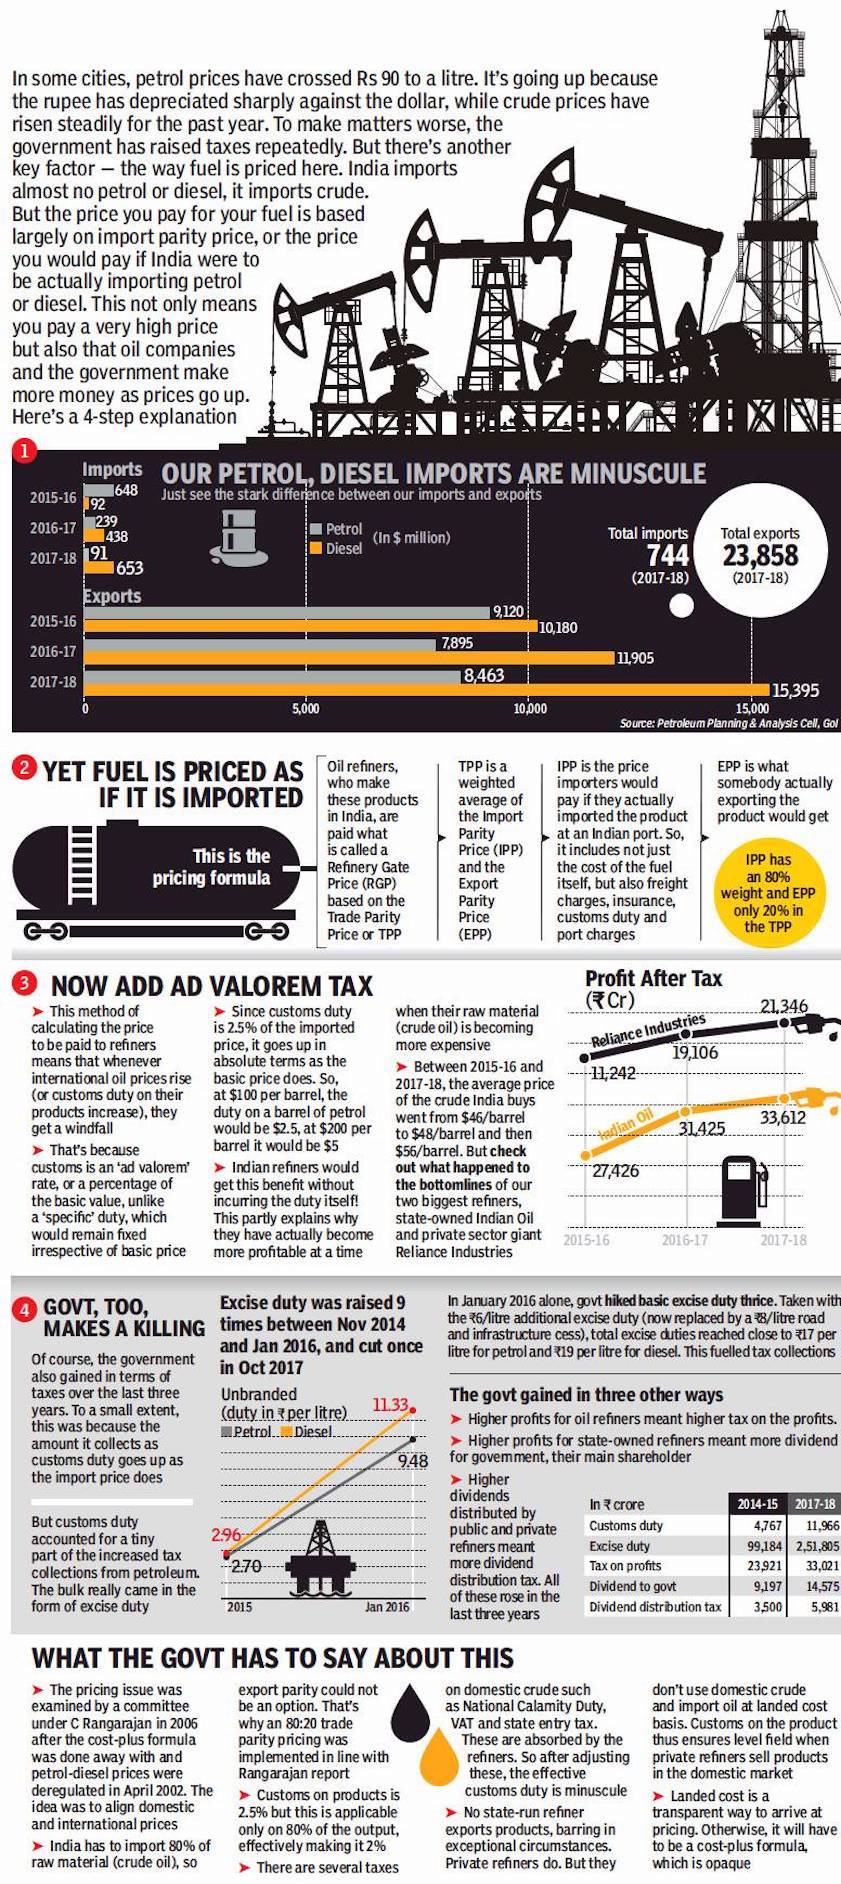
ii) Fuel in India is priced as if it is imported;
iii) Profits of India’s oil companies (Reliance, Indian Oil), 2015-18; and
iv) Taxes earned by the government from the sales of Petrol and diesel: 2014/5- 18
From: September 20, 2018: The Times of India
See graphic:
i): Petrol and diesel: imports into and exports from India, 2015-18;
ii) Fuel in India is priced as if it is imported;
iii) Profits of India’s oil companies (Reliance, Indian Oil), 2015-18; and
iv) Taxes earned by the government from the sales of Petrol and diesel: 2014/5- 18
Changes in the prices of oil, petroleum, diesel, natural gas
2002-16
See graphic:
The difference between the prices of diesel and petrol, 2002-16
Percentage share of diesel vehicles in total sales, 2009-16


2006–2014

From: The Times of India
See graphic:
Change in petrol, diesel, crude oil prices: 2006–2014
2012-2020

From: May 6, 2020: The Times of India
See graphic:
The per-litre retail price of petrol and diesel in Delhi, 2012-2020
2013-16

See graphic:
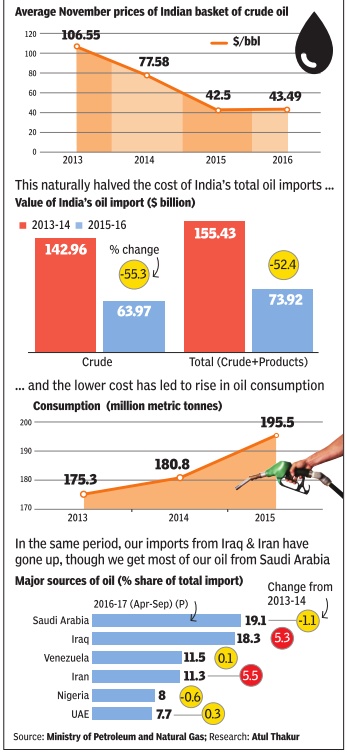
Average November prices of Indian basket of crude oil, Value of India's import and consumption, 2013-16
2014-17

ii) Retail prices of petroleum and diesel in Delhi, 2014-17;
iii) Retail prices of petroleum and diesel in Bangladesh, Nepal, Pakistan and Sri Lanka in Sept 2017;
iv) The component of taxes in Delhi
From The Times of India, September 14, 2017
See graphic:
i) The price of crude oil, 2014-17;
ii) Retail prices of petroleum and diesel in Delhi, 2014-17;
iii) Retail prices of petroleum and diesel in Bangladesh, Nepal, Pakistan and Sri Lanka in Sept 2017;
iv) The component of taxes in Delhi
2015
Mar 26 2015
The basic price of petrol and the excise duty levied by the central government is uniform across the country. The final retail prices, however, vary from state to state depending on the state-level VAT, sales tax, local freight, delivery charges and so on. A comparison of 33 markets in different states shows that petrol is cheapest in Port Blair where it costs Rs 54.1 a litre, about 14 rupees cheaper than in Hyderabad where the rate is highest. Port Blair again has the cheapest diesel, with prices there 10 rupees lower than in Mumbai, which has the most expensive diesel in the country.
2016: crude price lowest in 12 years

The Times of IndiaJan 09 2016

TIMES NEWS NETWORK
The price of crude bought by Indian refiners slumped to its lowest level in nearly 12 years, renewing hopes of continued reduced pump prices for consumers. It has also created room for government to raise fuel taxes to prop up the central kitty . However, it could also spark fresh worries of inventory losses for oil company bosses.
The mix of crude that India buys, called the `Indian basket', slumped after the European benchmark Brent slipped to its lowest in 13 years on worries over a slowdown in China, the second biggest oil consumer, amid oversupply .
For India, which imports 80% of its crude requirement, the happy hour also carries a statutory warning over currency and export woes.
The upside of low oil prices comes from forex savings on crude import. The savings are estimated at Rs 2 lakh crore this year. Latest data projects a 35% drop in the oil import bill at $73 billion against $112 billion last year, for nearly the same quantity . This is in addition to reduced subsidy for cooking fuels.
To put the savings in per spective, it would be enough to cover the Centre's school education, health, women and child development budgets, and pay for the rural jobs scheme. The government may also utilize this window to mop up additional resour ces by going for another round of excise hike on fuels. Signs of stability in global markets helped the domestic equities break a four-session losing streak but failed to stop the BSE sensex from logging its worst weekly performance since November 2011.
The benchmark BSE sensex rose by 82.5 points to recover from 19-month lows on Friday but on a weekly basis tumbled by 1,226.6 points or 4.7% on concerns over the health of Chinese economy and geopolitical tensions between Saudi Arabia and Iran.
2018, May: retail prices highest since 2013
Why Petrol Price Has Hit A Record High , May 21, 2018: The Times of India

i) From June 2002- April 2018;
ii) Compared to neighbouring countries; iii) Compared to major economies;
iv) The ‘components’ of the Petroleum and diesel prices
From:Why Petrol Price Has Hit A Record High, May 21, 2018: The Times of India
Are present petrol and diesel prices highest ever?
In the last 16 years petrol, reached the highest price of Rs 76.06 per litre in Delhi on September 14, 2013. The next four highest prices were reached in May 2018. The present price of diesel, on the other hand, is the highest ever in this 16-year period.
What is the proportion of taxes as a component of the prices?
Over 50% of petrol’s retail price constitutes taxes and dealer commissions. For diesel, the corresponding figure is over 40%. Taxes vary in different states and hence there are variations in retail prices.
In which cities are these fuels the most and least expensive?
Petrol is most expensive in Mumbai, while Hyderabad has the highest diesel price. It is interesting that in many cities the difference between petrol and diesel prices have narrowed significantly meaning there would be very little advantage for diesel vehicle owners.
Does India have the region’s highest petrol prices?
For petrol and diesel, prices are the highest in India. Effective cost of LPG cylinder after DBTL — Direct Benefit Transfer of LPG — is the lowest in India. Only Sri Lanka has a lower price of kerosene oil.
Are India’s petrol prices more than other large nations?
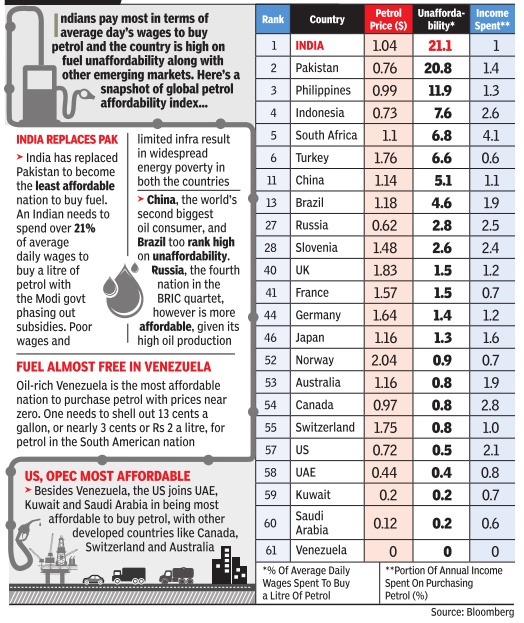
In advanced countries (except the US) petroleum is a highly taxed commodity. Average citizens of these countries, however have higher income as compared to average Indians and the cost doesn’t set them back as much as it does for us. For instance it will cost about 20% of the daily income of an average Indian to buy a litre of petrol.
2019-20: difference between petrol and diesel prices shrunk to 71 paise
Sanjay Dutta, June 23, 2020: The Times of India

From: Sanjay Dutta, June 23, 2020: The Times of India
The difference between petrol and diesel prices shrunk to 71 paise, or less than 1%, its lowest-ever, in Delhi on Monday after state-run fuel retailers raised prices for the 16th consecutive day. In Mumbai, the gap shrunk to less than 12%, or Rs 9.12 a litre, which is still the narrowest so far.
After the latest increase, petrol price rose to Rs 79.56 a litre and diesel to Rs 78.85, the highest in 21 months.
In Mumbai, petrol sold for Rs 86.36 a litre and diesel for Rs 77.24.
Government data show the gap was widest at Rs 30.25, or nearly 74%, on June 18, 2012 when petrol cost Rs 71.16 a litre and diesel Rs 40.91 in Delhi. In Mumbai, the gap was widest at Rs 31.17 on June 28, the same year when petrol sold at Rs 76.45 a litre and diesel Rs 45.28.
Tax on diesel was mostly kept low
Diesel prices have traditionally trailed petrol by a wide margin because of the way it used to be taxed by the Centre and states. Tax on diesel was kept low as it is mainly used by transporters and farmers.
But since fuel-pricing was deregulated in October 2014, this difference has also narrowed. In Delhi, for example, taxes account for 64% of petrol price and 63% of diesel price. The variation in price gaps seen in the two metros is due to the difference in state levies, which magnifies the impact of central taxes and price revisions. Fuel taxes in Delhi were among the lowest in the country till April, while state levies in Mumbai were among the steepest.
This reversed after the Delhi government jacked up VAT on diesel to 30% from 16.75% on May 4, which keeps diesel prices higher than Mumbai. VAT on petrol was also raised to 30% from 27% but it is still lower than Mumbai.
Diesel has been catching up slowly ever since the daily price revision was introduced in June 2017.
2020 Feb, 2021 February

From: Sanjay Dutta, February , 2021: The Times of India
See graphic:
The per-litre retail price of petrol and diesel in Delhi, Mumbai: 2020, 2021
The component of central, state taxes, 2014-16

States keep Centre company in milking fuel consumers, September 21, 2017: The Times of India
See graphic:
States with highest sales tax, VAT rates on petrol and diesel
The spike in pump prices has brought the excise duty hikes on petrol and diesel between 2014 and 2016 back into focus. But the public outcry over the government's refusal to prune the tax has overshadowed the fact that the Centre is not alone in milking fuel consumers.State government too are raking it in through high sales tax or VAT, with states ruled by the BJP or its allies making up the top grossers.
This is one of the reasons the Centre has remained steadfast against cutting excise duty even after petrol has become costlier by over Rs 7 per litre or so since July .Pump prices rose to their three-year highs in cities such as Mumbai because of high state taxes amplifying the impact of recent rise in international product prices.
VAT collection from fuels has risen more than 16% from Rs 1,42,848 crore in 2015-16 to Rs 1,66, 378 crore in 2016-17.During the same period, however, just excise mop up from fuels has risen over 35% from Rs 1,78,591 crore to Rs 2,42,691 crore, according to PPAC da ta. In addition, the Centre also collects royalty, cess and dividend from the oil industry .
No wonder consumers are seeing the Centre's move to raise excise on fuels as the fly in the ointment. The Centre had cumulatively hiked excise on petrol by Rs 11.77 per litre and on diesel Rs 13.47 a litre between November 2014 and January 2016 to soak up part of the benefit of tumbling global oil prices.
Finance minister Arun Jaitley and oil minister Dharmendra Pradhan had then separately explained in Parliament that the government was doing this to raise funds for infrastructure and social welfare schemes.
Jaitley tried to shift the focus on states by saying they charge a high amount of sales tax or VAT on fuel and the Centre needs money to spend on infrastructure and social sectors to keep the engine of growth ticking.
…in 2013, Oct and 2018, May

From: May 22, 2018: The Times of India
See graphic:
The component of central and state taxes in the prices of Petroleum and diesel in India in 2013, Oct and 2018, May
Affordability
2017

From The Times of India, October 5, 2017
See graphic, Petrol prices as a percentage of a day’s income, in India and other major countries, in 2017
As in 2021; prices: 2012-21
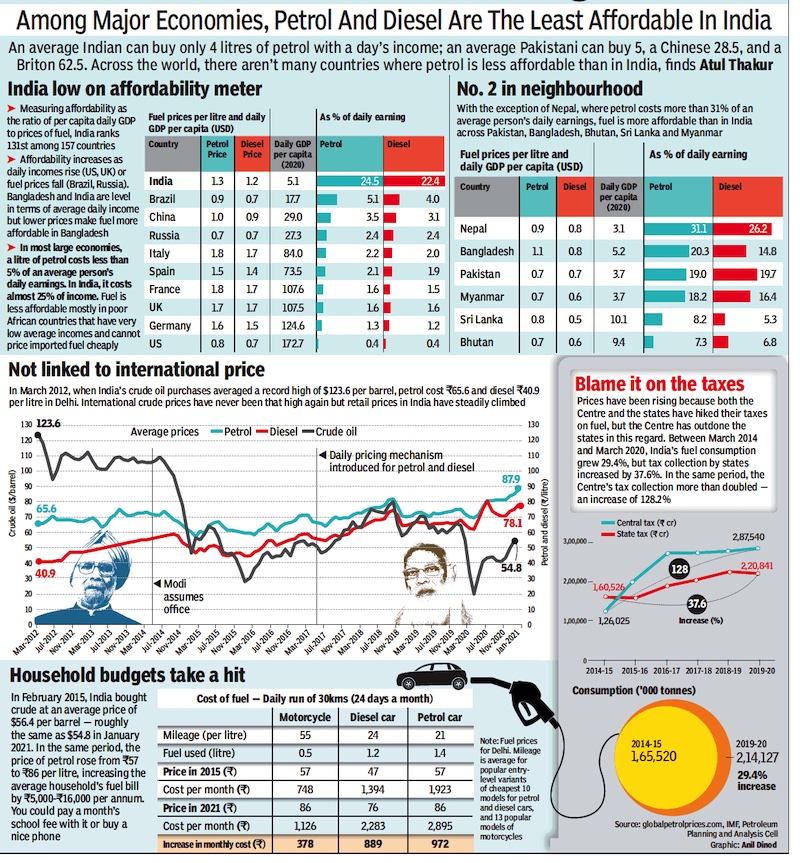
From: February 20, 2021: The Times of India
See graphic:
Petroleum, diesel: Affordability 2021; prices: 2012-21; International comparisons: 2021
International price comparisons
1998> 2018
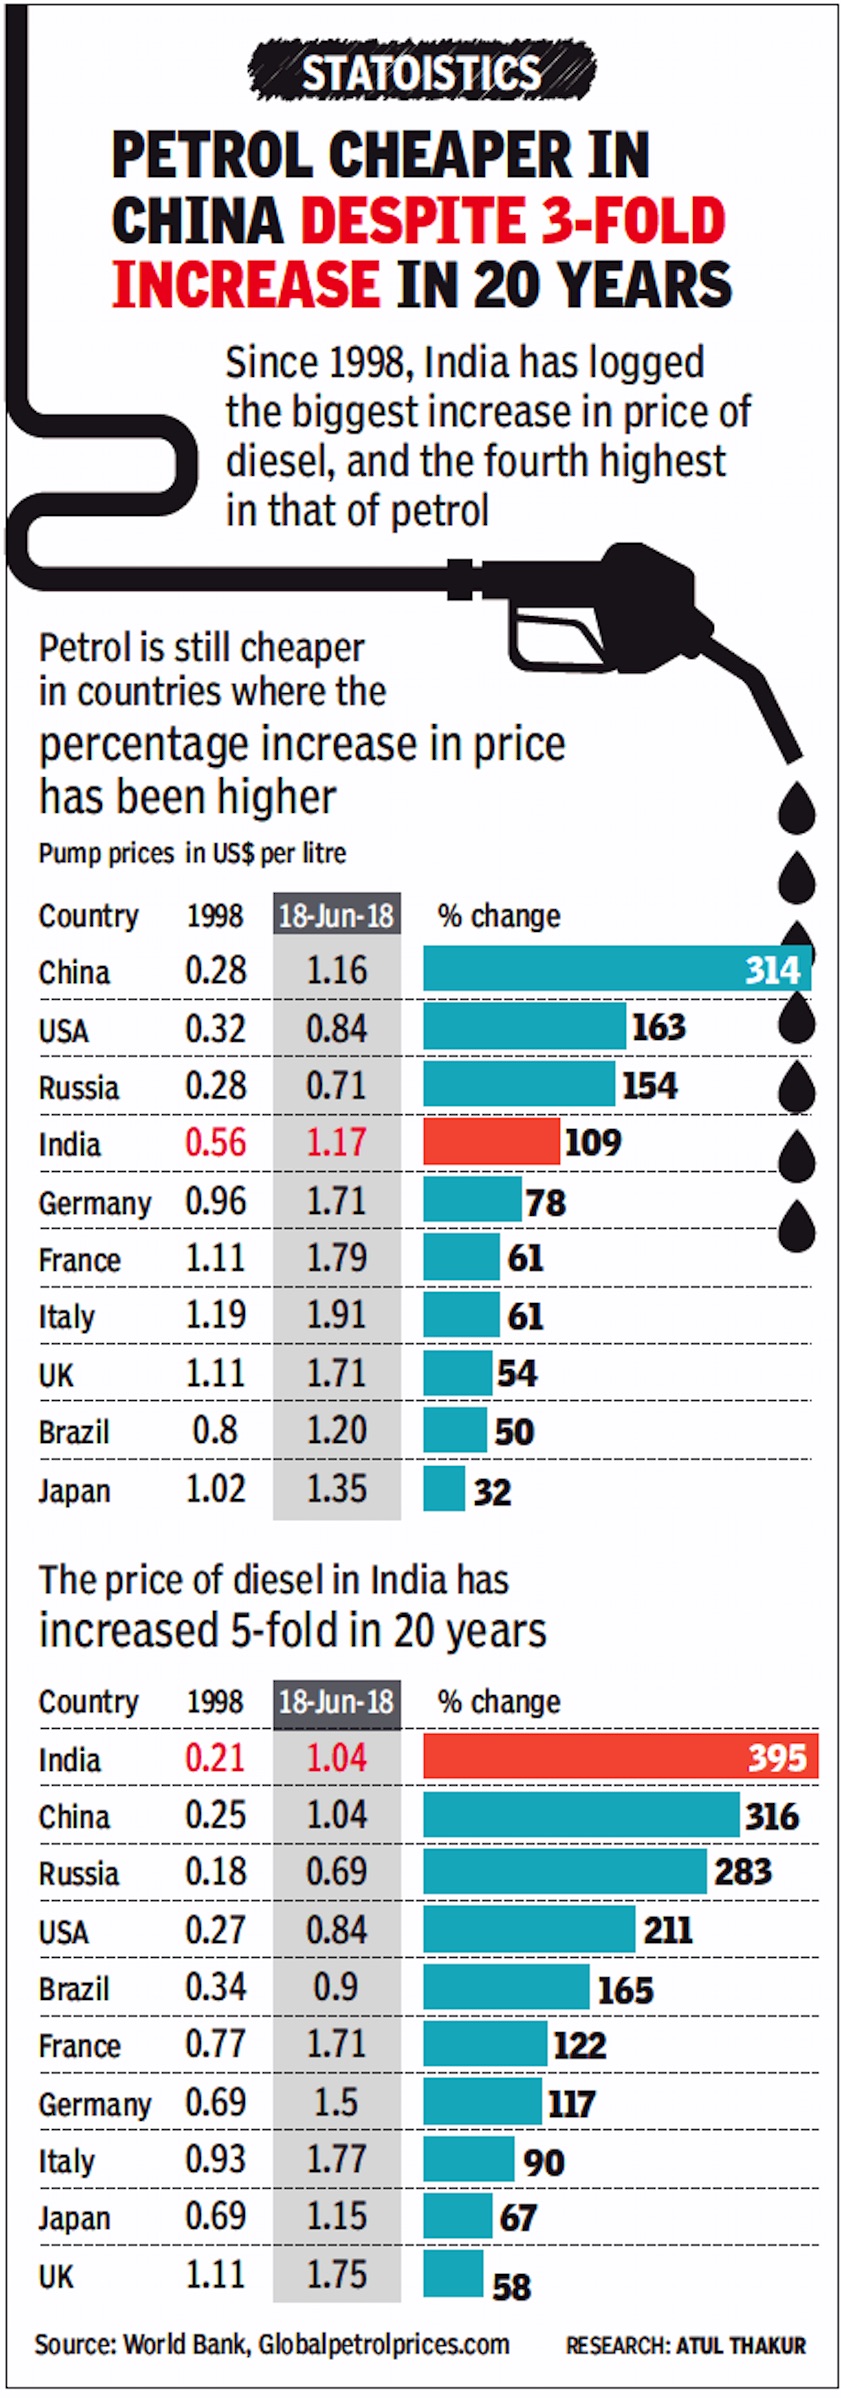
From: July 4, 2018: The Times of India
See graphic:
The prices of petrol and diesel in India, China and other major economies, in 1998 and 2018
Refining capacity
2018: India ranks 4th

From: August 13, 2019: The Times of India
See graphic:
Oil Refining capacity in India, Brazil, China, Germany, Iran, Japan, Russia, Saudi Arabia, S Korea and the USA, presumably as in 2018.
Production (of oil)
As in 2018

From: April 30, 2019: The Times of India
See graphic:
Production (of oil) in India, As in 2018
Refineries
RIL's Jamnagar unit

From: April 23, 2019: The Times of India
See graphic:
RIL's Jamnagar refining unit was, in 2019, among the world’s most complex
Reserves
Strategic petroleum reserves
June 28, 2018: The Times of India

From: June 28, 2018: The Times of India
HIGHLIGHTS
In its bid for long-term solution against global crude oil price volatility, India is looking towards caves that store oil
Called strategic petroleum reserves, these caves are aimed at providing buffer from external price and supply shocks
During the Gulf War in 1990, India was hit with a crisis so severe that the country was left with oil reserves adequate for just 3 days. Oil prices shot up alarmingly as a fall out of the war and triggered an inflationary spiral across the world and India could not escape the heat.
As the government's coffers bled heavily in buying high-priced crude, India's forex reserves came down to $1.2 billion at the end of April 1991. To put this into perspective, in the week ended June 15, the country's foreign currency assets stood at $410.07 billion.
Even though the forex reserves are nowhere close to the dismal state it saw in 1991, volatility in global oil prices and its vagaries may be tracked as recently as to the spike in petrol and diesel prices a few weeks back that sent the government scampering for policy changes.
In its bid for long-term solution, India is looking towards caves that store oil. Called strategic petroleum reserves (SPRs), these caves are aimed at providing buffer from external price and supply shocks.
India already has three underground storage facilities, built at the cost of Rs 4,100 crore that can store 5.33 million tonnes (MMT) of crude oil. The one in Visakhapatnam is already filled with 1.33 MMT of oil, another in Mangalore is filled to a fourth of its 1.50 MMT capacity, and the third in Padur, Karnataka, is built but awaiting oil for storage.
The cabinet has now approved two more SPRs -- a 4.4 million tonnes SPR at Chandikhol in Odisha and a 2.5 million tonnes facility at Padur in Karnataka.
The oil in the three SPRs already built can help meet 10 days of crude requirement, and the two planned ones can hold supply of about 12 more days.
Abu Dhabi company hires India's strategic storage
November 12, 2018: The Times of India
India signed an initial pact to lease out a part of its underground strategic oil storage at Padur in Karnataka to Abu Dhabi National Oil Co (ADNOC) for storing crude oil, the second such deal with the UAE firm this year, oil minister Dharmendra Pradhan said.
India has built 5.33 million tonne (MT) of emergency storage + -- enough to meet its oil needs for 9.5 days, in underground rock caverns in Mangalore and Padur in Karnataka and Visakhapatnam in Andhra Pradesh. It has allowed foreign oil companies to store oil in the storages on condition that the stockpile can be used by New Delhi in case of an emergency.
ADNOC had in February this year signed a pact to fill half of the 1.5 MT strategic oil storage + at Mangalore. On Monday it signed a similar pact for Padur.
"ISPRL (Strategic Petroleum Reserve entity of India) and ADNOC of UAE signed MoU to explore possibilities of ADNOC investment in filling up of crude oil in Padur + strategic reserve in Karnataka," Pradhan, who is in Abu Dhabi for the agreement signing, tweeted.
The agreement allows ADNOC to sell or trade crude oil storage in the storages to local refiners but give Indian government the first right to the oil in case of an emergency.
"ADNOC signs MoU with the Indian Strategic Petroleum Reserves Ltd (ISPRL), to explore storage of crude oil at Padur underground facility in Karnataka, which has a 2.5 MT (about 17 million barrels) capacity," the UEA firm tweeted.
Official sources said the pact followed the Cabinet's last week decision of approving filling up of the underground strategic oil storage at Padur by foreign oil companies.
While a third of the Visakhapatnam facility has been hired by Hindustan Petroleum Corp Ltd (HPCL), ADNOC and government of India filled the storage at Mangalore. The 2.5 MT Padur facility remained empty.
Allowing foreign companies to use the storage for storing crude oil helps the government save on the cost of filling the reserves. Law and IT Minister Ravi Shankar Prasad had after the Cabinet meeting on November 8 said that allowing foreign companies to store oil in Padur + would help the government save Rs 10,000 crore.
UAE Oil Minister Sultan al-Jaber said:"India is an important oil market and the agreement with ISPRL underscores the strategic energy partnership between the UAE and India that leverages the UAE and ADNOC's expertise and oil resources."
ADNOC in another tweet quoted Pradhan as saying that "the MoU with ADNOC will allow ISPRL to explore opportunities related to the possible storage of ADNOC crude at Padur, which would help to significantly strengthen the country's strategic petroleum reserves."
The ISPRL has constructed and commissioned underground rock caverns for storage of total 5.33 MT(around 39 million barrels) of crude oil at three locations -- Vishakhapatnam (1.33 MT), Mangalore (1.5 MT) and Padur (2.5 MT).
Padur storage has four compartments of 0.625 MT each and ADNOC may use half of the storage capacity for stocking its oil.
The total 5.33 MT capacity under Phase-I of the Strategic Petroleum Reserve (SPR) programme is estimated to supply about 9.5 days of India's crude requirement.
In Mangalore, it had agreed to stock 5.86 million barrels of 0.75 MT of oil.
In Phase-II, India plans to build an additional 6.5 MT facilities at Chandikhol in Odisha and Padur, which is expected to augment the emergency cover against any supply disruption by another 11.5 days.
Sources said oil firms like ADNOC could use the Padur storage to stock their oil and sell it to refineries in the region on commercial terms.
India, which meets 83 per cent of its oil needs through imports, will have the right of first refusal to buy the crude oil stored in the facilities in case of an emergency, they said.
Indian refiners maintain 65 days of crude storage, and when added to the storage planned and achieved by ISPRL, the Indian crude storage tally goes up to about 87 days. This is very close to the storage of 90 days mandated by IEA for member countries.
ADNOC had last year given up its crude storage lease in South Korea and instead agreed to store oil at Mangalore in a bid to establish a ground presence in the world's third-largest oil consuming nation.
Out of the crude stored, a part would be used for commercial purposes by ADNOC, while a major part would be purely for strategic purposes.
The Visakhapatnam facility can meet two-and-half days need while Mangalore can meet 2.8 days requirement. Padur can meet 4.7 days requirement.
The SPR at Mangalore consists of two compartments with a total storage capacity of 1.5 MT (11 million barrels). While one compartment has been filled with crude oil through funds made available by the government, the other compartment will be filled with crude supplied by ADNOC.
ADNOC hired the Mangalore storage just as it ended a contract to store 6 million barrels of crude oil at Korea National Oil Corp's Yeosu facility in the country's southwest coast.
South Korea had first right over the oil in the event of a supply emergency.
Why India is renting out its caves
November 13, 2018: The Times of India
India signed an initial pact to lease out a part of its underground strategic oil storage at Padur in Karnataka to Abu Dhabi National Oil Co (ADNOC) for storing crude oil. Padur storage has four compartments of 0.625 MMT (million metric tonnes) each and ADNOC may use half of the storage capacity for stocking its oil.
Allowing foreign companies to use the storage for storing crude oil helps the government save on the cost of filling the reserves.
"ADNOC is the only foreign oil and gas company, so far, to invest by way of crude oil in India's strategic petroleum reserves programme," an oil ministry statement said.
Caves of oil: They are called strategic petroleum reserves (SPRs). India has three underground storage facilities (built at the cost of Rs 4,100 crore) that can store 5.33 million tonnes of crude oil. The one in Visakhapatnam is already filled with 1.33 MMT of oil, deals to fill another 1.50 MMT capacity in Mangalore have been signed, and the third (with 2.5 MMT capacity) in Padur, Karnataka, is built but awaiting oil for storage. India also plans to build an additional 6.5 MMT facilities at Chandikhol in Odisha and Padur.
Caves on rent: India on Monday signed an initial pact to lease out a part of its storage at Padur to ADNOC, the second such deal with the UAE firm this year. It had signed a pact in February to fill half of the storage at Mangalore.
Why? The agreement allows ADNOC to sell or trade crude oil stored in these facilities to local refiners but it gives Indian government the first right to the oil in case of an emergency. Allowing foreign companies to store oil will help Centre save Rs 10,000 crore. The storage facilities are for India’s energy security, and to insulate us from external price and supply shocks. The oil in the three facilities already built can help meet 10 days of crude requirement, and the two planned ones can hold supply of about 12 more days.
What crisis? There was one during the Gulf War in 1990, when our oil reserves were adequate only for three days. Plus, others like US, Japan, China, UK and EU have it too.
The SPR caves
Why India wants investors to fill its caves with oil, October 13, 2018: The Times of India
Amid the volatility in the global crude prices, the government is planning to increase its capacity of oil reserves and is seeking investments from oil traders and producers.
Caves of oil: They are called strategic petroleum reserves (SPRs). India has three underground storage facilities (built at the cost of Rs 4,100 crore) that can store 5.33 million tonnes of crude oil.
Oil in caves: The one in Visakhapatnam is filled with 1.33 MMT of oil purchased by the government, another in Mangalore (with 1.50 MMT capacity) has been half-filled by the government and another half leased to Abu Dhabi National Oil Co, and the third in Padur, Karnataka, is built but awaiting oil for storage.
Dig some more: Cabinet early this year approved two more SPRs: a 4.4 million tonnes SPR at Chandikhol in Odisha and a 2.5 million tonnes facility at Padur in Karnataka.
What now?
Centre is seeking $1.5 billion in investments from global oil producers and traders to build the two additional reserves. It plans to hold roadshows in New Delhi, Singapore and London this month to draw investors. Getting private investors will lessen the financial burden on the government.
Private or public?
While the oil will be filled by private companies, India will reserve the first right over the crude. Government-owned Indian Strategic Petroleum Reserves Ltd (formed in 2006) will collaborate with private entities to invest in the project.
Why?
For India’s energy security (we import 85% of our crude needs), and to insulate us from external price and supply shocks. The oil in the three SPRs already built can help meet 10 days of crude requirement, and the two planned ones can hold supply of about 12 more days.
What crisis?
There was one during the Gulf War in 1990, when our oil reserves were adequate only for three days. Plus, others like US, Japan, China, UK and EU have it too.
Taxes
2014-21
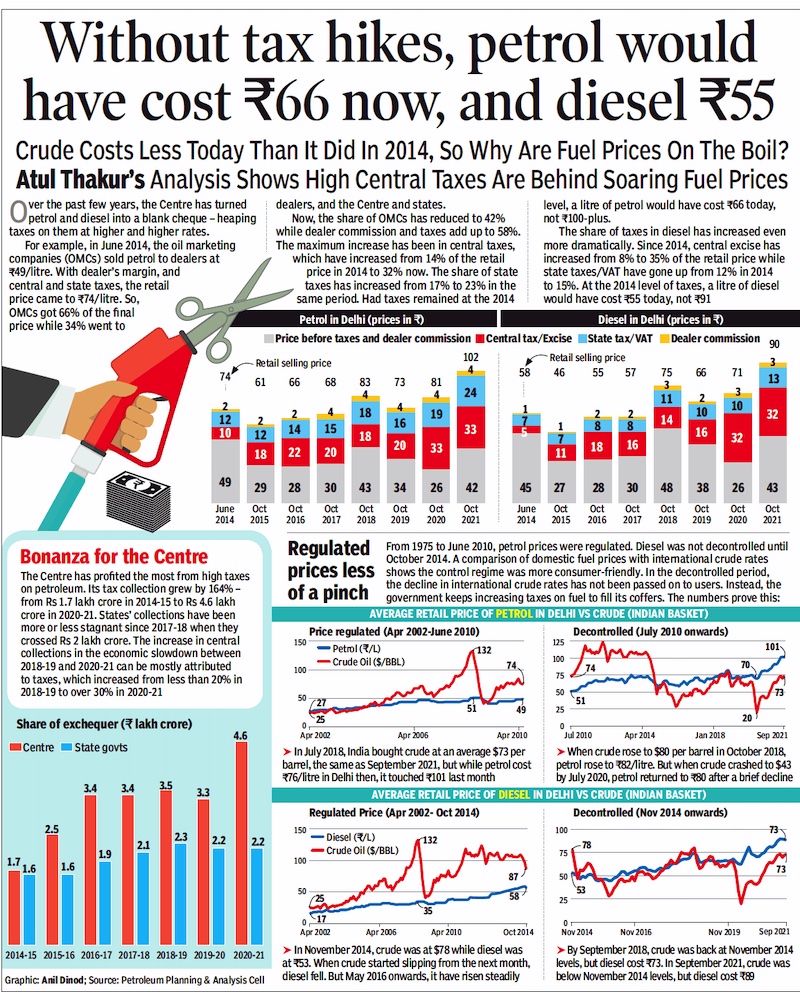
From: Oct 15, 2021: The Times of India
See graphic:
Taxes and petrol prices in India, 2014-21
2017

From The Times of India, October 5, 2017
See graphic, Taxes on petrol and diesel in some selected states, 2017
2017-2020

From: July 7, 2020: The Times of India
See graphic:
Taxes on petroleum products in India, 2017-2020.
See also
Petroleum, diesel, kerosene, India: I
Petroleum, diesel, natural gas, India, II (ministry data)

