Employment, unemployment: India
This is a collection of articles archived for the excellence of their content. |
A: EMPLOYMENT/ UNEMPLOYMENT STATISTICS
Employment creation
Employment trends
1983- 2022
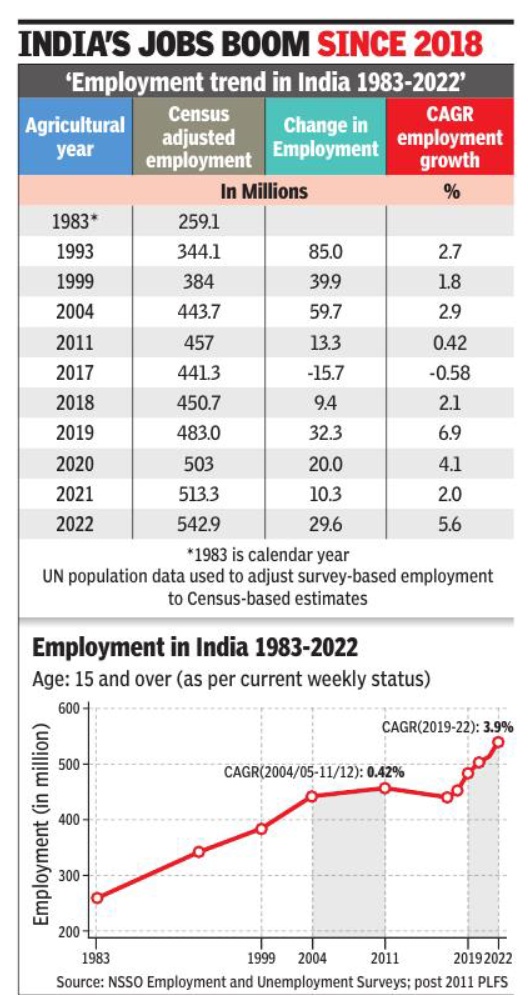
From: Surjit S Bhalla & Tirthatanmoy Das, March 20, 2023: The Times of India
See graphic:
Employment trends in India, 1983- 2022
The State of Working India 2023
Sep 25, 2023: The Times of India
India’s bounce-back from the pandemic’s economic fallout was fast and sharp. In 2021-22, not only had the GDP of ₹149.25 lakh crore risen 9.1% over the previous year, it had also surpassed the preCovid level. Employment however has been a different story. Azim Premji University’s State of Working India 2023 draws together employment-related data from different GOI reports to show that the resilience of the job market, particularly for women and young graduates, has lagged that of the overall economy.
On the surface, one of the highlights of the employment data has been a sharp rise in both men and women working in the post-Covid phase and a simultaneous decline in the unemployment rate. The unemployment rate in 2021-22 was 6.6%, over two percentage points lower than the same in 2019-20. The upward trend in women’s employment has been notable. However, a fine-grained analysis by SWI 2023 report showed that there’s been a structural deterioration in the nature of women’s employment. The jump in women’s employment has been driven by self-employment, particularly in the category of unpaid work. Self-employment is generally a fallback option, which suggests that the job market for women may have worsened.
This is corroborated by the inflation-adjusted monthly earnings of the self-employed over the last five years. For sure, the monthly earnings are higher than both 2019-20 and 2020-21. But the monthly earnings of ₹12,089 in 2021-22 was lower by 2% than the same in 2017-18, the year GOI began to present annual employment data. There’s economic stress underlying the increase in women’s participation in the labour force. Little surprise then that political parties are rushing to tailor fiscal policies to provide monthly income support to women in different states. Youth unemployment has long been an area of concern. SWI showed that unemployment for highly educated job seekers (graduates and above) was over 20% till the age of 29. Subsequently, it collapses fast which does raise questions about the quality of jobs.
For decades, India’s structural transformation in the job market has lagged the growth in GDP. The term ‘jobless growth’ is shorthand for the lack of correlation between growth of GDP and employment. This phenomenon appears to have worsened for women in the post-Covid phase. It’s something that deserves more attention as the contribution of women is critical if India wants to be a developed economy.
Caste and employment
Udit Misra, Oct 5, 2023: The Indian Express
From: Udit Misra, Oct 5, 2023: The Indian Express

From: Udit Misra, Oct 5, 2023: The Indian Express

From: Udit Misra, Oct 5, 2023: The Indian Express

From: Udit Misra, Oct 5, 2023: The Indian Express

From: Udit Misra, Oct 5, 2023: The Indian Express
Some Basics on Employment Metrics
There are three variables that one needs to look at when talking about employment in India.
One is the Labour Force Participation Rate (LFPR). Simply put, it gives a sense of how many Indians are “demanding” a job.
The “Labour Force” consists of persons who are of 15 years of age or more and are either of the following two categories:
1. are employed
2. are unemployed and are willing to work and are actively looking for a job
The LFPR is expressed as a percentage of the working-age population.
The second variable is Unemployment Rate (UER). It is nothing but the number of people in the labour force who are looking for a job but as yet unemployed. The UER is expressed as a percentage of the labour force.
Don't miss | Why everyone’s counting on the Census — and why a delay hurts
In everyday parlance, the unemployment rate often dominates the general public discourse. However, in India’s case, the UER often underestimates the joblessness because the LFPR itself keeps falling.
Simply put, it has been found that if they do not get a job over time, a lot of unemployed people get discouraged and leave the labour force (that is, stop actively looking for a job). With unemployed people leaving the labour force, the ratio of unemployed to total labour force falls. As such, often in India, the UER falls not because more people have got jobs but because the LFPR itself falls (that is, when more people — who failed to get a job — stop looking for a job altogether).
As such, the best metric to look at is Employment Rate (ER). The ER dispenses with the labour force calculation and simply looks at the total number of people employed as a percentage of the working-age population. By not basing itself on LFPR, the ER avoids the problem of a falling LFPR artificially dragging the unemployment rate.
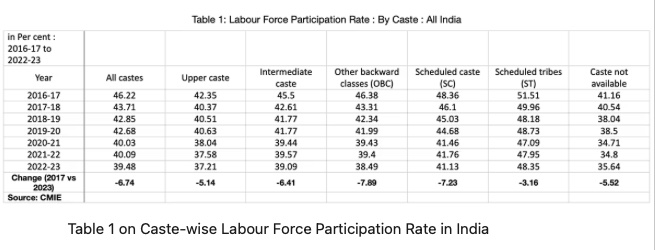
Caste-wise LFPR
Table 1 gives the details of caste-wise LFPR since the start of the 2016 financial year. Apart from the well-known groupings, the intermediate castes grouping refers to castes such as Marathas, Jats, Gujjars, and others who often aspire to be included in the OBC category.
Table 1 on Caste-wise Labour Force Participation Rate in India
The data shows some very clear trends.
One, LFPR has fallen for each caste. If one ignores the data for the category for which caste was not available, then the LFPR of the so-called upper castes is the lowest among all other castes; it is 37.21%. In other words, the demand for jobs is the lowest among the upper castes.
Two, the biggest fall in LFPR since 2016, however, has been among OBCs and SCs. In other words, people belonging to these two caste groupings have been the worst affected by the negative trend of India’s LFPR.
Caste-wise Unemployment Rate
Table 2 shows the UER for each caste group.
The UER has remained persistently high for India. Moreover, notwithstanding India’s economic recovery, it was higher in the last financial year (2022-23) than six years ago.
Table 2 on Caste-wise Unemployment Rate in India
This is true for all caste groups barring the OBCs, for whom the unemployment rate has fallen marginally. That UERs are higher despite LFPRs falling points to the more worrying trend — that UER is higher even when the proportion of people demanding a job has come down.
As far as the fall in the UER for OBCs is concerned, it has happened as the LFPR for them has witnessed the biggest fall among all caste groups.
Caste-wise Employment rate
TABLE 3 best captures the combined reality of falling LFPR and high UER for each caste category. This table provides the Employment Rate and as the table shows, the ER has fallen for each and every caste group.
Table 3 on Caste-wise Employment Rate in India
In other words, the proportion of people belonging to a particular caste in the working-age population who are employed has been coming down for every caste.
Again, while the upper castes have the lowest employment rate, the biggest drop in ER has been witnessed among OBCs and SCs.
Religion-wise Employment rate
Reportedly, the Bihar caste survey looked at caste across religious identities as well. In other words, it categorised non-Hindus (such as Muslims) into different castes.
As such, it might be relevant here to look at the religion-wise employment rates as well.
Table 4 on Religion-wise Employment Rate in India
Table 4 throws up a very interesting result: Among the main recognised religions, it is the Hindus who have suffered the biggest fall in employment rate between 2016-17 and 2022-23 even as the Jains have the lowest employment rate.
Caste-wise consumer sentiments
Table 5 maps the absolute levels of CMIE’s index of consumer sentiments for each caste. According to CMIE, the main aim of the Consumer Sentiments Index is to measure perceptions and expectations accurately so that the business community can understand the mood of the consumer and anticipate changes in the same.
Table 5 on Index of Consumer Sentiments in India
For one, the data shows that the consumer sentiments for almost all caste groups are 20% to 25% below their 2016-17 levels. The lowest levels of consumer sentiment were for the OBCs. However, the worst affected were the intermediate castes — the castes who aspire to be included in the OBC category.
The main sectors
The Times of India, Sep 11 2016
Subodh Varma
The retail-friendly Indian: A shop for every 15 families
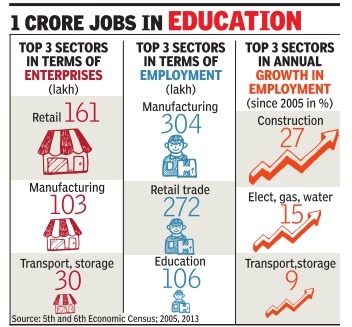
Indians continue to show their entrepreneurial spi rit -by opening more and more shops. With over 1.6 crore retail shops in the country -about one for every 15 families -this sector of work outguns every other.
Manufacturing, considered the backbone of prosperity for any economy , is second to retail with over 1 crore units. But manufacturing employs over 3 crore people beating retail trade, which has about 2.7 crore.
Transport companies, warehousing, hotels and eateries, and healthcare-related enterprises are other major occupations, while educational enterprises have emerged as major employers with over 2 million such businesses employing nearly 1.1million people.
These facts emerge from the 6th Economic Census con ducted by the government in 2013, detailed results of which were released earlier this year. The economic census counts all kinds of enterprises across the country except cultivation of crops and their ca re and protection. In this census, some 5.8 crore enterprises were counted, employing over 13 crore people. The previous one was done in 2005. The sector that has really boomed is construc tion, with employment growing at 27% per year. This is 2013 data so it will not reflect subsequent travails of the sector. Trade is in itself arguably the biggest employer if one adds up wholesale trade and sale and repair of motor vehicles which the census counted separately .
Putting all three together one gets about 1.8 crore enterprises employing 3.2 crore people, nearly 35 percent of all non-agricultural and non-extractive industries. This picture of a bustling economic hive with vast numbers involved in diverse enterprise building needs to be tempered with some economic cold water. Nearly 96% of all enterprises employ one to five workers, with just 1.4% employing more than 10 workers.
Compared to 2005, the share of enterprises in the 1-5 category has marginally increased. This indicates the atomised and dispersed nature of entrepreneurial activity, which, especially in the case of manufacturing, speaks of a rather low economic level. Of the three cr manufacturing enterprises, about a third, that is one crore, are working without any hired worker.
Economists have suggested earlier that retail trade is in fact a last resort for families seeking to boost incomes by selling a few items in villages or weekly haats. This transient nature of retail trade seems to be confirmed by the fact that 25% of these establishments are run from within homes and 17% are run without any fixed structure.
2013-17: professionals’ employment grew fastest in technology

From: Shilpa Phadnis & Avik Das, Fastest growing jobs in tech: Survey, September 6, 2018: The Times of India
The top five — as also eight of the top 10 — fastest growing jobs for professionals in India are in technology, according to an analysis by LinkedIn, the world’s largest professional networking site.
The report is based on an analysis of data between 2013 and 2017 of the millions of LinkedIn members in India. It bolsters the idea that the country’s job market is making a seminal shift from the traditional engineering jobs to more niche ones requiring new skill sets. Just half a decade ago, the most prominent titles were software engineer and senior business analyst.
“In India, many businesses are shifting focus and resources to big data and digital products. Leaders across BFSI (banking, financial services & insurance), manufacturing, media & entertainment, professional services, retail & consumer products, and technology-software are looking at technology to drive scale, efficiency and growth. So machine-learning engineers and data scientists find themselves in massive demand,” the report said.
The report by LinkedIn, which is part of Microsoft, also shows that when it comes to qualifications for machine-learning and data scientist jobs, more than half the new workforce has just a basic bachelor’s degree — implying that companies train them on the job. Firms find it difficult to get highly qualified students who are industry-ready. In comparison in the US, roughly 17% of new graduates who take these jobs hold a doctoral degree — which would command a fatter pay cheque.
2016, Apr-Sept: 0.5% jobs added in 8 key non-farm sectors
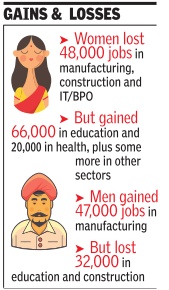
Just over one lakh jobs were added between April 1 and October 1 last year in eight key non-farm sectors of the economy ranging from manufacturing and construction to ITBPO, education and health, according to a recent government report. Is this good or bad?
Considering that these eight sectors together employ over two crore workers, the net addition of new jobs amounts to a mere half a per cent of the total. So, it's bad news for the economy and another red flag for the government. The report in question is the third quarterly employ ment report, which was revamped by the government last year with new sectors included and a larger sample size of over 10,000 establishments.
The first report, released last year, set the baseline of employment as on April 2016. The report shows that employment is not only inching up at a painfully slow pace but also that aggregate figures hide more severe upheavals. For instance, almost three quarters of 1.09 lakh new jobs added are confined to two sectors -education and health, which added 82,000 new jobs. But the most worrying thing is manufacturing jobs grew by just 12,000 in six months -a rise of 0.1%. This sector, the backbone of the non-farm economy , employs nearly 50% of workers in the selected eight sectors. It has been the focus of the `Make in India' and `Skill India' programmes, as also of efforts to woo FDI. The Index of Industrial Production (IIP), re leased monthly by the government, confirms this dire situation with a rise of a mere 1% between January 2015 and January 2017.
According to latest data from the RBI, the same period saw gross bank credit to industries increasing by a mere 0.3%. This includes credit disbursals to micro, small, medium and large industries and together makes up nearly 40% of all non-food credit. The meager increase in credit to industry is a symptom of the flagging growth in manufac turing, which is also reflected in lack of job growth.
Further confirmation comes from second advanced estimates of national income and expenditure released by the government last month. Growth in investment in fixed capital known as gross fixed capital formation dipped by a factor of 10 between 2015-16 and 2016-17 from 6.1% to a shocking 0.6% in 2016-17. This implies that the corporate sector is not investing in new production arrangements.
Growth in gross value added (GVA) at basic prices -a measure of actual production -has slipped from 7.8% in 2015-16 to 6.7% in 2016-17.
2016-17: increase in some sectors, decrease in others
From: 87k jobs lost in mfg, but net addition of 64k in 8 core sectors: Govt data, February 20, 2018: The Times of India
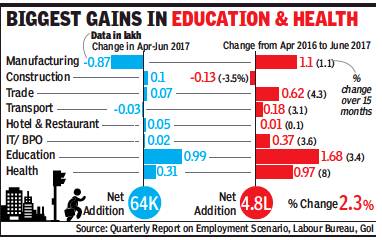
Creating non-farm jobs remains a huge problem, with the government’s latest quarterly survey on employment in eight key sectors revealing that there’s been a net addition of just 64,000 jobs across these sectors between April and June last year. Even more worryingly, the manufacturing sector lost 87,000 jobs over this period, indicating that Make in India remains a distant dream.
The labour bureau’s quarterly survey shows that the education and health sectors between them added 1.3 lakh jobs in April-June 2017, while the other six sectors — manufacturing, construction, trade, transport, accommodation& restaurants, and the IT/ BPO industry — put together saw a net loss of 66,000 jobs.
Education was by far the biggest job creator, adding 99,000 jobs over this quarter. Health saw an addition of 31,000 jobs. The survey, which in its current format has been running since April 2016, covers both regular and casual employment as well as the selfemployed in these sectors.
Since April 2016, there has been a net addition of 4.8 lakh jobs in these eight sectors with over half from education (1.7 lakh) and health (1 lakh). That translates to a 2.3% growth in employment over 15 months, an annualised growth rate of barely 1.8%. This rate is not enough to even take care of new entrants to the job market each year, leave alone reducing unemployment.
Of 64k jobs in 2 mths in 2017, 51k went to women
The increase in employment in the manufacturing sector, the focus of the Make in India programme, is an even lower 1% over the 15-month period.
One positive spin-off of most new jobs being in the education and health sectors is that women have gained more than men. Of the net 64,000 new jobs created in April-June last year, 51,000 went to women and 13,000 to men.
Over the 15-month period since this survey began, however, female employment in these sectors has risen by a little over 2.1 lakh while male employment has gained about 2.7 lakh.
2018: legal, education sectors hire professionals aggressively
Legal, edu most dynamic in hiring, October 11, 2018: The Times of India

From: Legal, edu most dynamic in hiring, October 11, 2018: The Times of India
The legal and education sectors were the most dynamic in terms of hiring of professionals in the first half of 2018, according to the first edition of LinkedIn’s Workforce report for India. The study also found that software engineers were in demand by almost every industry, and that Kalyan, near Mumbai, was the region that attracted the most number of migrant professionals, followed by Bengaluru and Gurugram.
To measure the dynamism of sectors, LinkedIn looked at what it calls a net transition score — the difference between the total number of members who transitioned into the industry (from other industries), and the total that transitioned out. LinkedIn said the growth in the legal and education industries was driven by traditional roles such as associates, lawyers and researchers for the former and teachers and research assistants for the latter. “But what’s interesting is that these two industries, as also other industries, are active in hiring software engineers, application developers and those type of roles. It’s a requirement for digitisation of their businesses,” said Olivier Legrand, managing director, Asia Pacific and Japan, LinkedIn.
LinkedIn analysed the vast set of data on its India platform, including the 50 million member profiles, 50,000 skills, and 1 million company pages, for the period from January to June this year. The company will do such studies for every half year.
Design, recreation & travel, manufacturing, and nonprofits also drew significant numbers of professionals from other industries Kalyan emerged as the most in-demand migration corridor. LinkedIn defines indemand migration corridor as the movement of professionals into the top-10 most posted jobs of the destination region. In Kalyan, the movement was driven by the retail industry. Bengaluru was at No. 2, with the majority of migrants coming from Chennai, Hyderabad, Mumbai and Delhi, in that order.
Among the most sought-after occupations, software engineers are in pole position, followed by solutions consultants, Java software engineers and business analysts. The job posts for software engineer were highest in 8 of the 14 cities included in the study.
2018> 2019: The main sectors
August 17, 2019: The Times of India
From: August 17, 2019: The Times of India
See graphic:
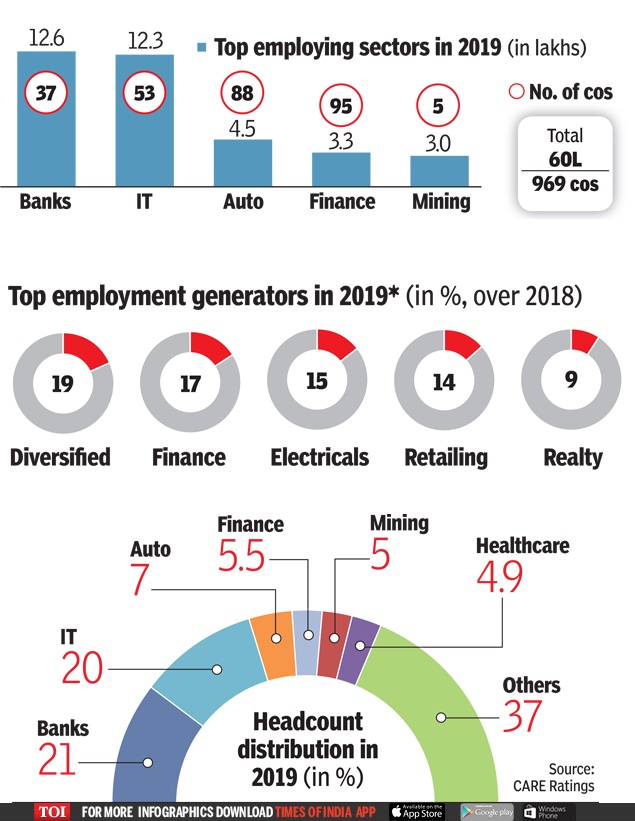
The top employing sectors in 2019
A slowdown in the economy has begun to impact jobs, especially in the auto sector. However, Indian banks and IT firms contribute 41% of organised sector’s jobs, with the auto industry accounting for over 7%, says a study. The study, which covered 969 companies and three fiscals from FY17 to FY19, also showed that total jobs for the sample increased 6.2% in FY18, but far lower at 4.3% in FY19. Here's a look.
2020: Life sciences top draw for talent
Namrata Singh & Rupali Mukherjee, January 4, 2021: The Times of India
From: Namrata Singh & Rupali Mukherjee, January 4, 2021: The Times of India
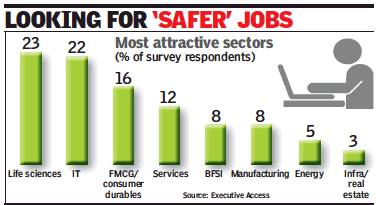
For the first time perhaps, life sciences has emerged as the most preferred sector that is predicted to attract talent, ahead of IT and FMCG, this year.
In a survey by Executive Access, done exclusively for TOI, 23% of 261 CXOs across industries and geographies picked life sciences as the most attractive sector for talent. It is followed by IT (22%) and FMCG/consumer durables (16%). Candidates are increasingly looking for safer industries for work — those which witness minimum volatility and are insulated from the vagaries of the economy.
Ronesh Puri, managing director, Executive Access (India), said: “In 25 years, I have not seen life sciences topping the charts on being a talent attractor. Clearly, priorities have undergone a change for job-seekers. Candidates now prefer jobs that are meaningful and have potential to add value to society.” Given that Covid-19 has had a deep impact on the mindset of people, Puri said the thinking has also undergone a change. “Anecdotally also, people have come to us and said they want to work in the life sciences sector,” Puri said.
Healthcare may continue to attract talent, hospitality likely to take a hit
They find it to be more meaningful as it’s something that is protecting their loved ones. People look at purpose when they want to join an organisation. Prior to Covid, sectors like FMCG, IT and BFSI attracted the best talents. IT is seen as a sector that has changed the way we work, and is the second best after life sciences. FMCG too is insulated and would continue to be a talent magnet,” said Puri.
Pankaj Patel, chairman Zydus Group, said there will be tremendous opportunities for growth in the healthcare and life sciences sector in the decade that has just begun. Healthcare and life sciences has been a top contributor to the economy as well, and is expected to see breakthroughs in therapeutics, biologicals, vaccines and diagnostics. Patel said India will be at the forefront driving these possibilities globally, both in terms of research and innovation as well as manufacturing. “This is a sector which has always been driven by knowledge, technology and skills and there will be a greater demand in the coming decade for young talent. Opportunities will open up for researchers, scientists, technologists and skilled professionals as the Indian healthcare industry continues to innovate, digitalize operations and explore newer technologies and tools like AI,” said Patel.
Sudarshan Jain, secretary general of Indian Pharmaceutical Alliance, said given that healthcare will be a high priority area for India, the sector will attract talent and it will be a satisfying arena to make a difference and contribute both to society and professional growth.
On the other hand, hospitality is predicted to take a dip in attracting talent, at least in the immediate aftermath of Covid-19. The long term attractiveness of the hospitality industry may pick up as travel normalises. It is clear that the industry is vulnerable to global crises and this may cause a talent exodus, according to the survey.
Other than the sectors of choice, candidates are also changing their preferences for the kind of organisation they would like to work with.
From a talent perspective, more than a quarter of the respondents still place job security at the forefront even as the economy slowly bounces back. However, some of the respondents are seizing the opportunity to look at new roles that would provide growth (19%), flexibility of remote working (18%) and job satisfaction (17%). Salary and compensation (money) now appears to have taken a backseat.
2015-20: Employment creation by govt. schemes
February 19, 2020: The Times of India
From: February 19, 2020: The Times of India

From: February 19, 2020: The Times of India
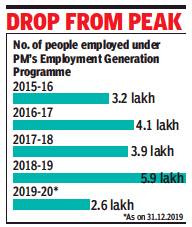
Some of the government’s flagship employment generation and placement schemes, such as the PM’s Employment Generation Programme (PMEGP) and Deendayal Antyodaya Yojana-National Urban Livelihoods Mission (DAY-NULM), are expected to see a steep decline in job creation during the current fiscal, going by data tabled in Parliament.
According to details provided by minister for labour and employment Santosh Kumar Gangwar, the number of jobs generated under PMEGP plummeted from about 5.9 lakh in 2018-19 to about 2.6 lakh in 2019-20 (until December 31, 2019). The fall is less sharp compared to 2017-18 when the number of persons benefited was 3.9 lakh.
PMEGP: Assam and J&K post sharpest dip in jobs growth
PM’s Employment Generation Programme is a credit-linked subsidy programme run by the ministry of micro, small and medium enterprises with Khadi and Village Industries Commission as the nodal agency for implementing the programme at the national level. The 2019-20 PMEGP figures are the lowest yet, since the NDA government assumed office in 2014.
Government data pointed to a steep decline in placement of people skilled under DAY-NULM, from 1.8 lakh in 2018-19 to a little over 44,000 in current fiscal, according to data until January 27, 2020. As with PMEG, 2018-19 saw a higher number than 2017-18 (115,416) and 2016-17 (151,901). The sharpest decline in job generation under PMEGP is in Assam and J&K. The DAYNULM drop was most drastic in states like Gujarat and MP.
Government data on the Mahatma Gandhi National Rural Employment Guarantee Schemeshows a slowdown in 2019-20 with persondays generated falling from 26,796 in 2018-19 to 20,577, lowest since 2015-16. Again, the fall is less drastic compared to persondays in 2017-18 (23,373) and 2016-17 (23,565). The pace of skilling and placements under the Deen Dayal Upadhyaya Grameen Kaushalya Yojana (DDU-GKY) also declined with the number of persons trained falling from 2.4 lakh to 1.74 lakh, and the number getting jobs declining from 1.35 lakh in 2018-19 to 1.1 lakh this year. Here too 2018-19 stands out as high performing compared to previous years.
Employment provided by central public sector enterprises
See Employment, unemployment: India
2016: Economy grew 7%, jobs 1%
Subodh Varma, Economy growing at 7%, jobs at 1%, May 19, 2017: The Times of India
Labour Bureau Report On Non-Farm Sector Highlights Growing Joblessness
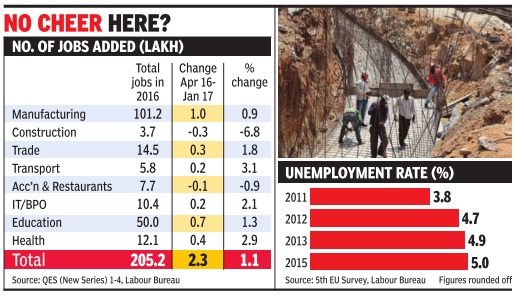
While the economy is growing at just over 7% per year, jobs increased by just 1.1% in 2016, according to a recently-released report covering eight key sectors of the non-farm economy . An earlier report had pegged joblessness at a fiveyear high of 5% in 2015, and under-employment at a staggering 35% of the over-15 years labour force. Seen in this context, the government is facing a growing employment crisis which its various initiatives are unable to address.
Both reports are based on large surveys carried out by the Labour Bureau. Job growth is tracked by a revamped quarterly survey of over 10,000 units while unemployment is recorded in an annual survey of 7.8 lakh people. The new quarterly survey started in April 2016 and replaced an earlier one which covered certain export-oriented sectors.
Providing decent jobs was one of the most popular promises which swept the Modi-led BJP to office in 2014 and helped it win several state elections.
Most recently, Yogi Adityanath too had promised to address the jobs situation in UP after being anointed the chief minister following BJP's dramatic victory in the state assembly elections.UP itself has an estimated 1 crore unemployed, according to the report. Recent reports of several IT and BPO majors shedding jobs have added to the worries of people, especially urban middle-class families which had been riding the IT boom. Global slowdown in IT services and components and new visa restrictions are thought to be behind this.
Several other indicators explain this painful situation. Gross credit given to industry has grown by just 6.7% in the past three years, the index of industrial production has inched up by just 6% and growth in gross fixed capital formation slipped to an alarmingly low 0.6% in January this year compared to 6.1% in 2016
A total of 2.3 lakh jobs were added to the eight sectors covered in the quarterly survey including manufacturing, construction, trade, transport, accommodation and restaurants, ITBPO, education and health.
Nearly half of the new jobs added were in education and health. Both these sectors are known for low paying jobs. Construction and the hospitalityfood sectors showed loss of jobs, the most serious ones, amounting to a dip of nearly 7%, is in construction.
One usually neglected aspect of India's unemployment crisis is of under-employment or concealed unemployment. This is of two types -not finding work for full year and work at very low wages. The Labour Bureau's 2016 report on unemployment paints a dire picture of both fronts.
Only 61% of people in the workforce were found to have year-round jobs with 34% working only 6-11 months even though they were willing to work for 12 months.
The report also revealed that 68% households were earning only Rs 10,000 per month or less. In all, nearly 16 crore people in the workforce were under-employed in this manner.
2016-17: jobs grew at 2%
Country’s organised sector created 4 lakh jobs in ’16-’17, December 31, 2017: The Times of India
From: Country’s organised sector created 4 lakh jobs in ’16-’17, December 31, 2017: The Times of India
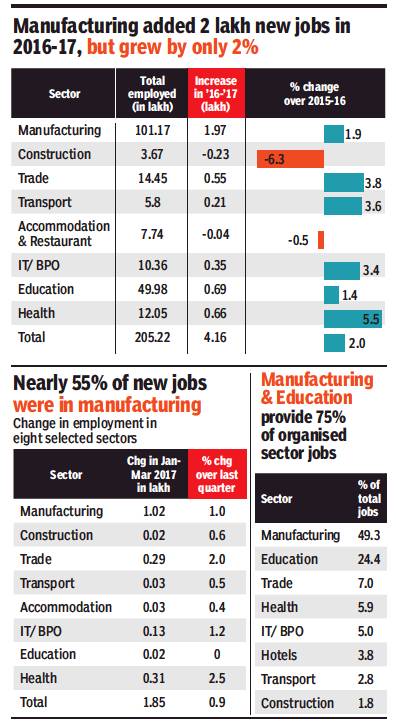
2% Growth In New Jobs, Mfg Accounts For Nearly 50%
India’s organised sector created a little over 1,100 jobs a day in 2016-17 which totalled up to 4.16 lakh new jobs for the entire year. The rate of job creation was 2% higher than 2015-16. Last quarter of 2016-17, the hardest hit by the demonetisation, saw much higher job creation than the previous three quarters of the year, claims the quarterly report on employment scenario, released by the labour ministry. Nearly 45% of the total jobs created during the year were generated between January and March 2017.
Overall, the spell of low growth that casts a shadow on India’s economic performance, especially since the 1990s, continues. India has been adding about 8 lakh workers to its labour forceevery year, implying that organised sector absorbed only about50% of newworkers who seekemployment. However, the survey doesn’t reflect the overall employment situation in the country. It covers only the organised sector (establishments employing 10 or more persons) identified by Sixth Economic Census (2013-14). The census counted 58.5 million establishments of which only 1.4% came under organised sector.
Nearly half—47.4%--of the 4.16 lakh jobs created in 2016-17 were generated by the manufacturing sector. Education and health that accounted for 32% of the new jobs. An analysis of sectorwise change in employment shows that job market in health sector saw the largest expansion where 5.5% more people were employed on April 2017 as compared to April 2016. Health was followed by trade, transport and IT/BPO--each growing by over 3%. Together, these four sectors account for 21.3% of total employed people on April 2017. Construction and accommodation & restaurant industry saw a 6.3% and 0.5% decline in employment.
One encouraging finding of the survey was 87% of new job creation by employers. Self-employment constituted only 12.7% of the over four lakh jobs added in the financial year. peculiarity of India’s job market is the presence of large underemployment which disguises unemployment. Without a regular job and any unemployment benefit a large part of Indians classified as self-employed actually barely make a living. It is in this context that new job creation under by employers, rather than through self-employment, is a positive trend.
A gender-wise analysis shows 60.8% of new jobs were taken by men whilewomen got 39.2% of the newemployment.
2016-2018: 50 lakh men lost jobs
5m men lost jobs since 2016: Report, April 17, 2019: The Times of India
The State of Working India (SWI) 2019 report, released by the Bengaluru-based Azim Premji University has said that five million men lost their jobs between 2016 and 2018. The beginning of the decline in jobs coincides with demonetisation in November 2016, although no direct causal relationship can be established based only on these trends, adds the report.
The report has also found that in addition to rising unemployment among the higher educated, less educated workers have also seen job losses and reduced work opportunities since 2016.
The report on India’s labour market is based on the Consumer Pyramids Survey of the Centre for Monitoring the Indian Economy (CMIECPDX). CMIE is a Mumbaibased business information company with an independent think tank. This survey is an ongoing nationally representative panel survey of around 1.6 lakh households and 5.22 lakh individuals, conducted every four months.
“In the absence of official numbers from the Periodic Labour Force Survey (PLFS), the only other household survey available for us to take stock of the employment situation is the Consumer Pyramids Survey of the Centre for Monitoring the Indian Economy (CMIE-CPDX),” said Amit Basole, associate professor at Azim Premji University.
Rising unemployment among less educated
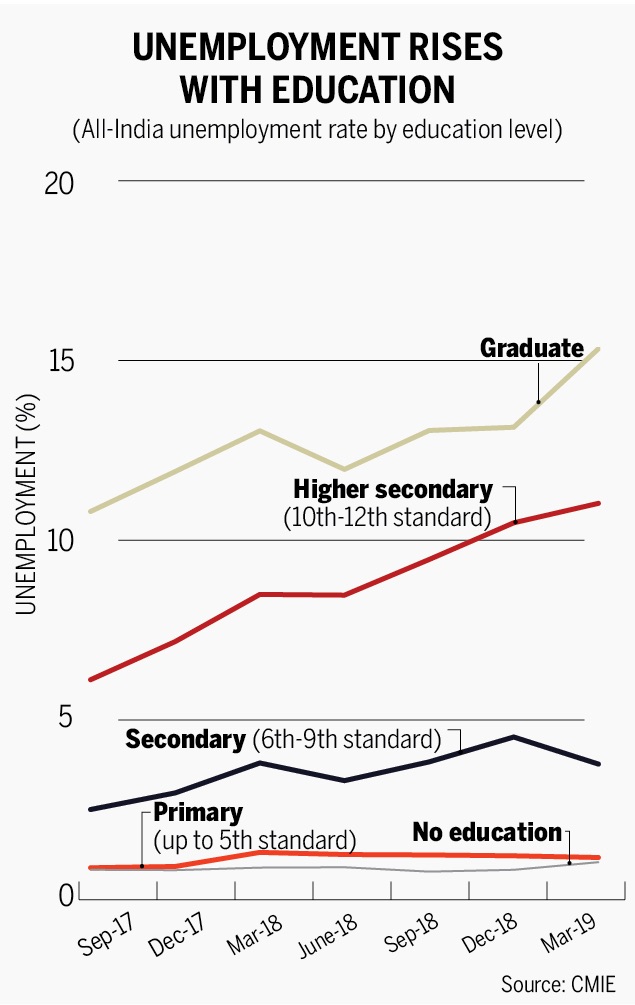
The report says that unemployment has risen steadily post 2011. “The overall unemployment rate to be around 6% in 2018, double of what it was in the decade from 2000 to 2011. In addition to rising open unemployment among the higher educated, the less educated (and likely, informal) workers have also seen job losses and reduced work opportunities since 2016”.
Women affected more
Among urban women, graduates are 10% of the working age population but 34% of the unemployed. The age group 20-24 years is over-represented among the unemployed. Among urban men, this age group accounts for 13.5% of the working age population but 60% of the unemployed. In general, women are much worse affected than men. They have higher unemployment rates as well as lower labour force participation rates.
2017-18: EPFO enrolments rise, suggest healthy job growth
Payroll data shows healthy job growth, April 27, 2018: The Times of India
From: Payroll data shows healthy job growth, April 27, 2018: The Times of India
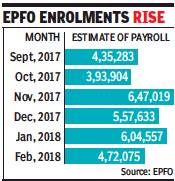
Over 35 lakh jobs were added in the formal economy in six months, according to the government’s first-ever estimate of payroll count based on Employees’ Provident Fund Organisation (EPFO) subscription and data from the Employees State Insurance Corporation and the Pension Fund Regulatory and Development Authority.
However, job creation slowed down in non-farm sectors during February as new member registrations with the EPFO declined to a four-month low of 4,72,075 during the month.
As many as 6,04,557 such members were registered in January 2018 and 5,57,633 in December 2017, the latest data released by EPFO about all non-zero contributors or new members that are registered with the body every month showed.
The number of all non-zero contributors registered with the EPFO was 6,47,019 in November, 3,93,904 in October and 4,35,283 in September last year.
From the PFRDA, the New Pension Scheme (NPS) data indicates generation of 4.2 lakh new payroll during the given period, that too only from Tier-I account. The NPS currently manages the corpus of around 50 lakh employees in state and the central government. For this study the central and state autonomous bodies have been shown under central and state governments respectively, while non-government refers to the corporate sector employees, a government statement said.
The EPFO said that these estimates may include temporary employees whose contributions may not be continuous for the entire year.
The EPFO has recently launched an aggressive drive to increase its coverage.
All establishments across the country with 20 or more employees whose basic wages are up to Rs 15,000 are required to be mandatory covered under the social security schemes run by the EPFO.
The payroll count is essentially the difference between the number of workers who joined and exited from the EPFO’s fold and as such is the net addition to jobs.
“It has now been decided to publish the age-band wise estimate of all new subscribers as declared by their employers. This data can be helpful in policymaking, planning and research work as the planners may have an idea as to what is the estimate of employees in different age band,” said a statement by Union labour ministry.
India has, for the first time, introduced monthly payroll reporting for the formal sector to facilitate analysis of new and continuing employment.
2018: 1 crore jobs, especially white collar, lost
Mahesh Vyas, Jobs Are Human Capital, April 11, 2019: The Times of India
From: Mahesh Vyas, Jobs Are Human Capital, April 11, 2019: The Times of India
Quality of Indian jobs is falling, there are fewer rewards for getting an education
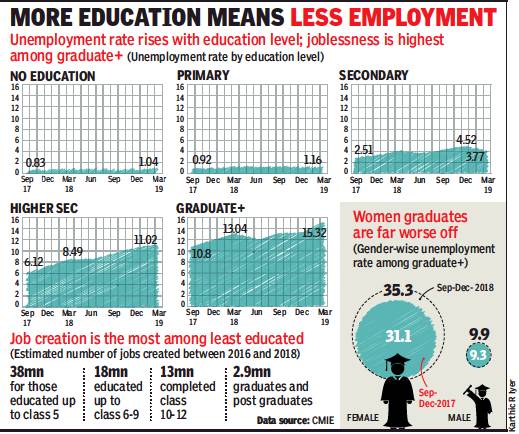
Centre for Monitoring Indian Economy’s Consumer Pyramids Household Survey estimated a loss of over 10 million jobs in 2018. That was a big loss and there is no respite yet on this count. But a bigger loss on the jobs front is the loss of quality jobs.
Without getting into the gobbledygook of statisticians it is easy to notice the proliferation of tea and tobacco stalls, delivery boys, handymen, taxi drivers and the like. These are not jobs that educated people aspire for. At the same time, the availability of good jobs for engineers, MBAs and other post-graduate degree holders is not as prominent as it was about a decade ago.
IT companies and the financial markets are not as aggressive in hiring talent anymore as online and offline retail enterprises are in hiring labour to pack and deliver consumption goods. This shift in demand in favour of lower-skill labour implies that the premium for education in labour markets is declining.
A generation ago, it was inconceivable to get a job in the organised sectors without a graduation degree. This is no longer true. Today, the minimum education required to get a job in the organised sectors is much lower and is dropping.
Completion of graduation was not necessary for the BPO and call centre jobs, which were the fastest growing jobs in the early 2000s. In today’s fastest growing sector – the logistics industry – even higher secondary education is not necessary. These are jobs in the organised sectors.
Jobs are growing faster at the lower end of the education spectrum and not as much at the higher end.
The Consumer Pyramids Household Survey quantifies the sharp fall in the rate of growth of jobs for the better educated in recent years. Over the last three years – between early 2016 and late 2018 – 38 million jobs were added for people who had completed only primary education, ie up to 5th standard. This implied that jobs for these barely educated people increased by nearly 45% over these three years.
In comparison, people who had acquired a little better education, ie between 6th and 9th standard, saw an addition of a much lesser 18 million jobs, implying also a lower 26% increase in jobs for these people.
The relationship between education and jobs gets worse as we go further up the education ladder. People who had completed secondary-to-higher secondary school education – 10th, 11th or 12th – saw a growth of 13 million jobs reflecting only a 12% growth over a three-year period.
Those with a graduate degree or a post-graduate degree saw the smallest growth in jobs between early 2016 and later 2018. These jobs grew by 2.9 million reflecting a growth of less than 6% over the three-year period.
Note that the growth rates of jobs keep halving as the education level rises – from 45% for the least educated to 26% for a small improvement, then 12% for secondary education and finally just 6% for the best educated.
The education composition of the employed is uninspiring. In late 2018, 55% or more than half of the employed workforce had not completed their 10th standard education.
If the quality of labour supply is nothing to be proud of, then the quality of jobs has to be correspondingly uninspiring. We see that while between 2016 and 2018 jobs have shrunk, the count of the self-employed has increased by nearly 20 million, which is a substantial 71% increase.
The self-employed are mostly those who could not find or retain a job during the age when most people begin their careers. After an age, when a person has no job offers on hand and when unemployment is not sustainable, then self-employment is the only option. Self-employment is rarely the preferred option at the beginning of a career.
In the past three years, this is the employment that has grown the most. There were 48 million self-employed people as of late 2018. Almost half of these emerged in the last three years – mostly in the form of small shops.
The self-employed include those who run small street stalls selling pan-beedi or pakora, etc, ferry goods on their hand-carts or boats, operate as insurance agents, brokers, etc. The better ones become taxi operators. Then, there are the freelancers like professional photographers, writers, who do gigs at their will. There is an entire range along the skills spectrum. Most of them are vulnerable.
The quality of work of most selfemployed persons is so poor that they do not even consider themselves to be employed. Neither do the daily wage labourers or agricultural workers. Only statisticians and labour economists consider these vulnerable workers to be employed. This gap between the definition of the specialists and the perceptions of their subjects needs to be narrowed.
Measurement of human capital in terms of the quality of jobs is important. Also, human capital is not merely years of education. Till the potential available in education is translated into quality jobs it is useless. Jobs are human capital, not just education.
2018 Q2> 2019 Q1
Nov 25, 2019: The Times of India
From: Nov 25, 2019: The Times of India
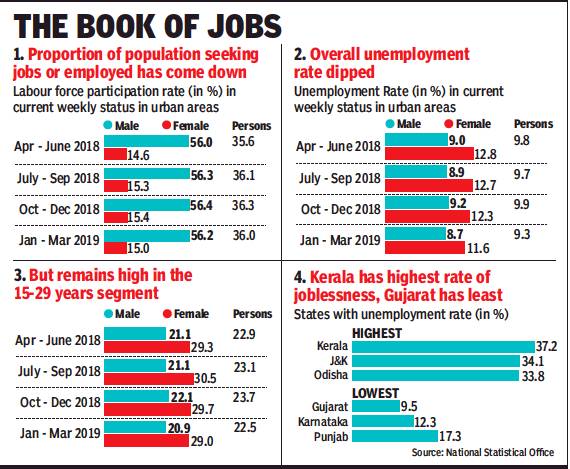
The share of regular wage earners and salaried employees in the total urban workforce increased marginally between April-June 2018 and January-March 2019 — from 48.3% to 50% — with women faring better, the latest Periodic Labour Force Survey (PLFS) released by the National Statistical Organisation showed.
According to data released, the rising trend has been maintained over the last four quarters, with salaried women, representing organised sector workers, seeing a 2.1 percentage point increase, compared to 1.5 percentage points for male workers.
In all, over a fifth of youths in cities available in the job market were unable to find employment in the last quarter of 2018-19, the PLFS data says. In January-March 2019, for which latest data is available, the survey estimates 22.5% unemployment rate in people aged 15 to 29 years.
Details
Mahesh Vyas, April 17, 2019: The Times of India

From: Mahesh Vyas, April 17, 2019: The Times of India
From: Mahesh Vyas, April 17, 2019: The Times of India
From: Mahesh Vyas, April 17, 2019: The Times of India
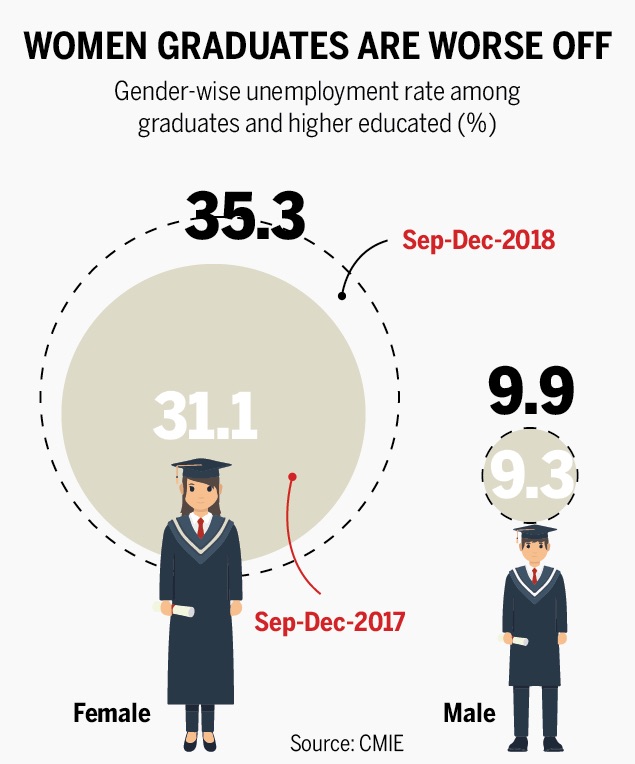
From: Mahesh Vyas, April 17, 2019: The Times of India
Centre for Monitoring Indian Economy’s Consumer Pyramids Household Survey estimated a loss of over 10 million jobs in 2018. That was a big loss and there is no respite yet on this count. But a bigger loss on the jobs front is the loss of quality jobs.
Without getting into the gobbledygook of statisticians it is easy to notice the proliferation of tea and tobacco stalls, delivery boys, handymen, taxi drivers and the like. These are not jobs that educated people aspire for. At the same time, the availability of good jobs for engineers, MBAs and other post-graduate degree holders is not as prominent as it was about a decade ago.
IT companies and the financial markets are not as aggressive in hiring talent anymore as online and offline retail enterprises are in hiring labour to pack and deliver consumption goods. This shift in demand in favour of lower-skill labour implies that the premium for education in labour markets is declining.
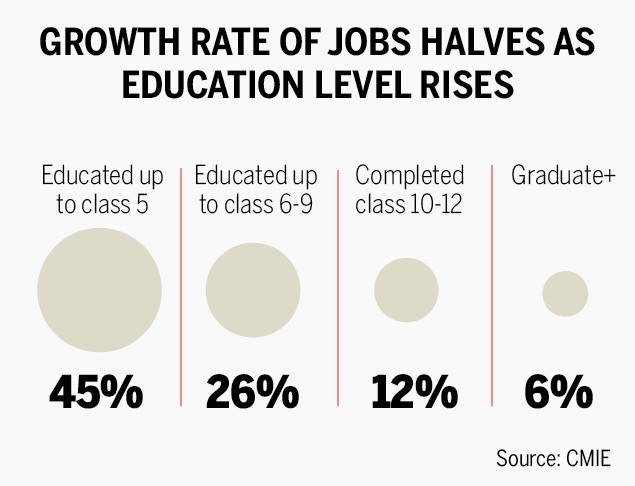
A generation ago, it was inconceivable to get a job in the organised sectors without a graduation degree. This is no longer true. Today, the minimum education required to get a job in the organised sectors is much lower and is dropping. The Consumer Pyramids Household Survey quantifies the sharp fall in the rate of growth of jobs for the better educated in recent years. Over the last three years – between early 2016 and late 2018 – 38 million jobs were added for people who had completed only primary education, i.e. up to 5th standard. This implied that jobs for these barely educated people increased by nearly 45% over these three years.
In comparison, people who had acquired a little better education, i.e. between 6th and 9th standard, saw an addition of a much lesser 18 million jobs, implying also a lower 26% increase in jobs for these people.
The relationship between education and jobs gets worse as we go further up the education ladder. People who had completed secondary-to-higher secondary school education – 10th, 11th or 12th – saw a growth of 13 million jobs reflecting only a 12% growth over a three-year period.
Those with a graduate degree or a post-graduate degree saw the smallest growth in jobs between early 2016 and later 2018. These jobs grew by 2.9 million reflecting a growth of less than 6% over the three-year period.
Note that the growth rates of jobs keep halving as the education level rises – from 45% for the least educated to 26% for a small improvement, then 12% for secondary education and finally just 6% for the best educated. The education composition of the employed is uninspiring. In late 2018, 55% or more than half of the employed workforce had not completed their 10th standard education.
If the quality of labour supply is nothing to be proud of, then the quality of jobs has to be correspondingly uninspiring. We see that while between 2016 and 2018 jobs have shrunk, the count of the self-employed has increased by nearly 20 million, which is a substantial 71% increase. The self-employed are mostly those who could not find or retain a job during the age when most people begin their careers. After an age, when a person has no job offers on hand and when unemployment is not sustainable, then self-employment is the only option. Self-employment is rarely the preferred option at the beginning of a career.
In the past three years, this is the employment that has grown the most. There were 48 million self-employed people as of late 2018. Almost half of these emerged in the last three years – mostly in the form of small shops.
The self-employed include those who run small street stalls selling pan-beedi or pakora, etc, ferry goods on their hand-carts or boats, operate as insurance agents, brokers, etc. The better ones become taxi operators. Then, there are the freelancers like professional photographers, writers, who do gigs at their will. There is an entire range along the skills spectrum. Most of them are vulnerable.
The quality of work of most self-employed persons is so poor that they do not even consider themselves to be employed. Neither do the daily wage labourers or agricultural workers. Only statisticians and labour economists consider these vulnerable workers to be employed. This gap between the definition of the specialists and the perceptions of their subjects needs to be narrowed.
Measurement of human capital in terms of the quality of jobs is important. Also, human capital is not merely years of education. Till the potential available in education is translated into quality jobs it is useless. Jobs are human capital, not just education.
The clamour for jobs
Mahesh Vyas, April 17, 2019: The Times of India
March 2018
2.8 crore people apply for 90,000 jobs with the Indian Railways
February 2018
Around 19 lakh candidates, including 992 PhDs and 23,000 MPhil degree holders apply for 9,500 posts of typists, stenographers and village administrative officers in Tamil Nadu
August 2018
93,000 applicants apply for 62 posts of messengers at the telecom wing of UP Police. Applicants for the job - for which minimum eligibility is class V - included 3,700 PhD holders, 28,000 PGs and 50,000 graduates
February 2019
Around 4,600 apply for 14 sweepers’ posts in Tamil Nadu; majority of applicants had B.Tech, M.Tech, MBA degrees
April 2019
Engineers, lawyers, CAs, MBAs among 12,453 interviewed for 18 Class IV posts at Rajasthan Assembly Secretariat. An MLA’s son got the job
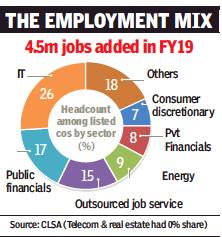
54% of jobs were at listed cos in IT, finance
Mayur Shetty, Sep 11, 2019: The Times of India
From: Mayur Shetty, Sep 11, 2019: The Times of India
IT & financial services have turned out to be the biggest employers — both account for half of the jobs among all listed companies. Incidentally, these two sectors are also the biggest hirers of women.
A study of the top 250 listed companies by investment bank CLSA has shown that of the total 45 lakh jobs generated by them, more than half were in just the two sectors, with financials employing 28% of the total workforce, or 13 lakh people, and IT another 26%. Within financials, the public sector employs 60% of the workforce.
Private firms continue to be the main source of job-creation, as public-sector headcount declined 2.6% in FY19. Private-sector headcount, on the other hand, increased by 9.2%. The decline in publicsector jobs was the sharpest seen in recent years. The two biggest listed public-sector employers — Coal India and SBI — on a net basis, cut their workforces yearon-year (YoY) by 4.4% and 2.6% respectively.
In the report ‘Boardroom nectar — Distilling the essence of India’s annual reports’ by Mahesh Nandurkar and Abhinav Sinha, job growth among listed companies in FY19 was 4.1% YoY for a comparable set of 238 companies, rising from 1.4% growth in FY18. This was a three-year high. “If we add the three large outsourcing job service providers, then the growth rises to 6%. In absolute terms, nearly 0.25 million net jobs were created during the year,” the report said.
At almost 420,000 employees, TCS has the largest workforce of all the listed companies in India. TCS has employed the largest number of women — at 152,114 female employees — accounting for 36% of their workforce. Infosys has the highest proportion of women in their workforce, at 37%. The biggest hiring increase was by Quess Corp, which hired 56,300 employees in the last year.
Public sector companies have shrunk their workforce for the second consecutive year, which is largely through attrition as there has not been any major separation scheme. One outcome of this attrition is that the average age is coming down.
Mar, Apr 2019: Jobless rate highest since 2016: CMIE
May 3, 2019: The Times of India
Jobless rate highest since October 2016: CMIE data
New Delhi:
India’s unemployment rate in April rose to 7.6%, the highest since October 2016, and up from 6.7% in March, according to data compiled by the Centre for Monitoring Indian Economy (CMIE). “The lower unemployment rate in March was a blip, and it has again climbed following the trend of earlier months,” Mahesh Vyas, head of CMIE, said.
The figures could be a setback for PM Narendra Modi during a general election that will end on May 19, with opposition parties criticising the government over weak farm prices and low job growth. The government recently withheld jobs data because officials said they needed to check its veracity. India usually releases official unemployment data every five years. But December unemployment figures were leaked and showed that the jobless rate rose to its highest level in at least 45 years in 2017-18. The government has said it will release jobs data once a year. CMIE said in a report released in January that nearly 11 million people lost jobs in 2018 after the demonetisation in late 2016, and new goods and services tax (GST) in 2017 hit millions of small businesses. REUTERS
Jobs to Investment ratio
1991-2014
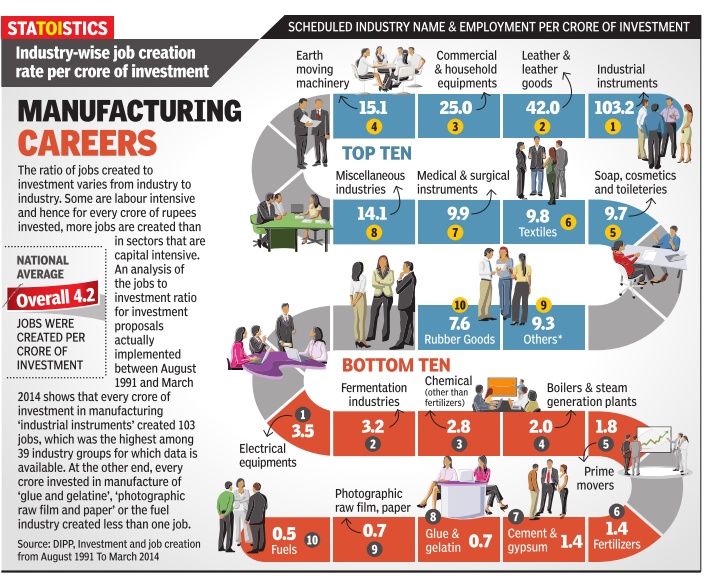
See graphic. 1991-2014: Employment created for every Rs.1 crore of investment
As in 2020
Madhav Chanchani, Digbijay Mishra, February 5, 2020: The Times of India
From: Madhav Chanchani, Digbijay Mishra, February 5, 2020: The Times of India
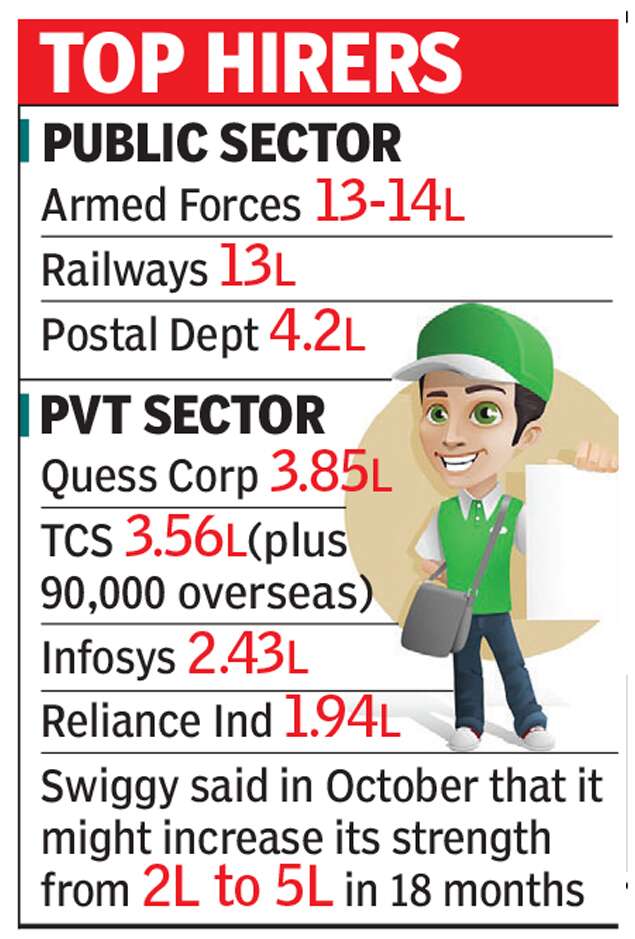
Heard of this firm? It’s now India’s largest private sector employer
BENGALURU: Next time you see an Amazon delivery executive in your locality or walk into a Samsung store for after-sales service, you will probably be dealing with an employee of Quess Corp — a company you most probably haven’t heard of.
Going by its latest quarterly filing, the Bengaluru-based company, which provides staffing solutions for some of the biggest brands in the country, now has the largest roster of employees and associates — 3.85 lakh — in the private sector in India.
Growing at 38% every year since 2016, Quess has shot past Tata Consultancy Services (TCS), which remains the largest overall employer with 4.46 lakh on the rolls, but of whom about 90,000 are overseas, pegging its India workforce at about 3.6 lakh, according to people briefed on the matter. TCS does not provide a geographic split of its employee base and a company spokesperson declined to comment for the story.
The development underlines a growing shift in the economy as companies like Quess have benefited from the demand for outsourced workers in areas ranging from e-commerce delivery to facilities management for commercial buildings.
There is, of course, a significant difference in the skill levels of staff at TCS, which mostly employs engineers, and Quess, which depends largely on ‘grey-collar’ workers.
Quess’s employees function as outsourced service providers for its over 2,000 clients, including Samsung, Amazon, Reliance, Vodafone India and Bajaj Finance, according to a report from ICRA. The company has about 5,000 workers overseas in markets like Singapore.
“There are many countries which have a population smaller than the number of employees we have. The scale of our impact on the Indian job market is not well-known, especially the role we play in formalizing the job economy,” said Quess Corp's Group CEO Suraj Moraje, a former McKinsey & Co partner who joined the company in November.
The development comes at a time when traditional sectors such as automobiles, telecom, FMCG and even IT services have seen layoffs for reasons like slowing growth and consolidation. At the same time, new economy companies continue to grow, fuelled by a record year of capital inflows.
Investors tracking the space say the shift is happening not only because of the scarcity of jobs, but also because wages have increased substantially in the segment. “This area is exploding and these grey-collar jobs now have salaries which compare with entry-level compensation in IT/ITes companies,” says Anand Lunia, founding partner at venture capital firm India Quotient, adding that wages for delivery boys have risen faster than inflation over the last decade.
Lunia was an early investor in Rebel Foods, which owns brands like Faasos and Behrouz Biryani, where salaries of delivery personnel are about Rs 20,000 – compared to Rs 6,000-7,000 in 2010, which inflation-adjusted, would have been about Rs 10,000-12,000 now.
“Their aspiration is a steady job, which is a big reason why companies outsource these jobs since attrition is high and there is also not always a steady demand for these roles,” he said.
According to Moraje, the average salaries at Quess range between Rs 12,000-Rs 40,000 for 70% of its workforce, about 75% of whom are in the age group of 21-35. While he declined to give an attrition number, the firm interviews over 1 million people a year. “We need to make sure that employees and associates have a career path so that our recruiting costs and retention rate improve,” he says. The company says it provides benefits such as provident fund and insurance to its entire workforce, and for many of them, this is their first formal employment.
Quess, which was started by serial entrepreneur Ajit Isaac over a decade ago, has grown at a fast clip through a slew of acquisitions and the backing of Fairfax, owned by Canadian billionaire Prem Watsa. The company was listed in 2016. Local rival TeamLease, also based in Bengaluru, had about 2.28 lakh employees and trainees as of December 2019. Other major players in the space include global giants like Adecco and Randstand.
“Companies are focusing on their core activities, while outsourcing activities that can be done by a specialised company; Quess Corp fits in there. Companies are wary of employing full-time when they can find gigs to fill in the jobs,” said Mahesh Vyas, MD & CEO at CMIE (Centre for Monitoring Indian Economy). He added that whether benefits are provided or not will be critical to measure if such employment are sustainable. “If a larger part of the labour force is getting into engagement that does not give social security, in a generation’s time, we could have a problem.”
Employment creation is inadequate
1947-2015: some statistics
Generous pay for employees, Vivek Rae, December 7, 2015: India Today
Vivek Rae was a member of the Seventh Central Pay Commission.
A study commissioned by the Seventh CPC through IIM-Ahmedabad with respect to 40 job families shows that government functionaries at lower levels are being paid much higher salaries and allowances compared to their private sector comparators.
At Rs 18,000 per month, the minimum salary is much higher than the minimum wage notified by state governments.
The Seventh Central Pay Commission (CPC) submitted its report on November 19 and its recommendations will apply during 2016-2025. The recommendations have been greeted with a storm of protest by major government employees' associations on the ground that the increase in pay at lower levels is inadequate.
The Central Pay Commission, set up every 10 years, has the complex task of setting the emolument structure for a wide spectrum of government employees and pensioners, covering about 4.7 million serving employees and 5.2 million pensioners. Conflicting considerations relating to attracting talent, addressing equity issues and fiscal sustainability make this exercise a difficult balancing act. Pay panel reports also provide the baseline for revision of salaries in state governments, public-sector enterprises, universities and autonomous bodies. The economy-wide financial implications are therefore significant.
An overview of the central government pay structure reveals the following:
1. The number of pay scales in government, which peaked at 500 in 1972-73, will come down to 18 in 2016. This indicates massive rationalisation and delayering of bureaucracy.
2. The real increase in the minimum pay, at 14.3 per cent, although modest compared to 54 per cent in the Sixth CPC and 31 per cent in the Fifth CPC, is based on the Aykroyd formula (based on nutrition intake of an average Indian adult) in practice since 1957.
3. The ratio of minimum salary in government to national per capita income has ranged from 2.5-2.6 since the 1960s and continues to be about 2.5 under the Seventh CPC. This ratio is much lower in OECD (Organisation for Economic Cooperation and Development) countries and indicates that central government employees in India earn much more than the average citizen in comparison with the OECD countries. At Rs 18,000 per month, the minimum salary compares favourably with the minimum wage notified by different state governments and is much higher if allowances are included.
4. The per capita expenditure on pay and allowances was Rs 3.92 lakh per annum in 2012-13, or about Rs 32,500 per month. This was about five times higher than the national monthly per capita income.
5. Previous comparisons between the minimum and maximum salary yielded a ratio of 1:36.4 in 1946-47, which declined to 1:11.4 by 2006. However, the appropriate comparison is not between the minimum and maximum salary in government but the entry pay at the lowest level (Group C) compared with the entry pay at officer level (Group A). The recommended salary of Rs 18,000 per month at Group C level compared with the entry salary of Rs 56,100 per month at Group A level yields a ratio of 1:3 and not 1:12.5, as is generally believed. The proposed pay structure, therefore, incorporates a high level of equity.
6. A study commissioned by the Seventh CPC through IIM-Ahmedabad with respect to 40 job families shows that government functionaries at lower levels are being paid much higher salaries and allowances compared to their private sector comparators. The reverse is the case for officers at senior levels. Group A officers account for only 2.8 per cent of personnel (excluding defence forces).
Personnel in position in central government (excluding defence forces) has remained static over the last 10 years at 3.3 million. Excluding central police forces, persons in position declined from 2.52 million in 2006 to 2.32 million in 2014. The intake of new civilian recruits during 2006-2014 has been about 1 lakh per year. This constitutes about 1 per cent of annual addition to the work force. Central government jobs are clearly not a solution for unemployment.
Financial impact
The impact of recommendations of the Seventh CPC is estimated at 0.66 per cent of the GDP in 2016-17, which is lower than the impact of 0.77 per cent of the GDP after the Sixth CPC in 2008-09. However, expenditure on pay, allowances and pensions (PAP) which increased from 14 per cent of the government revenue expenditure in 2007-08 to 18 per cent in 2008-09 (excluding Railways) is likely to go up to 22 per cent in 2016-17. A larger share of government spending is being accounted for by PAP. Expenditure on pay and allowances has also accounted for an increasing share of defence revenue expenditure, having increased from 40 per cent during 1995-96 to 60.81 per cent in 2009-10 (after Sixth CPC).
An innovative risk and hardship matrix has been designed to encapsulate the entire spectrum of risk and hardship allowances. These measures will enable government to further rationalise allowances in the medium-term.
While it is not possible to reconcile conflicting objectives and satisfy all stakeholders, the pay package recommended by the Seventh CPC has been generous by any standard.
Salary growth, 2008-16: 0.2%; GDP growth 63.8%
India's salary growth at 0.2%, GDP gain of 63.8% since 2008, PTI | Sep 15, 2016
- India has seen a salary growth of just 0.2 per cent since 2008.
- However, Indian econony grew by 63.8% since 2008.
- China recorded the largest real salary growth of 10.6% in this period.
- The US suffered one of the worst salary recoveries among developed nations.
India has seen one of the lowest pay rises since 2008.
NEW DELHI: India has seen a salary growth+ of just 0.2 per cent since the great recession eight years back, while China recorded the largest real salary growth of 10.6 per cent during the period under review, says a report.
According to a new analysis by the Hay Group division of Korn Ferry, India's salary growth+ stood at 0.2 per cent in real terms, with a GDP gain of 63.8 per cent over the same period.
During the period under review, China, Indonesia and Mexico had the largest real salary growth at 10.6 per cent, 9.3 per cent and 8.9 per cent, respectively.
Starting salaries in India amongst lowest in Asia-Pacific: Study
Meanwhile, some other emerging markets including Turkey, Argentina, Russia and Brazil had the worst real salary growth at (-) 34.4 per cent, (-) 18.6 per cent, (-) 17.1 per cent and (-) 15.3 per cent, respectively.
"Most emerging G20 markets+ stood at either one end of the scale or the other either amongst the highest for wage growth, or amongst the lowest. However, India stood right in the middle, with all the mature markets," the report said.
The report further noted that Indian wage growth is the most unequal.
"Of the countries we looked at, Indian wage growth was by far the most unequal - people at the bottom are 30 per cent worse off in real terms since the start of the recession; whilst people at the top are 30 per cent better off," Benjamin Frost, Korn Ferry Hay Group Global Product Manager - Pay said.
Strong wage growth for senior jobs is mostly because of skill shortages for key professional and managerial roles; and the increasing connection to a more globalised pay market at the senior levels - a market where India still pays less than most countries, but is catching up fast, Frost said.
Regarding the poorer wage growth at the bottom, the report noted that it is more because of an oversupply of people.
"India has made less progress than some other countries in bringing high value jobs to the country. This has led to poor job growth, therefore an oversupply of un/semi-skilled people, and poor wage growth," Frost said.
2004-2010: Jobless growth?
‘Jobless growth’ during UPA-1, admits Centre
Self-Employed Dropped From 56.4% To 50.7% Of Workforce
Rajeev Deshpande TNN
New Delhi: Some 20 months after hotly contesting data on UPA-1’s “jobless growth”, the government has admitted to lack of substantial increase in employment between 2004-05 and 2009-2010, with the selfemployed workforce shrinking from 56.4% to 50.7% of the total workforce.
In absolute numbers, the self-employed decreased from 258.4 million to 232.7 million in this period while regular salaried workers rose from 69.7 million to 75.1 million. The ranks of casual labour rose from 129.7 million to 151.3 million. In all, the total workforce increased from 457.8 million to 459.1 million, a rise of just 0.3% over this period.
The ministry of planning has identified limited flexibility in “managing” the workforce, high cost of complying with labour regulations, poor skill development and a vast unorganized sector as reasons for dissatisfactory growth in employment.
Responding to Parliament’s finance standing committee’s query on why India was not creating enough productive jobs, the ministry said while the number of salaried employees increased, the selfemployed segment declined.
Interestingly, the ministry referred to the same 66th round of the National Sample Survey Organization that irked the government in June 2011 with Planning Commission deputy chairperson Montek Singh Ahluwalia slamming the report as inaccurate.
The controversy deeply embarrassed the ruling coalition as the data seemed to negate the Manmohan Singh government’s “inclusive growth” slogan despite policy initiatives intended to make growth less uneven.
Under official pressure, the NSSO later put down the employment statistics to factors like rising incomes resulting in women choosing to stay at home instead of taking up physically challenging jobs.
Yet , the planning ministry that has told the finance committee “India had an average growth rate of 7.9% in the 11th plan. However, this growth did not lead to increase in employment opportunities”.
Stating that the NSSO data exhibited a shift in employment status, the ministry said in the period 2004-05 to 2009-10, the percentage of regular salaried workers increased from 15.2% to 16.4% and there was a jump in casual labour from 28.3% to 33%. It indicates that informal employment that accompanies new real estate development, industry and urbanization has lagged.
This would include service providers like road side eateries, local transport, small shops and services like appliance repair.
The planning ministry did not explain the jump in casual labour but this could due to the rural employment guarantee scheme, although the government has also argued that the trend contradicts claims of slow employment.
The numbers may look even less flattering when the next bunch of statistics is available in view of the plummeting growth.
The government has listed measures like boosting manufacturing, developing skills, promoting labour intensive sectors and simplifying labour laws as an antidote to the employment logjam.
GOING SLOW
Percentage of self-employed dropped from 56.4% of total workforce in 2004-05 to 50.7% in 2009-10
Percentage of regular employees rose from 15.2 to 16.4 and of casual labourers from 28.3 to 33
In absolute numbers, number of self-employed was 258.4m in 2004-05 and 232.7m in 2009-10
There were 69.7m regular workers in 2004-05 and 75.1m in 2009-10
Casual labourers rose from 129.7m to 151.3m
Total workforce rose from 457.8m in 2004-05 to 459.1m in 2009-10, an increase of just 0.3% Casual labour grew from 28% to 33%
2004-10: Fifty lakh jobs lost?
The Times of India, Aug 23, 2015
5 million jobs lost during high-growth years, says study
As many as five million jobs were lost between 2004-05 and 2009-10 — paradoxically during the time when India's economy grew at a fast clip — an Assocham study said.
This has put a question mark on whether economic expansion should be linked to job creation, according to the study.
Moreover, it observed that over-emphasis on services and neglect of the manufacturing sector are mainly responsible for this "jobless growth" phenomenon. Even as about 13 million youth are entering labour force every year, the gap between employment and growth widened during the period, the study noted.
"The Indian economy went through a period of jobless growth when five million jobs were lost between 2004-05 and 2009-10 while the economy was growing at an impressive rate," Assocham said.
Quoting Census data, it said the number of people seeking jobs grew annually at 2.23 per cent between 2001 and 2011, but growth in actual employment during the same period was only 1.4 per cent.
"This large workforce needs to be productively engaged to avoid socio-economic conflicts," Assocham secretary general D S Rawat said.
The changing demographic patterns, he said, suggest that today's youth is better educated, probably more skilled than the previous generation and highly aspirational.
"In a service-driven economy, which contributed 67.3 per cent (at constant price) to GDP but employed only 27 per cent of total workforce in 2013-14, enough jobs will not be created to absorb the burgeoning workforce," Assocham added.
Experts argue that the growth of manufacturing will be key for growth in income and employment for multiple reasons. For every job created in the manufacturing sector, three additional jobs are created in related activities.
In 2013-14, manufacturing contributed 15 per cent to GDP and employed about the same percentage of total workforce, a sign that the sector has a better labour absorption compared with services.
Employer’s recruitment plans: 2008-2017
See graphic
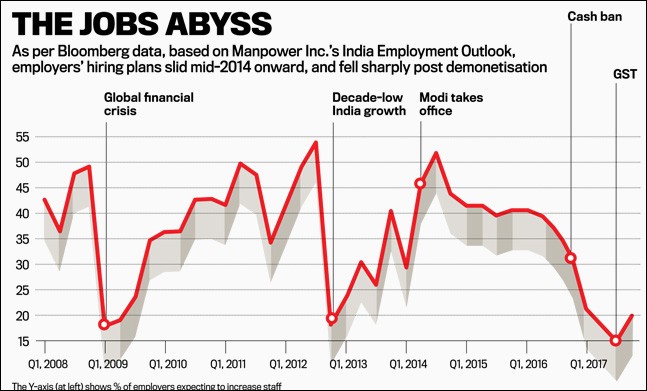
From 2011 to 2016 new jobs declined from 9 lakh to 1.35 lakh
PTI |7 million jobs can disappear by 2050, says a study, Oct 16, 2016
- As many as 550 jobs have disappeared every day in last four year, a study has claimed
- India created only 1.35 lakh jobs in 2015 in comparison to 4.19 lakh in 2013 and 9 lakh in 2011
- The data clearly points to the fact that job creation in India is successively slowing down
As many as 550 jobs have disappeared every day in last four years and if this trend continues, employment would shrink by 7 million by 2050 in the country, a study has claimed.
Farmers, petty retail vendors, contract labourers and construction workers are the most vulnerable sections facing never before livelihood threats in India today, the study by Delhi-based civil society group PRAHAR has said.
As per the data released by Labour Bureau early 2016, India created only 1.35 lakh jobs in 2015 in comparison to 4.19 lakh in 2013 and 9 lakh in 2011, the group said in a statement.
"A deeper analysis of the data reveals a rather scary picture. Instead of growing, livelihoods are being lost in India on a daily basis. As many as 550 jobs are lost in India every day (in last four year as per Labour Bureau data) which means that by 2050, jobs in India would have got reduced by 7 million, while population would have grown by 600 million," the statement said.
The data clearly points to the fact that job creation in India is successively slowing down, which is very alarming, it pointed out.
"This (rise in unemployment) is because sectors which are the largest contributor of jobs are worst-affected. Agriculture contributes to 50 per cent of employment in India followed by SME sector which employs 40 per cent of the workforce of the country," the statement said.
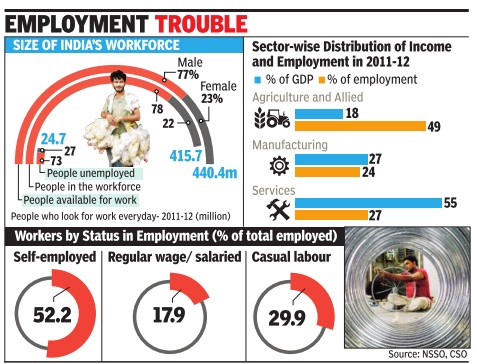
The organised sector actually only contributes a minuscule less than 1 percentage of employment in India. India has only about 30 million jobs in the organised sector and nearly 440 million in the unorganised sector.
According to the World Bank data, percentage of employment in agriculture out of total employment in India has come down to 50 per cent in 2013 from 60 per cent in 1994.
It said that the labour intensity of small and medium enterprises is four times higher than that of large firms.
It further said that the multinationals are particularly capitalistic a fact vindicated during investment commitments of USD 225 million made for the next five years during the Make in India Week in February 2016.
However, what went unnoticed is that these investments would translate into creation of only 6 million jobs, it said.
"India needs to go back to the basics and protect sectors like farming, unorganised retail, micro and small enterprises which contribute to 99 per cent of current livelihoods in the country. These sectors need support from the Government not regulation. India needs smart villages and not smart cities in the 21st century," it added.
2011-12: labour force participation rate, state-wise
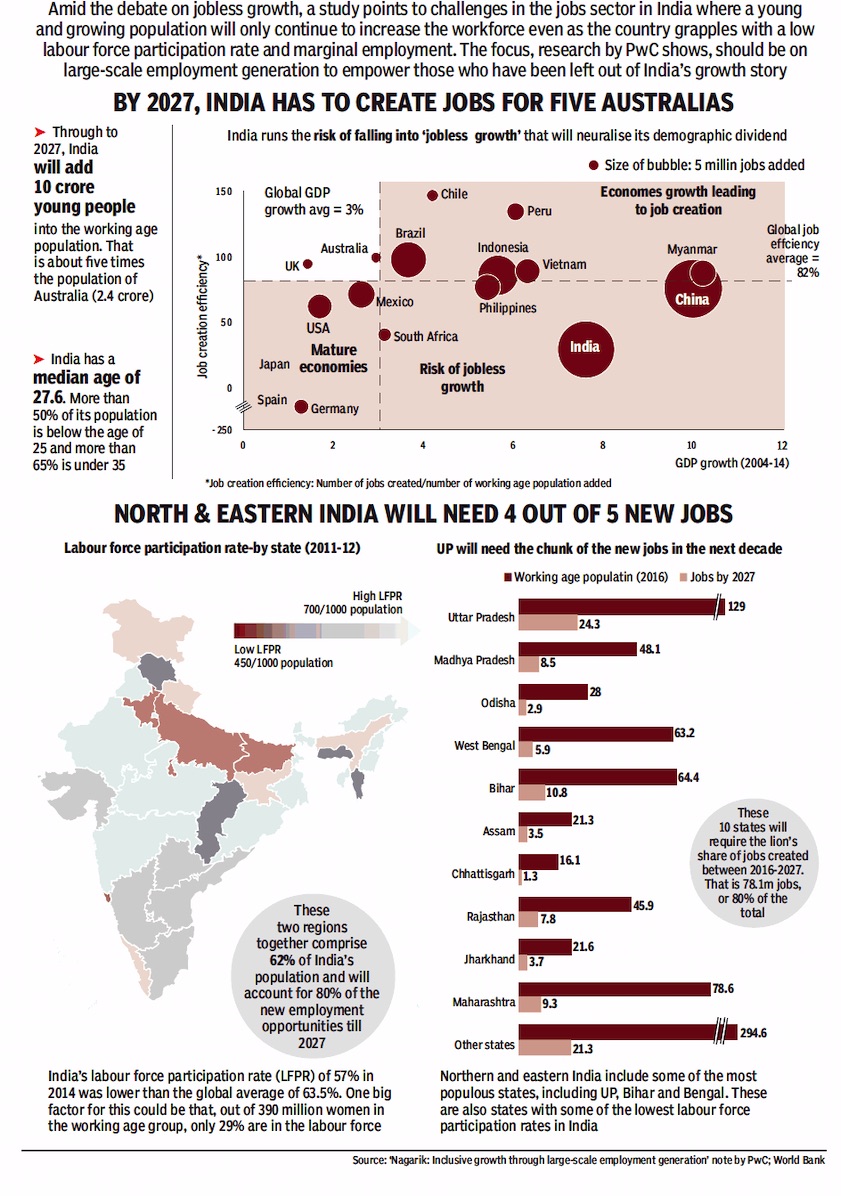
Jobs that India neads to create, state-wise, by 2027.
From: November 5, 2018: The Times of India
See graphic:
2011-12: India’s labour force participation rate, state-wise
Jobs that India neads to create, state-wise, by 2027.
Unemployment: The magnitude of the problem
2005-06> 2015-16: Sharp dip in Employment levels, particularly for women
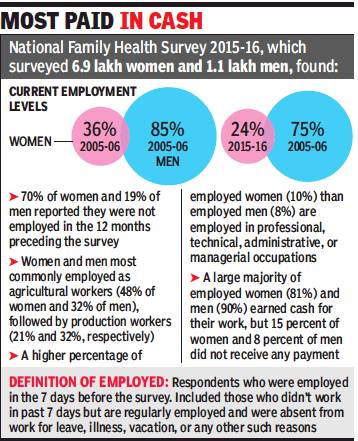
From: Rumu Banerjee, Sharp dip in employment levels in 2015-16: Survey, February 1, 2018: The Times of India
Employment levels, particularly for women, in 2015-16 as against 2005-06 have registered a sharp dip though women were employed in larger proportions than men in occupations such as “professional”, “technical”, “administrative” and “managerial”, the national family health survey has found.
A slightly higher percentage of women at 10% than men at 8% are employed in a professional, technical, administrative, or managerial occupations. Interestingly, 11% women who worked in past year were self employed.
Data collected by the survey shows employment levels have come down to 24% in 2015-16 for women, as compared to 36% in 2005-06. The figure is less stark for men but there is still a drop, with percentage currently employed down from 85% to 75% in the past decade.
The term ‘employed’ in the 2015-16 NFHS-4 is for respondents who were employed in the seven days before the survey. It included respondents who did not work in the past seven days but who are regularly employed and were absent from work for leave, illness, vacation, or any other reason.
“70% of women and 19% of men reported that they were not employed in the 12 months preceding the survey,” the survey said.
The survey found that men are three times as likely to be currently employed as women. The occupations have been categorised as professional, technical, administrative, managerial, clerical, sales and services, skilled manual, unskilled manual and agriculture.
Both women and men are most commonly employed as agricultural workers (48% of women and 32% of men), followed by production workers (21% and 32%, respectively).
A large majority of employed women (81%) and men (90%) earned cash for their work, but 15% of women and 8% of men did not receive any payment.
Jammu & Kashmir (14%), and Bihar and Assam (15% each) have the lowest percentage of women currently employed. More than one-third of women were currently employed in Manipur (41%), Telangana (39%), Meghalaya and Mizoram (35% each), and Andhra Pradesh (34%).
Amongst men, in the 15-19 years age group, 29.4% are currently employed, with 4.5% ‘not currently employed’. In the age group 20-24 years among men, 63.9% are employed. The percentage of unemployed goes down thereafter, ranging between 8.2% to 1.9% for 25-49 year old men.
2009-12: Joblessness on rise
Non-NREGS work paying more: Govt survey
TIMES INSIGHT GROUP
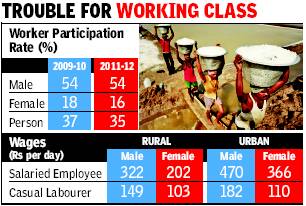
Between 2009-2010 and 2011-2012, the proportion of people working slipped slightly in India, and the share of unemployed persons ticked up, a government report released on Thursday revealed. In 2009-10, 36.5% of the population was gainfully employed for the better part of the year. By 2011-12, the proportion of such workers had dipped to 35.4%. Meanwhile, the unemployment rate went up from 2.5% to 2.7%.
These findings form the crux of a survey on employment and unemployment carried out by the National Sample Survey Organization (NSSO). The survey covered over one lakh households and was carried out between July 2011 and June 2012. The pan-India figures hide a deepening chasm between job opportunities for men and women. While the share of employed men remained roughly constant between 2009 and 2011, women’s employment dropped from 18% to 16%.
Loss of jobs
This may appear a small decline but translated into real numbers the crisis in employment is starkly revealed. In rural areas, about 90 lakh women lost their jobs in the two-year period. This would have been catastrophic but for the fact that in urban areas about 35 lakh women were added to the workforce.
Men joined the workforce in both urban and rural areas, though they got many more opportunities in towns and cities than in villages. Men’s participation in the workforce jumped from 99 million to 108 million in urban areas and from 228 million to 231 million in rural areas.
Unemployment
Kerala had the highest unemployment rate of close to 10% among the larger states. West Bengal (4.5%) and Assam (4.3%) were other large states with relatively high unemployment rates. Among smaller states, Nagaland had a staggering jobless rate of 27%, but this may be compromised data as surveys are difficult in strife-torn areas. Tripura too had a high unemployment rate of over 15%.
Wages
The report also contains striking information on daily wages of casual labourers and regular or salaried employees. In the government’s jobs scheme (MGNREGS), male workers were getting an average of Rs 112.46 per day, while in non-MGNREGS public works the rate was Rs 127.39, and in non-public works it was Rs 149.32. For women, the averages were more similar at about Rs 102 to Rs 110, though lower than men for the same work. This appears to go against a widely held belief that MGNREGS rates are setting the standard for all other wages in rural areas.
The wide gulf in urban and rural wage rates explains why people are migrating to live in cities. A male casual labourer earned about Rs 150 per day in rural areas, but his urban counterpart got Rs 180 per day. Similarly, a salaried employee could earn about Rs 300 per day in rural areas but in urban areas the same would shoot up to nearly Rs 450.
2011, unemployment rate
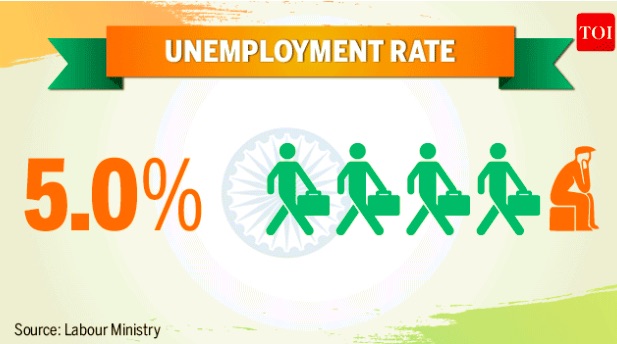
See graphic, ' Unemployment rate in 2011 '
2011: 11.3 crore persons seeking employment
Army of jobseekers now 11cr-strong
Subodh Varma
The Times of India Sep 24 2014
Constitutes 15% Of Working Age People, Spread Over 28% Of India's Families: Census
Over 11.3 crore persons are “seeking or are available for work“, that is, they were unemployed, according to Census 2011 data released on Tuesday .
This huge number made up around 15% of the working age population of about 74.8 crore in the 15 to 60 years age group.These unemployed persons were distributed over nearly 7 crore families or households.That's about 28% of all households in the country .
By categorizing persons as “seeking or available for work“ the Census has differentiated them from those who are not in the job market, which includes housewives and students among others.
This appears to be an alltime high for Census years. In 2001, about 23% of households had members that were unem ployed. Within a decade, this had risen to 28%. In the past three years, no particular spurt in employment growth or poli cies that would catalyse job creation have emerged and the situation continues to be dire.
These exceptionally high unemployment levels are likely to have contributed to the severe loss UPA suffered in the 2014 polls. Many pre-election opinion polls had underlined that unemployment was a key issue with voters. These stark figures would also be a wakeup call for the new Modi sarkar.
As reported previously by TOI, over 20% of youth between 15 to 24 years of age were jobless and seeking work according to Census 2011 data released earlier. In absolute terms, this army of unemployed youth is about 47 million.
The number of unemployed persons is actually more than 113 million because the Census office has released data in terms of how many persons per household are seeking or available for work, and the highest number in that is “more than 4“. For the purpose of the present computation, this has been taken as four persons only . There has been a distinct shift in the employment pattern since 2001. In most states, and nationally , the situation is relatively better in urban areas than rural. Nationally , 23% of urban households reported that they had at least one member unemployed while in rural areas this share went up to 30%. In 2001, the difference was not so much. The reason behind this appears to be the deep agricultural crisis.
Statewise unemployment figures reveal that while most states have approximately the same proportion of households with some member unemployed as the national average, some states have much higher rates. These include Jammu & Kashmir with about 48% households having unemployed persons, Bihar (35%), Assam (38%), West Bengal (54%), Jharkhand (42%), Odisha (39%) and Kerala (42%).
2011-15: Joblessness at 5-year high in 2015
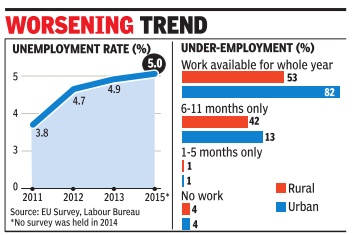
The Times of India
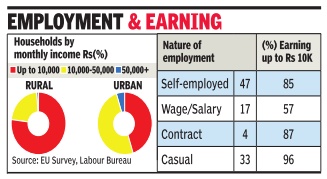
The Times of India
Subodh Varma, Joblessness at 5-year high, Oct 01 2016 : The Times of India
Joblessness in India is running at a five-year high of 5% of the 15-plus-years workforce. Over a third of working people are employed for less than a year and 68% of households are earning up to only Rs 10,000 per month, according to a new employment-unemployment (EU) survey report conducted by the Labour Bureau.
Over 7.8 lakh persons in 1.6 lakh households were surveyed across the country between April and December 2015. Expectedly, urban areas continue to provide more and better paying jobs compared with the rural areas. While 82% of job seekers get year-round jobs in urban areas, just 53% of rural job seekers manage to get such security. About 42% of workers in rural areas work for less than 12 months in a year, a result of dependence on seasonal agriculture work. Unsurprisingly, this means that 77% of the rural households end up with an average monthly income of less than Rs 10,000. In urban areas, about half the households earn between Rs 10,000 and Rs 50,000 per month.
These findings of the first large sample survey after the Modi government took power in June 2014 show that even after more than a year of seeing the new government's policies in action, the situation on the ground continues to be dire and effectively the same as in the preceding UPA's rule. It shows a continuation of a distressing job situation -and hence economic status -that was reflected in earlier surveys like the 68th round of NSSO and the Socio-Economic & Caste Census (SECC) in 2011-12.
What does 5% unemployment and 35% underemployment mean in hard numbers? Projecting from Census 2011 figures, India had a 15-years-and-older labour force of about 45 crore.So, 5% of that is a whopping 2.3 crore persons. In addition, there are those who work but not for the whole year, signifying hidden unemployment. This works out to nearly 16 crore persons. Women's employment continues to stagnate with 8.7% of women in the labour force without jobs.
Comparison to previous surveys done by the labour bureau show that the unemployment rate rose from about 3.8% in 2011to 4.9% in 2013. This was a period of relative economic slowdown compared to earlier in the decade. But growth has been recorded at 7.3% in 2015-16 -yet the jobs situation has worsened. The Modi government's pro nouncements for job creation, like Make in India, Start-Up India and Digital India do not seem to have had the desired impact.
The labour bureau survey also found that about 47% of the working population was self-employed.This would be mostly farmers, shopkeepers, and enterprise owners. But the low economic level of this section is revealed by the fact that 85% of such households had a monthly income of less than Rs 10,000.
Another 33% of households earn their living through casual employment. Regular wage or salary earning households make up just 17% of all, although this is the kind of work that pays more with 43% of peoploe earning more than Rs 10,000.
2014-15: rising unemployment
The Times of India, Jun 25 2015
Ambika Pandit
8.5 LAKH IN 2013 - Number of unemployed rising
Unemployment is clearly a problem in the city but what is more worrying is that between 1995 and 2013, the number of unemployed holding diplomas of various courses has more than doubled from 21,705 to 44,934. This data--part of Delhi Government's Economic Survey 2014-15--raises a serious question about the quality and future of diploma courses and vocational training programmes floated from time to time. In 2013, Delhi had 8.5 lakh unemployed people, significantly lower than the 11.3 lakh recorded in 1997. However the data reflects a very worrisome trend from 2010 onwards as, after falling to 4.1 lakh in 2009 the number has risen steadily . It was 4.9 lakh in 2010, became 6.4 lakh in 2011 and then rose to 7.7 lakh in 2012.
Not only is the rise worrisome but also the educational status of those reeling under the effect of unemployment is a cause of concern and will be a major challenge for the Kejriwal government that won support from youth on the promise of “degree, income aur wi-fi“. The AAP government has talked about vocational training and skill development as part of its long-term education plan.
The Economic Survey makes it clear that many di ploma holders are not getting jobs easily . In 2009, the num ber of unemployed in this category had gone down to 8,766 but rose to 23,361 in 2010 reached 37,554 in 2011 and 44,934 in 2013. The authorities need to fo cus on the vocational courses and diplomas offered in the city. These need to be clearly aligned with the needs of the market. The data also shows that most of the unemployed have studied up to graduation or less. The number of unem ployed in this category in 2013 was 4.9 lakh, down from 5.2 lakh in 1995. However, the large number of jobless youths who have studied up to Class XII shows the lack of courses linked to livelihood.
The number of unemployed graduates and post-graduates in 2013 was 1.9 lakh.Those below matriculation and seeking jobs added up to 1.3 lakh.
2016: people seeking work
The Times of India, Mar 27, 2016
Subodh Varma
In the 2016 Budget session of Parliament, there was an eerie silence on one of the biggest problems facing the people — jobs. Both the Rail Budget and the Union Budget speeches mentioned jobs a handful of times but mostly in reference to future prospects. The debates, including the PM's interventions, followed the trend with hardly any worry about jobs. Meanwhile, in the real world, the job situation is not a happy one. Although current employment statistics are not generated in India, applications in the job guarantee scheme have touched an all-time high and a quick survey of eight industries done every quarter by government indicate a dire situation. Macroeconomic parameters too are not showing any hope. The number of people who apply for work in the job guarantee scheme is a good measure of the employment situation in rural areas.
Till the third week of March 2016, a staggering 8.4 crore persons had demanded work under MGNREGS. That's a 15% increase from the 7.3 crore who demanded work last year. This is a symptom of large scale scarcity of jobs because the wage employment scheme provided only 43 days of work on average in a whole year — instead of the 100 days guaranteed under the scheme —and that too manual labour. Of those who applied, nearly 1.6 crore or 19% were not given work — the highest turn-back ever seen in this scheme. So, the job situation in rural areas doesn't appear to be very healthy.
Another partial measure of recent employment trends is provided by a quarterly survey of eight industries by the Labour Bureau. The last such survey result was released in March 2016 covering June to October of 2015. After the NDA government took over, just 4.3 lakh jobs have been added between July 2014 and October 2015 — lower than the immediately preceding 15 months and the same as the corresponding period of 2012-13 under UPA. Of these, the bulk of jobs have been in IT-enabled services (ITES) and the BPO sector. Besides these two indicators, some of the big economic indicators too are not presenting a very optimistic picture. The index of industrial production measures how industrial production is changing — if it rises, so does employm ent, and if it slows, creation of jobs is affected. Between April 2015 and January 2016, the IIP grew by just 2.7%. In the previous year, the first year of this government, it had grown by 2.6%. For eight core industries like coal, oil, gas and steel, which make up 38% of the IIP, the growth from April 2015 to January 2016 was just 2%.
Agricultural output has meanwhile sunk with gross value added growing at a mere 1.1% in 2015-16, as per latest estimates by the Central Statistical Office. This comes after a decline of 0.2% in 201415. This is the devastation of two successive droughts. Services sector continues to grow with its output rising by 9.2% in 2016.
The bottomline is that jobs remain elusive, and measures to create jobs — through infrastructure development or Make in India — are still to show results.
2018: The magnitude, the debate
There is consensus that a top priority for India is creating jobs, especially jobs that pay well. Surprisingly, there also seems to be consensus that we are adding approximately one million new job seekers each month.
This was the figure Congress president Rahul Gandhi highlighted when speaking at the University of California at Berkeley and Princeton University the past September. At UC Berkeley he referred to 12 million young Indians entering the job market every year and at Princeton he placed the figure at 30,000 per day. While there was much dissection of Rahul Gandhi’s speeches, no one questioned these numbers.
It is surprising that on an issue so central to policy making, we have accepted the most critical statistic without scrutiny and centred all jobs debates and analyses on it. The origins of the statistic are difficult to trace but nearly all analysts and institutions pronouncing on the job situation in India are using it.
But some simple calculations that economist Rahul Ahluwalia has generously done at my request convincingly demonstrate that this figure overstates the likely correct figure by a solid 50%.
The number of individuals entering the workforce in any given year is obtained by multiplying the absolute number of additions to the working age population that year by the labour force participation rate (LFPR). The latter measures the proportion of the population that participates in the workforce. Because not everyone who attains working age enters the job market, the LFPR is usually a number smaller than one.
A 2006 report by the technical group on population projections constituted by the National Commission on Population (NCP) provides estimates of population in different age groups for years 2011, 2016 and 2021. The report’s estimate of the total population in 2011 is within 1.5% of the actual population as measured by the Census 2011. This error is smaller than those in the estimates provided by the United Nations and the United States Census Bureau.
The report places the population of individuals older than 15 years at 929 million in 2016 and 1,003 million in 2021. These figures imply an addition of 74 million working age individuals to the population in five years or approximately 15 million per year. The figure being larger than 12 million per year, addition of one million per month to the workforce is not ruled out.
It turns out, however, that the labour force participation rate in India is unusually low. The latest estimates we have are from the 2011-12 Employment-Unemployment Survey by the National Sample Survey Office (NSSO) and 2015-16 Employment-Unemployment Survey of the ministry of labour (MoL). Applying the LFPR in these two sources to the addition to working age population estimated by the NCP technical group, Ahluwalia finds the number of those entering the workforce annually between 2016 and 2021 to be 7.5 and 7.8 million, respectively.
The approximate number of jobs seekers thus turns out to be a good 4.2 to 4.5 million smaller than the 12 million figure that is defining the current debate and policy formulation. These figures are by no means definitive. The LFPR during 2016-21 may turn out to be different from those in the NSSO and MoL surveys. But even applying the LFPR in the 2004-05 NSSO survey, the highest such rate observed during the past 25 years, the number of new entrants per year rises to only 8.5 million, a far cry from 12 million.
It is nobody’s case that fewer entrants to the workforce than previously thought make our jobs problem go away. The point, instead, is that our debates and policy analyses need to be conducted using as accurate numbers as may be available. A smaller number of entrants may mean that the problem is not as insurmountable as it may have seemed. It may also imply adjustment on the margin to policy priorities between jobs and other objectives.
A different but related issue worth flagging here concerns the current trend in the LFPR in India. Between 2004-05 and 2011-12, India experienced a significant decline in LFPR. The rate fell particularly sharply from 33% to 25% among rural women.
The phenomenon of U-shaped LFPR for women, whereby the participation rate first declines with rising per capita income and then turns back up has been well documented in development literature. Starting at low per capita incomes, rising incomes may lead to a withdrawal of women from workforce for a variety of reasons: Women may choose leisure over work once the family income rises above a certain threshold; social stigma associated with working in the field may encourage withdrawal by women once such work is not necessary for subsistence; rising capital intensity of agriculture may asymmetrically substitute for women’s labour; and progressively increasing number of women may choose education over work during early adulthood.
While the sharp decline in LFPR of women is, thus, explained, it remains disturbing since it has taken place from an already low participation rate among rural women. Insofar as possible, policies must pay particular attention to facilitating the expansion of jobs that would help bring women into workforce in larger numbers.
6.9% unemployment, a 2-year high
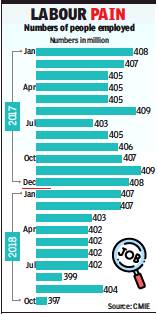
From: Rajesh Chandramouli, Unemployment rate at 6.9%, a 2-yr high: Study, November 9, 2018: The Times of India
‘Job Participation Rate Lowest Since Jan 2016’
Unemployment rate in the country rose to 6.9% in October, the highest in two years, according to the Centre for Monitoring Indian Economy. Worse still, the labour participation rate—a measure of the proportion of adults willing to work—fell to 42.4%, the lowest since January 2016, CMIE said.
“Labour participation rate fell sharply after demonetization”, from around 47-48%, “and it has still not recovered,” the study said. “The small improvement in labour statistics seen in September turned out to be short-lived. October statistics point to a continuation of the deterioration in labour markets seen earlier,” the think-tank said. The estimated number of persons employed during October 2018 at 397 million was 2.4% lower than the 407 million persons employed in October 2017. “This sharp fall in the employment rate in October is perhaps the most worrisome measure of the labour markets,” CMIE said.
The count of the unemployed persons actively looking for jobs almost doubled to 29.5 million in October 2018 from a low of 14 million in July 2017 (and 21.6 millon in Ocotber 2017), CMIE added. Commenting on CMIE's latest unemployment data, Aditya Narayan Mishra, CEO, CIEL HR Services, said, "Octoberto-December is traditionally the job creation period across sectors in the Indian economy, and the mismatch between demand and supply of labour is hence worrying." Annually, almost 12 million people enter the country's labour markets and job creation hasn’t been robust enough to support this, he said.
He added the subdued performance of the country’s core sectors such as power and infrastructure, coupled with inadequate lending by NBFCs could be a reason for the mismatch. “IT industry has also not created much jobs in this period,” he said.
2017-18: NSSO’s Survey withheld, 2 top Statisticians resign
NSSO employment report on 2017-18 was expected to reflect job losses
Protesting against the withholding of the NSSO’s (National Sample Survey Organisation) first Annual Survey on Employment and Unemployment for the year 2017-18, the Acting Chairperson of the National Statistical Commission (NSC) resigned on Monday. Another colleague has also quit.
This report, the first by NSSO in this government, was expected to reflect job losses in the wake of demonetisation.
NSC is an autonomous body constituted in 2006 and tasked to monitor and review the functioning of the country’s statistical systems. Three years ago, it was snubbed by the Niti Aayog over finalisation of GDP back series data.
P C Mohanan, a career statistician, and J V Meenakshi, Professor at the Delhi School of Economics, were appointed by the government as members in the NSC in June 2017.
Both had a three-year term. Mohanan was the Acting Chairperson before he resigned. At present, NSC’s ex-officio member Amitabh Kant, who is the Chief Executive Officer of NITI Aayog, is the only person at the helm.
When contacted, Mohanan told The Indian Express: “The normal convention is that NSSO presents the findings to the Commission, and once approved, the report is released within the next few days. We approved the NSSO survey on employment/unemployment in December beginning,” said Mohanan. “But the report has not been made public for almost two months.”
“The 2017-18 job survey did not present a good picture on the employment front. This is most likely the reason for holding it back,” said a source in the NSSO.
Earlier, the NSSO undertook employment/unemployment surveys once in five years. The last survey was released in 2011-12.
The next survey should have been in 2016-17. But after considerable thought, the NSC decided to have annual as well as quarterly surveys. The first annual survey undertaken by the NSSO for the year-ending June 2018 (July 2017-June 2018) would have covered both the pre-demonetisation and post-demonetisation period.
Almost three years ago, the Central Statistics Office (CSO), in the Ministry of Statistics and Programme Implementation, had finalised back series data for GDP following a change in the base year from 2004-05 to 2011-12. That exercise had led to an upward revision in growth rates for the UPA years but the NITI Aayog, then under Vice Chairman Arvind Panagariya, did not allow its release.
The latest update by the CMIE revealed that the unemployment rate shot up by 7.4 per cent in December 2018, the highest in 15 months, and that 11 million jobs were lost in 2018 due to demonetisation. But the government has denied job losses, and often said many entrepreneurial jobs have been created.
At a jobs event organised by the Confederation of Indian Industry on January 19, Piyush Goyal, now finance minister, had said that data on jobs available now was not very inclusive and did not cover the many new-age industries, such as taxi aggregators which engage a million people. Entrepreneurship did not get recognised and household help was not accounted for, he said. “The absence of these will exaggerate the demand and supply situation for employment,” Goyal said.
2017-18: Unemployment at 45-year high of 6.1%
Unemployment in 2017-18 was a 45-year high of 6.1%, says the labour survey of the government’s National Sample Survey Office. This report, long suppressed by the government, has leaked to the media. Unemployment was only 2.2% in 2011-12, meaning it has skyrocketed since. In 2017-18 it was higher in urban areas (7.8%), the BJP’s main support base, than in rural areas (5.3%).
Equally dramatic is the reported fall in labour force participation (the proportion of people in the 16-64 age group looking for work). This has fallen from 43% in 2004-05 to 39.5% in 2011-12 and further to just 36.9% in 2017-18. This suggests a major job crisis, not just under the NDA but under the previous UPA government too.
Job growth was Narendra Modi’s main promise in the 2014 election. The data suggests he has failed dramatically. The trends are worst for youngsters, who are great Modi supporters. Between 2011-12 and 2017-18, unemployment for youths 15-29 years old shot up from 8.1% to 18.7% for males, and from 13.1% to 27.2% for females. This seems electorally devastating.
Once, the only source of job data was the government. But in recent years, the Centre for Monitoring the Indian Economy, a private establishment, has been tracking employment using a very large sample. This has shown unemployment rising very high to 7.4% in December 2018. Critics said this was too high to be true. But the government’s own NSSO report now estimates unemployment at 6.1% in 2017-18, not far from CMIE’s estimates. CMIE shows deterioration throughout 2018, causing the loss of 11 million jobs, culminating in 7.4% unemployment in December 2018.
But now comes the paradox. An employment crash of the catastrophic sort indicated by the NSSO and CMIE typically occurs only in terrible, deep economic depressions. But India has been averaging over 7% GDP growth, and is the fastest-growing major economy in the world. Never in history has a miracle economy, growing at over 7%, witnessed a collapse of employment.
The investment rate has come down under Modi, bank credit is growing much more slowly, and exports have stagnated. If employment has also been falling, it implies that India must be having a miraculous explosion of productivity, to be able to grow at 7% despite having no additional labour and very little additional investment. There is no independent evidence of this. Besides, if India had a productivity explosion, exports should have boomed. Instead, they have stagnated. The mystery gets deeper and deeper.
There is also a complete disconnect between what the employment data suggests and what election results have shown since 2014. You can ignore labour data and declare that the employment situation has been good enough for Modi to win an unprecedented cascade of state elections since 2014. Till last December, he ruled as many as 21 states. Then in December he lost the three central Indian states of Rajasthan, Madhya Pradesh and Chhattisgarh.
But even in Rajasthan and Madhya Pradesh his party won almost the same vote share as the Congress party. This is far from a debacle. Indeed, the BJP hopes to do very well in these states in the coming general election, when the contest will be seen as being Modi vs Rahul Gandhi, a far more one-sided contest than Vasundhara Raje vs Ashok Gehlot at the state level.
Critics say demonetisation in November-December 2016 caused immense distress and job losses. However, in the Uttar Pradesh state election in April 2017, the BJP absolutely swept the state with a three-quarters majority. Whatever the employment data may show, the job situation was good enough for Modi to win in a landslide.
The switch from a multitude of taxes to an all-India GST in July 2017 has been hailed as a great reform, but one that caused much initial disruption. It will check tax evasion, but that also means it will hit many small industries that earlier survived only because of tax avoidance.
Critics say the combined impact of demonetisation and GST glitches has hit employment and caused immense distress. But that seems contradicted by the excellent election performance of the BJP in UP and its sharp improvement in Karnataka. It lost ground in the central Indian states, but this could be attributed to normal anti-incumbency and falling farm prices. Had these factors been buttressed by a job collapse, the BJP should have fared far worse.
One day, the mystery will clear up. Till then, we can only say that job data have so little correlation with election outcomes that nobody should assume that high unemployment will cause a Modi defeat in the general election. That remains to be seen.
Joblessness at 45-year high? NSO puts a caveat
June 2, 2019: The Times of India
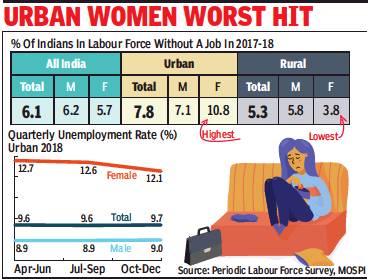
From: June 2, 2019: The Times of India
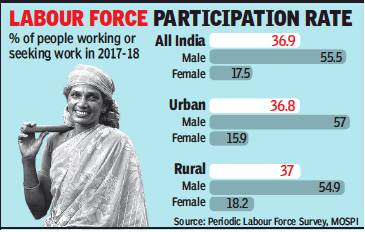
From: June 2, 2019: The Times of India
Joblessness at 45-year high? NSO puts a caveat
‘New Design, Don’t Compare With Past Data’
New Delhi:
A little over 6% of India’s labour force was unemployed in 2017-18, the latest year for which government released data. The unemployment rate is identical to the rate mentioned in a report leaked in January this year, which had showed unemployment to be at a 45-year high.
The leaked report had triggered a major controversy, with the opposition parties slamming the government for its failure to create jobs and withholding the report. The government had said that the report was only a “draft” and not final.
The report released on Friday by the National Statistical Office (NSO) said the new labour force survey needs to be seen as a new series for measuring unemployment on an annual basis.
“This is a new design and uses new metric and it would be unfair to compare it with the past,” Pravin Srivastava, the country’s chief statistician, told reporters while releasing the report, a day after the new government was sworn in. He denied there was any political pressure to delay releasing the report.
Jobs data poses a policy challenge for new govt
The unemployment rate among females in 2017-18 was at 5.7% while that for males was at 6.2%, according an NSO report released on Friday. The jobless rate for females in urban areas was in double digits at 10.8% while it was at 7.1% for males. In rural areas, the unemployment rate was at 5.8% for males and at 3.8% for females. The NSO report also unveiled the results of a quarterly survey for urban areas for the period after 2017-18. The results showed that during October to December 2018, the unemployment rate was at 9.7%, higher than the 9.6% recorded in July-September 2018 and similar to the 9.7% in April-June 2018.
The quarterly survey showed that the unemployment rate for females was higher at 12.1%, while it was at 9% for males.
The annual survey showed 57.8% of male workers were self-employed in 2017-18 in rural areas, while the rate was at 57.7% for females. In urban areas 39.2% males and 34.7% females were self-employed. The NSO said the first annual report is based on the data collected in Periodic Labour Force Survey (PLFS) during July 2017 to June 2018 and its estimates are linked to various aspects of employment and unemployment at the national and state levels. The quarterly bulletin contains data on employment and unemployment indicators in urban areas only. The issue of jobs was a key election issue in the just concluded national elections. It has also been a flashpoint in debates between the government and opposition parties.
The results of the annual and quarterly survey pose a policy challenge for the new government and may prompt it to devise ways to create jobs across sectors as well as increase participation of women in the workforce.
Area, gender and category- wise unemployment rate
2004-12
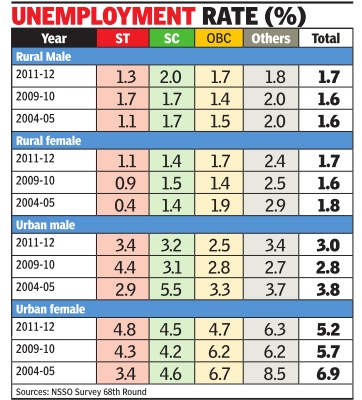
Apr 25 2015
Ranks of jobless SCs, OBCs in villages swell
Mahendra Singh
Unemployment increased, if marginally , among rural male inhabitants of the scheduled castes (SC) and other backwards castes (OBC) between 2009-10 and 2011-12, a survey by the National Sample Survey Organisation (NSSO) has discovered. In this period, the unemployment rate for men living in villages went up from 1.7% to 2% among SCs, and from 1.4% to 1.7% among OBCs.The unemployment rate decreased marginally , from 1.7% to nearly 1.3%, for STs, and 2% to 1.8% for those who comprise `Others' category.
Among women living in rural areas, the unemployment rate for STs increased from 0.9% in 2009-10 to 1.1% in 2011-12, and for OBCs, from 1.4% to 1.7%. It remained almost at the same level for SCs (1.5% in 2009-10 compared to 1.4% in 2011-12) and `Others' (2.5% in 2009-10 compared to 2.4% in 2011-12). In cities and towns, the unemployment rate among men decreased for STs (from 4.4% in 2009-10 to 3.4% in 2011-12) and OBCs (from 2.8% to 2.5% for the period) while remaining at the same level for SCs (3.1% in 2009-10 to 3.2% in 2011-12). The unemployment rate for `Others', however, increased from 2.7% to 3.4%.
Unemployment has increased among ST and SC women living in urban areas, going up from 4.3% in 2009-10 to 4.8% in 2011-12 for STs, and from 4.2% to 4.5% for SCs.However, unemployment decreased among OBC women living in cities and towns (from 6.2% to 4.7%) and remained at the same level for `Others' (6.2% in 2009-10 and 6.3% in 2011-12). In a nutshell, the unemployment rate in 2011-12 for urban women was lowest among SCs, while their ST counterparts were better placed in villages. Among males living in urban areas, unemployment was worst for STs, while SCs faced the highest rate in villages.
20-29 years age group: 2011
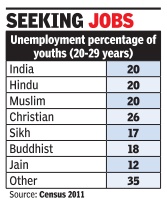
See graphic: Unemployment percentage of youths (20-29 years), 2011
Age and unemployment: 2017-18
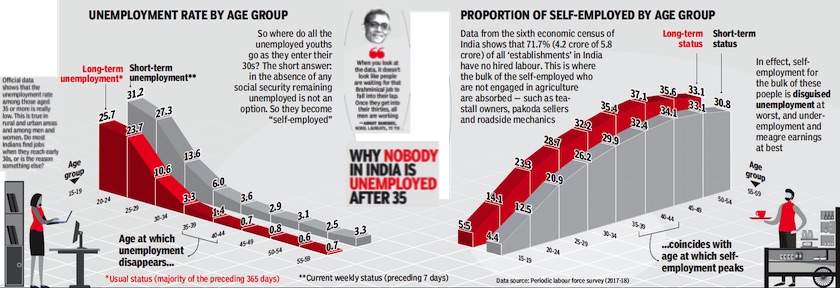
From: February 2, 2020: The Times of India
See graphic:
Age and unemployment in India: 2017-18
Skilled workers, unemployment among
2014
The Times of India, Jul 20 2015
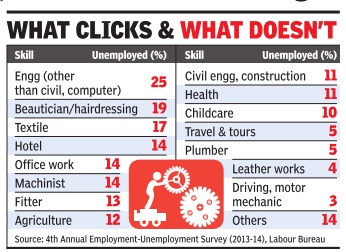
Subodh Varma
Survey: Even among skilled workers, joblessness is high
`14.5% end up without work after training'
Among those who got formal training in establishments like Industrial Training Institutes or other Skill Centres, the unemployment rate was high -at 14.5% -compared with 2.6% overall, according to a survey done by the Labour Bureau in 2014 and released in 2015.
In a revealing breakdown of skills and the corresponding rate of unemployment, the survey found that except for a handful of trades like leather work, plumbing, motor driving and tourtravel operations, all other categories of skilled persons exhibited double-digit unemployment figures. Some of these are shocking: over a quarter of those who had done engineering diplomas in disciplines other than civil and computers were unemployed. Nearly 17% of those with textile-related training and over 14% with machine operator skills were without jobs.
Unless new jobs, especially in the manufacturing sector, are created, imparting skills to millions will not solve the problem, says IIT-Delhi's Jayan Jose Thomas, who has researched the Indian employment scenario extensively. Existing industry does face a skills gap. That's what entrepreneurs and industrialists keep telling me. So, imparting skills will help somewhat. But the primary thing is to have a policy for industrial growth that will create millions of new, decent job opportunities,“ he told TOI.
About 12 million people join the workforce every year in India. But an analysis of job growth over the past nearly two decades by Thomas, using NSSO and census data, shows that on an average, only 5.5 million new jobs have been added every year in this period.
Labour Bureau data shows that unemployment rates are higher among those with higher educational qualifications. While the overall unemployment rate was reported at 2.6% among the over-15 age population, for postgraduates, it was 8.9%, for graduates 8.7% and for diploma or certificate holders, 7.4%. Experts believe that this could be because qualified persons seek better wages and hence may remain unemployed for a longer period while seeking the best options.
Industrial employers often prefer to employ workers with no formal training but adequate experience over say ITI products, again because of wage issues. According to University of California, Santa Barbara's Aashish Mehta, who has studied the skill gap issue, the decision is more a commercial one than a skill level issue.
The average daily wage of an urban diploma holding worker was about Rs 524 for men and Rs 391 for women according to an NSSO report.Men who have studied up to senior secondary make 45% more and women 28% more.But compared to graduates, the diploma holder will get 56% less if male and around 54% less if female. This gives an indication of how employers will make choices, and may also hint at families making educational trajectory choices. The unemployment rates are higher among those with higher educational qualifications. Experts believe that this could be because qualified persons seek better wages and hence may remain unemployed for a longer period while seeking the best options.
Urban unemployment
2022- March 2023
May 30, 2023: The Times of India
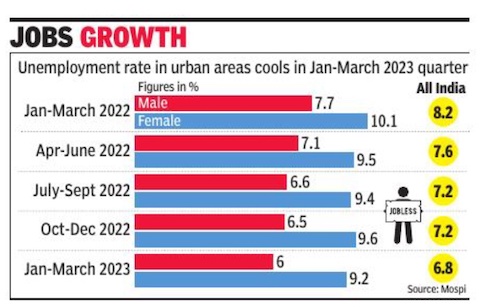
From: May 30, 2023: The Times of India
New Delhi : The unemployment rate in urban areas in the January-March quarter of 2023 slowed to 6. 8% from 8. 2% in the January-March period of last year as the job situation improved and economic activity took off.
The unemployment rate during the January-March quarter of 2023 eased to at least a five-quarter low. The rate had accelerated sharply during the Covid-19 pandemic as curbs were imposed to prevent the spread of the deadly virus. The rate for workers above 15 years has been slowing since the lifting of the curbs. In the OctoberDecember 2022 quarter, the rate was 7. 2% similar to the rate in July-September 2022. Data released by the National Statistical Office (NSO) on Monday showed the unemployment rate for females in the 15 years and above category eased to 9. 2% in the March quarter from 9. 6% in the previous three monthperiod.
The strict lockdown had pushed the overall unemployment rate to 20. 9% in the April-June quarter of 2020, raising worries about the job situation. For males in the 15 years and above category, the unemployment rate slowed to 6% in the March quarter, and below the 6. 5% in the October-December period and lower than the 7. 7% in the January-March quarter of 2022.
The labour force participation rate, which is defined as the percentage of persons in the labour force (working or seeking or available for work) in the population, marginally improved to 48. 5% in the January-March quarter of 2023 quarter from 48. 2 % in the October-December period and above the 47. 3% in the January-March 2022 period. For females, it inched up to 22. 7% in the JanuaryMarch quarter from 22. 3% in the October-December 2022 period. The rate was at 20. 4% in the JanuaryMarch quarter of 2022.
The NSO released the quarterly bulletin of the Periodic Labour Force (PLFS) survey, which estimates labour force participation rate, the worker population ratio and the unemployment rate. The unemployment rate is defined as the percentage of persons unemployed in the labourforce.
Unemployment rate, State-wise
2001> 2011
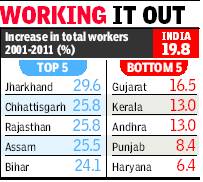
See graphic, ' Where 10% of households get at least 110 days of employment in a year: the best and worst states '
2012> 2016
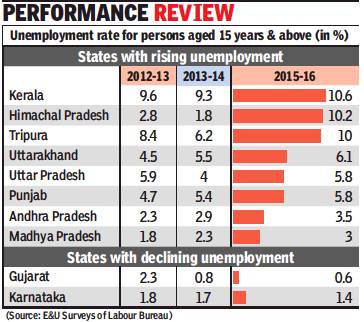
From: Swati Mathur, Govt hasn’t set any target for job creation: Minister, March 20, 2018: The Times of India
‘But Generating Employment Top Priority’
Labour minister Santosh Kumar Gangwar told the Lok Sabha on Monday that the government had not set a target for job creation.
In a written response to INLD MP Dushyant Chautala’s question on employment over the past three years, Gangwar said, “No target has been set by the government. However, the employment generation ... is the priority concern of the Government (sic).”
The minister said the government has taken steps to generate employment by encouraging private sector, fasttracking projects involving substantial investment and increasing expenditure on schemes like Prime Minister’s Employment Generation Programme (PMEGP), Mahatma Gandhi National Rural Employment Guarantee Scheme and Pt. Deen Dayal Upadhyaya Grameen Kaushalya Yojana (DDU-GKY).
In his question, Chautala referred to an International Labour Organisation report titled “World Employment and Social Outlook Trends – 2018,” which projected India’s unemployed population will rise from 18.3 million in 2017 to 18.6 million in 2018 and 18.9 million by 2019. The report stated the unemployment rate is expected to remain static at 3.5% during the same period.
The government, in its response, quoted annual labour force surveys of 2012-13, 2013-14 and 2015-16. The sharpest increase in unemployment rate was in Himachal Pradesh, from 1.8% in 2014-15 to 10.2% in 2015-16. The other two states with high unemployment rates were Kerala and Tripura, at 10.6% and 10%, respectively, in 2015-16.
While the government could not provide unemployment data for 2016-17 and 2017-18, Gangwar furnished the number of jobs created under PMEGP at 2.31 lakh in 2017-18, down from 4.07 lakh in 2016-17.
The government data also showed a slowdown in placements of persons with skills training.
2015> 17: 50% rise in MP
Deshdeep Saxena, Joblessness rises by 50% in 2 years in MP, February 10, 2018: The Times of India
The frenzied rush of nearly 3 lakh applicants for 738 peon posts was an indication. Now, figures from the employment exchange show the grim truth — unemployment is rising alarmingly in Madhya Pradesh.
Amid the pakoda wars, the number of educated jobless youth registering with the employment exchange has shot up from 15.6 lakh in 2015 to 23.7 lakh in 2017 — a shocking 53% in two years. The state economic survey, tabled in the assembly a day before the 2017 budget, painted a dismal picture, showing that only 129 people had got employment in 2016.
It’s an indication that the government’s attempts at creating jobs through industrialisation have not borne fruit, mostly because a significant percentage of MoUs signed by the government at global investor summits (GIS) failed to materialize, say sources.
2020-21
Saleem Pandit, April 19, 2021: The Times of India
In a clear indication that more and more Kashmiri youths are getting jobs, the unemployment rate of J&K for 2020-21 has gone below that of Delhi, Goa, Haryana and Rajasthan, reports Saleem Pandit. According to a survey conducted by Mumbai-based Centre for Monitoring Indian Economy, while Haryana’s unemployment rate for the period stood at 28%, Goa’s at 22%, Rajasthan’s at 19.7% and Delhi’s at 9.4%, J&K reported a much lower rate of only 9%.
This is significant considering J&K has put up such a stunning performance on the job front at a time when the entire country, including the Union territory itself, was reeling from the Covid-19 pandemic. Meanwhile, J&K government has notified more than 200 posts for physically challenged people.
North East India, Employment in
2001-11
Job scenario in most NE states alarming
More Workers Join Labour Force Than Jobs Are Created In Mizoram, Meghalaya, Arunachal
Subodh Varma TIMES INSIGHT GROUP
Made up of eight states and accounting for about 4% of India’s population, the northeast is better known for its separatist movements and incendiary ethnic conflicts. It has 25 Lok Sabha members, 14 of them from Assam, and so, does not draw serious attention from political parties involved in the national sweepstakes. The region receives huge funds from the central government that prop up the local economies. But simmering under the surface is a question that haunts everybody — what about jobs?
Census 2011 data released this year has some strange and disturbing trends on jobs in the northeast. If states were to be ranked by growth in jobs between 2001 and 2011, Tripura and Assam would figure among the top five states with 27% and 26% increases in total number of workers, respectively. But on the flip side, the growth in workers was just 4% in a decade in Mizoram – the lowest among all states. Three states — Mizoram, Nagaland and Sikkim — were below the national average of 20% growth in workers between the two censuses.
These growth rates may be deceptive because population has been growing in the same period. A better idea of how many jobs are being created can be had by deducting population growth rate from the increase in workers. This reveals a much more serious situation in the northeast.
Three states — Meghalaya, Mizoram and Arunachal Pradesh — show a decline in total workers. This means that more workers are joining the labour force than jobs are being created. Among these, Mizoram is facing a shocking crisis with a decline of over 19%. One factor could be that Mizoram is now an urbanmajority state – over 52% of its population stays in urban areas. So the buffer of agriculture is absent. Seen in the context of the fact that Mizoram has one of the highest literacy rates at 91%, this must be food for thought for policy makers both in Aizawl and New Delhi.
In two other states, Sikkim and Manipur, the adjusted growth rate plummets down to around just 4% in a decade. Tripura with 12% and Assam with over 8% perform creditably in comparison to the other states. Nagaland has the most bizarre situation – since the total population of the state has declined between 2001 and 2011 the two censuses, it shows a rise of nearly 15% in its workforce, adjusted to population.
Lack of growth in non-farm employment in most states, and the difficult hilly terrain, about 70% of which is under forest cover, are two key reasons why employment is stagnating in the northeast, says Bhupen Sarmah, director of the O K Das Institute, a Guwahati-based research institute. “It is an illusion to think that development will take place merely on the basis of injection of funds from the central government. The northeast receives a huge amount of this largesse but look what is the result,” Sarmah points out.
Sarmah may have a point, although it is also true that a lot of the largesse remains on paper. According to the ministry of development of north eastern region, a special non-lapsable fund created for financing projects in the northeast approved projects worth Rs 12,716 crore between 1998 and 2012. Sounds great, but there’s a catch — only about Rs 9,231 crore were actually released and state governments submitted utilization certificates for only Rs 5,641 crore. A Lok Sabha question recently revealed that about Rs 2,000 crore remains unspent from this fund every year between 2008-09 and 2010-11.
Another example is the national job guarantee scheme (MGNREGS) that promises 100 days of employment to anybody who demands. In some states it has become a mainstay of economic support, like in Mizoram with average 73 days of work provided and Tripura (87 days). The national average is just 44 days per household.
But some other states in the northeastern region are drastically lagging — Assam (25 days), Nagaland (35) and Manipur (37).
2021-23
Swati Mathur, Dec 18, 2023: The Times of India

From: Swati Mathur, Dec 18, 2023: The Times of India
Ladakh saw sharpest rise in jobless grads between ’21-’22 and ’22-’23: Govt
Kerala, L’dweep, Arunachal, Goa, Manipur, Mizoram Fare Better
New Delhi : The Union territory of Ladakh registered the sharpest increase in the number of unemployed graduates in India between 2021-22 and 2022-23 — a jump of over 16% in a year, the government said in response to a question in Parliament.
Apart from the hill territory, unemployment among graduates also rose in Puducherry, Andaman and Nicobar Islands, Dadra and Nagar Haveli, Daman and Diu, Meghalaya, Jharkhand, Chhattisgarh and Rajasthan during the period between 2021-22 and 2022-23, the government said. In reply to a question by Samajwadi Party MP Javed Ali if joblessness among graduate youths had increased, the government replied in the negative. Citing reports, Ali also asked if 42% Indian graduates under the age of 25 were unemployed in 2021-22. The labour ministry, however, did not respond to the question.
“As per the latest available annual PLFS reports, the estimated Unemployment Rate (UR) on usual status for grad uate persons of age 15 years and above was 14.9% and 13.4% during 2021-22 and 2022-23, respectively, which shows a declining trend in unemployment rate for graduate persons,” the ministry said. The marginal improve ment in all-India figures in 2022-23, the PLFS report suggested, is attributable to an improvement in the employment situation in some states and UTs, including Lakshadweep, Arunachal Pradesh, Kerala, Goa, Manipur and Mizoram, where the employment status of graduates appears to have improved in 2023, as compared to the previous year. The number of unemployed graduates also reduced in Bihar, from 20% to 16.6% in 2022-23, in Haryana from 18.4% in 2021-22 to 12.6% in 2022-23, and in Karnataka, where the number of unemployed graduates in 2022-23 accounted for 9.4% of the state’s population, down from 12.5% in the previous year.
Uttar Pradesh, with 11.3% unemployed graduates in 2021-22, registered a marginal improvement in the following year with the number settling at 11%, while J&K, with 22.8% unemployed graduates in 2021-22 saw a 4.5% drop in 2022-23.A persistent concern raised by several MPs in and outside Parliament, the issue of unemployment was most recently raised by opposition leaders, including Congress’ Rahul Gandhi after the Parliament security breach in which the two intruders who jumped into Lok Sabha chamber later claimed that they were trying to draw attention to the lack of jobs in the country.
Unemployment, disguised
The extent and nature of the problem/ 2017-18

From February 2, 2018: The Times of India
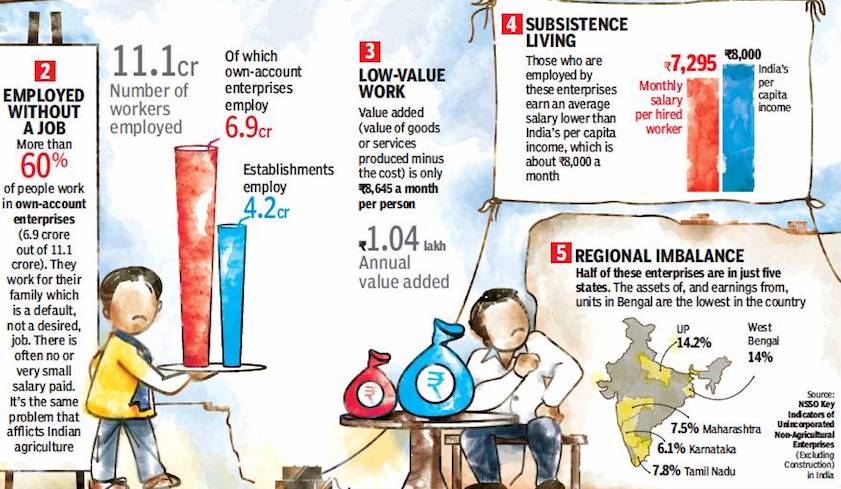
From: February 2, 2018: The Times of India
See graphics"':
The extent and nature of disguised unemployment in India, 2017-18-Part I
The extent and nature of disguised unemployment in India, 2017-18-Part II
1993 – 2022
Surjit S Bhalla, Oct 20, 2023: The Times of India

From: Surjit S Bhalla, Oct 20, 2023: The Times of India
There are two stylised Goldin gender gaps. First, that women participate less in market work than men. Second, when they do, they earn less than men. “Not equal pay for equal work.” In recognition for her work on gender performance, Claudia Goldin won the Nobel Prize for Economics on October 9. The prize was long overdue. I cannot think of a single male-female “question” which does not involve the pioneering contributions of Goldin.Goldin gender gaps have been a subject of inquiry for decades. Their importance has only increased. For example, just last year, IMF, known for its concern for matters like growth, inflation and debt decided to add a “new” subject to its armoury: gender disparities.Narrowing of gender gaps was considered macro-critical because of the contribution of a decline in these gaps to “growth, resilience, financial stability and income equality”. Out of the two gaps, the lower labour force participation rate (LFPR) for women has received the most attention in India. Indeed, its study has become somewhat of an industry after the NSS employment survey for 2011-12 showed a steep decline in female LFPR. Regardless of the work definition used, the decline in FLFPR compared to 2004-05 was more than 10 percentage points.With development, and education, the trend in LFPR has been upwards in most economies. Both economic growth and female educational attainment had increased rapidly in India between 2004-05 and 2011-12. So, what happened in the Indian labour market for females? Why did their FLFPR decline?Explanations abound. My favourite is that there was likely a definition change. Rural women who worked at home (collecting firewood, water etc) were counted as unpaid workers in 2004-05 (and hence in the labour force) and not counted as unpaid workers in 2011-12.
In any case, for more than a decade now Indian experts have been puzzled by the trend in FLFPR that seemingly has not followed the secular increase pattern so rigorously estimated, and forecast, by Goldin.Using the usual status definition of labour force (employed for at least 30 days) for the age-group 15-64, the accompanying table shows that LFPR for women, at 39.2%, is now within 5 percentage points of the 44% level observed in 2004-05; and 6.3 percentage points higher than the 2011-12 level of 32.8 %. For the age-group 25-64, and one not contaminated by school and college enrolments, FLFPR in 2022-23 is observed to be 45.6%.Regardless of the definition, FLFPR estimates for 2022-23 are very close to the 1993-94 estimates, thus confirming the Goldin ‘U’ shaped curve. The news on the wage gap is even more encouraging for the Indian economy. For ages 25-64, the gender wage gap is 30%. But this wage gap does not adjust for education, an important contributor to earnings. A strict control for education is available via looking at only college educated workers.For all unmarried college degree workers, the wage gap is almost non-existent – only 3% in 2022-23 (for the US, 6%). For all college educated workers (married or unmarried), the wage gap is just 16% (for the US, 20%). No matter how you slice the wage data, the Indian record is one of consistent improvement over the years, and of low wage gaps – for college-educated workers, the numbers are comparable, and likely better, than in several advanced countries. I was an executive director at IMF at the time it approved the gender macro-criticality framework for future IMF work. In the analysis, and the discussions, the Indian experience was highlighted for its shockingly “low” FLFPR, a conclusion largely based on the private CMIE-CPHS data.It was often mentioned how Indian FLFPR was lower than many Arab economies (whose rates are lower due to cultural reasons). What “excuse” did India have for a lower FLPR than even the Arab countries? This narrative is explicitly false and based on faulty data. In conclusion, there is a labour force participation gap in India, but its level has been declining and is today very close to the level observed during 1993-2004, when India had a more liberal definition of female work. The gender wage gap is low, and comparable to the best of the advanced countries, especially for college educated women. A record Indian society can be proud of, with room left for further progress.The writer is a former executive director, IMF. Views are personal
Periods and regions of good employment growth
2001-11: urban employment exceeds rural
For 1st time, urban areas pip villages in job creation
Subodh Varma TIMES INSIGHT GROUP
A fascinating, but worrying, picture of the way common Indians are earning their living emerges from recently released Census 2011 data. Urban areas have emerged as huge magnets for jobs, for the first time beating the rural hinterland in job creation in the past decade. Simultaneously, there is a rising dependence on short-term jobs, both in rural and urban areas, as regular full-term jobs fade away. The data also reveals huge differences in the kind of jobs men and women are getting. Clearly, India is going through a churning process, which will have far reaching effects on living standards, job related migration and gender relations.
More than half of the total 8 crore jobs created between 2001 and 2011 were located in urban areas, although the population staying in cities and towns is just a third of the total. This is a direct result of migration of people from unproductive farming in search of better prospects, supplemented by more areas getting defined as urban.
In the urban areas, women’s employment has seen a massive jump of over 74% since 2001, compared to just 38% for men. Women’s employment increased by over 1.2 crore in urban areas.
But the most significant feature is the creeping marginalization of jobs. Over 3 crore of the new jobs created in the past decade – 40% of the total – have been designated as ‘marginal’. This means that people work in these jobs for less than six months. A quarter of India’s 40-crore workforce is now subsisting on such marginal work.
While cultivation as the main occupation has declined by about 8% over the past decade, among marginal workers the picture is totally different. It has increased by 35% among male marginal workers, but declined by 20% among women. Seen in the context of the huge decline in main cultivators, it appears that men have been forced to work part time in their fields and part time either in others’ as agricultural labour or even in other kinds of work.
There appears to be a distinct shift towards what the census still persists in calling ‘other’ work – industry and services. And the vast bulk of these jobs are being created in cities and towns. Main workers in ‘other’ work jumped by 38% over the past decade compared to a measly 10% increase in rural areas. This is not surprising as most industries and service related jobs are located in urban or periurban areas (areas adjoining urban areas). Even here, the share of short- term workers in these ‘other’ jobs increased by a jaw dropping 84%.
2011-12: small towns as hubs
The Times of India May 24 2015
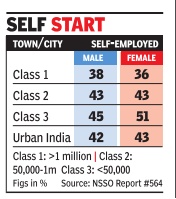
Subodh Varma
Small towns beat metros as job hubs
Smaller towns are surging ahead as hubs of jobs and entrepreneurial activity, beating larger cities and even metropolises. While industrial activity declines in big cities, smaller cities and towns are picking up the slack, often displaying a preference for manufacturing at the cost of the services sector. Construction is booming and related jobs are more to be found in smaller towns.These are some of the facets of urban India revealed in a recent NSSO report on employment in cities. Among Class III towns those with a population less than 50,000 nearly 45% of male workers and over 50% of female workers were self-employed. In big cities with a million-plus population, the proportion of self-employed was about 36-38% for both men and women. Self-employed includes very small industrial or service sector units as well as shops.
Salaried jobs up
Compared to 2004-05, in 2011-12, the latest year for which this data is available through NSSO survey reports, there has been a general decline in self-employment while regular wage or salaried employment has gone up in all sizes of cities and towns.
In big million-plus cities, a high 55% of men and 58% of women in the workforce were getting a regular wage or salary . This percentage was below 50 a decade ago. Life is more uncertain and livelihood a work in progress, as one descends the ladder of towncity size. Because, one step down, in Class II cities with population less than one million but more than 50,000, the proportion of salaried workers is 41-43% for both men and women. In towns with less than 50,000 population, the proportion of salaried sinks to just 34% for men and 27% for women.
More jobs for women in small towns
But smaller towns and cities are perhaps going through an evolution that big cities saw a couple of decades earlier. Between 2004-05 and 2011-12, male employment in the tertiary or services sector expanded in million-plus cities from 61 to 63% while industrial employment de clined from about 38 to 36%. But in Class III towns, service sector jobs declined from 53 to 51% while industrial jobs increased from 32 to 35%.For women, the changes were more drastic with industrial jobs declining from nearly 34% in big cities to 29 % but zooming up from 29 to 38 % in small towns.
The smaller the town, the more it is tied up with the rural economy , which provides jobs to an increasing proportion even from urban areas. In towns below 50,000 population, a quarter of the female workforce and about 14% of male workers still worked in agricultural operations, which are physically close and tightly intertwined with the small-town economy . In million-plus cities, just 2% of the female workforce and less than 1% of male workers were involved in agriculture, mostly at the geographical fringes of the metropolises.
The decline of female employment opportunities in these years has led to an increase in urban women working in agricultural activities with their proportion rising from about 18% to 25% in Class III towns. Male participation in agriculture in urban areas has remained stagnant or declined.
Casual labour by men appears to have increased in smaller towns although it has declined for women. In small towns, share of men doing casual work was 19% in 200405 which inched up to 21% in 201112 although the corresponding share of women in casual work dipped from 23 to 22%.
Formal sector
20% of women moved from informal to formal sector: 2010- 2019
Priyangi Agarwal, August 26, 2021: The Times of India
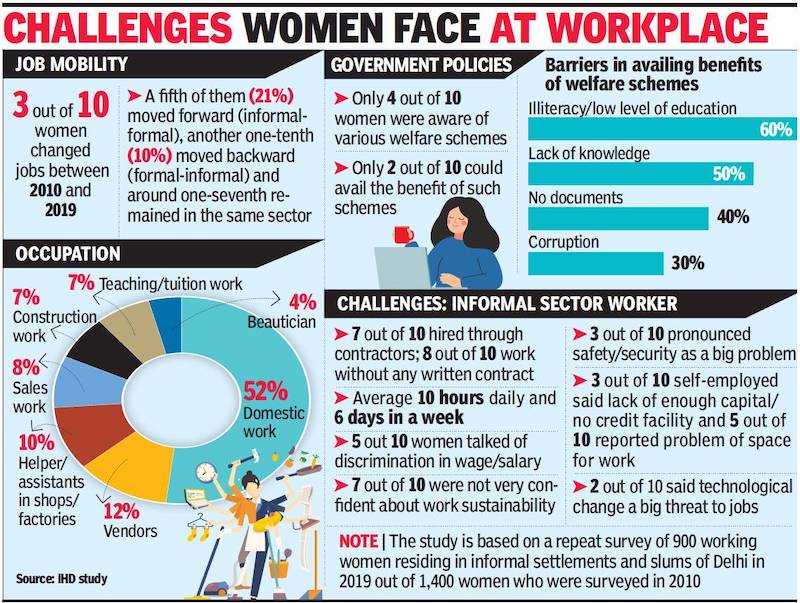
From: Priyangi Agarwal, August 26, 2021: The Times of India
A study conducted by the Institute for Human Development (IHD) on women working in the informal sector in Delhi found that one-fifth of them migrated from the informal to the formal sector between 2010 and 2019. This study is based on a repeat survey of 900 working women of the original 1,400 women contacted in 2010.
According to the study, three out of 10 women changed their job between 2010 and 2019. “Women moved out from construction labour, domestic work and vending and moved into sales workers, tuition or teaching, beautician and helper or assistant in offices and factories,” says the study, which was shared at a webinar on ‘Women’s work in Delhi: Dimensions, challenges and emerging issues’ organized by Institute of Social Studies Trust and IHD.
The study suggests that women who are more experienced, possess higher educational qualifications and belong to higher income groups, are upper caste and non-migrants have a bigger probability of mobility from informal to formal sector compared with other groups. It says that education qualification (graduates have 3.5 times higher probability than unlettered women) and experience are the two most important factors of mobility from the informal to formal sector.
Among the challenges faced by the workers in the informal sector are poor working conditions, long working hours, lack of safety or security, lack of credit facility and space to work and changing technologies. The study says only four out of 10 women were aware of various welfare schemes of the government. “Many women engaged in the informal sector are unable to benefit from the several government schemes due to lack of documents or the cumbersome processes,” said Balwant Singh Mehta, who conducted the study.
Professor Alakh N Sharma, director, IHD, said, “As across India, women workers in Delhi are also overwhelmingly in vulnerable employment such as domestic work and vending. Providing such informal workers with social security driven largely by the government should be an important policy agenda.”
2014: Employment rate of Indians hits record high
The Times of India, Nov 02 2015
Kounteya Sinha
Employment rate of Indians in Britain hits record high
The employment rate of the Indian community reached a record high at 71.6% in Britain in 2014 . The employment rate of Pakistanis and Bangladeshis jointly was only 51%, while that of the Chinese was 56%.
This means 784,000 Indian people were at work in Britain, an increase of 32,000 from the previous year and 238,000 more since 2005. Of these, over 100,000 people from the Indian community run their own businesses in the UK.
As against Indians, only 560,000 Pakistanis and Bang ladeshis held jobs in 2014, while the number was as low as 135,000 among Britain's Chinese community .
The rate at which Indians in the UK are getting jobs has left all other ethnic minority groups behind. In 2006, 600,000 Indians aged 16 years and over were employed.
The number increased to 638,000 in 2008, 671,000 in 2009 and 692,000 in 2010. In 2011, it was 712,000 which rose to 752,000 in 2013.
Indians in UK were also recently found to be the most prosperous among all minority groups.
2016; 2017-19: unemployment on the rise

From: Dec 2, 2019: The Times of India
See graphic:
2017-19: unemployment on the rise
2017: MNC tech hiring increases 29%
Sujit John, MNC tech hiring jumps 29% in 2017, February 20, 2018: The Times of India

From: Sujit John, MNC tech hiring jumps 29% in 2017, February 20, 2018: The Times of India
In India’s technology space, the biggest increases in hiring and the highest salary increments are now happening in the engineering and R&D arms of MNCs.
Hiring in the segment increased by 29% in 2017, the highest increase in recent years, and nearly 2 percentage points more than in 2016, according to consulting firm Zinnov’s latest annual study of HR trends in what is referred to as the global in-house centre (GIC) space. The study is based on a survey of 43 GICs across India. There are nearly 950 MNCs with over 1,200 R&D and engineering centres in India.
The study does not say how many employees are in the sector, but a survey for 2016 had estimated the strength then to be 8,15,000. Some estimate the current strength to be close to a million (10 lakh).
The GIC hiring growth rate is significantly more than that in the Indian IT sector, where headcount growth is now estimated to be lower than that of revenue, which is about 8%. The gross hiring in top IT services companies is growing between 5% and 10% annually, while net hiring (which excludes those who quit) is barely growing.
GIC salary increments in 2017, though slightly lower than in 2016, were more than twice that in major Indian IT companies. While the average increase was 5% in Infosys and Wipro, the average for the surveyed GICs was 11.2%. It was as high as 14% for junior employees and 12.6% for mid-level employees. For senior executives, it was 10.5% and for top executives, it was a shade over 9%.
However, these increments were slightly lower than in 2016. Anand Subramaniam, engagement manager & delivery head in Zinnov, said this may be partly because the startup bubble of 2016 had forced everybody to offer big increments that year.
The slew of new digital technologies — including cloud, analytics, machine learning, artificial intelligence, internet-ofthings, and robotics — are forcing global corporations to enhance their engineering strengths and build new solutions, partly to take on the challenge from new-age ventures who are not burdened by legacy technologies. And the only location where they can find engineers on the scale required, and with requisite skills, is India. Numerous global retailers, for instance, have in recent years established centres in India to develop new tech that can help them fight Amazon.
2018: Cities with the most technology jobs
June 11, 2018: The Times of India
HIGHLIGHTS
According to data a job site, 22 per cent of all job postings in the technology sector originates from Bengaluru, while Delhi-NCR accounts for 11 per cent and Pune (10 per cent)
Other top cities in technology jobs include Hyderabad (9 per cent), Mumbai (8 per cent), Chennai (7 per cent), Mohali (4 per cent) and Ahmedabad (3 per cent)
Bengaluru is the leading city for those seeking job opportunities in the technology sector, followed by Delhi-NCR and Pune in the second and third place, respectively, says a report.
According to data from Indeed, a leading job site, 22 per cent of all job postings in the technology sector originates from Bengaluru, while Delhi-NCR accounts for 11 per cent and Pune (10 per cent).
"Aptly named the Silicon Valley of India, it comes as no surprise that Bengaluru continues to lead in terms of job opportunities in the technology sector, given that it has in the past been the home ground for several startups," the report said.
Other top cities in technology jobs include Hyderabad (9 per cent), Mumbai (8 per cent), Chennai (7 per cent), Mohali (4 per cent) and Ahmedabad (3 per cent).
While the actively job seeking age group of 20-29 year old continue to show a relatively high level of interest in the technology sector, the age group is also the most actively hired. Interestingly, senior job-seekers above the age of 55 are also showing significant interest in the sector.
Conversely, the 40-49 age group shows the least interest in the sector.
According to a previous study by Indeed, Bengaluru is also the leading city in India for jobs related to blockchain, an upcoming segment in the technology space.
"Today organizations must keep constantly evolving in order to keep pace with the advent of new technologies, be it artificial intelligence, machine learning, or big data analytics," said Sashi Kumar, Managing Director, Indeed.
High growth and job creation
LIVELIHOODS - High growth not enough for job creation
Atul Thakur The Times of India Sep 23 2014
Rapid increase in the GDP has not ensured that jobs are created just as fast. The quality of employment also remains a matter of concern
After years of low growth, the In dian economy is showing signs of recovery . But the big ques tion remains -will a return to high growth, if that happens, also mean rapid job creation?
Data suggests this does not follow automatically. Between 2004-05 and 2009-10, a period that saw three successive years of 9%-plus growth, data from the National Sample Survey Organisation (NSSO) showed virtually no growth in employment. Jobless growth is a real threat. The NSSO survey indicates that India's labour force was between 440 million to 484 million in 2011-12. The lower number indicates people who looked for work every day, while the higher points to those who joined the workforce at some point in the year. The data shows that 416 million of the 440 million who looked for work on a daily basis were employed at the time of the sur vey, meaning about 25 million remained unemployed.
Even what employment is available tends to be of low quality. In 2011-12, NSSO data shows, only 18% of working people had regular wagesalary employment.Roughly 30% were casual labourers, dependent on daily or periodic renewal of job opportunities. The remaining 52% were self-employed. Most of them were in agriculture, working as helpers in familyowned businesses without salary .
Much of the workforce in advanced economies is employed on regular wage salary. In the US, UK, Japan and Germany , roughly 90% of the workforce are regular wagesalary earners. World Bank's World Development Report, 2014, shows that the average proportion of people with regular wage employment in India's workforce was 17% during 2001-10. This was only 2% higher than in the previous decade.Evidently , the benefits of high GDP growth haven't helped most workers.
Estimates on employment in organised and unorganised sectors confirm India's dire situation. The unorganised workers social security act, 2008, defines unorganised workers as those who are home-based, self-employed or are wage workers in the organised sector not covered under labour welfare acts. This category is estimated to constitute more than 90% of the workforce.
As for the self-employed, there's reason to believe this category has a large element of disguised unemployment. This becomes clearer when we see the sector-wise employment and income patterns. In 2011-12, agri culture, forestry and fishing contributed 18% to overall GDP but employed 49% of the workforce. The secondary sector ¬ manufacturing, mining, electricity and construction ¬ had a share of 27% in GDP and 24% in employment. Services, dubbed engine of India's GDP growth, accounted for 55% of the total national output but employed a meagre 27% of the workforce. . Much of the `employment' in agricul ture -or even in small self-owned shops -is as a fallback in a distress situation in which jobs are not available and the absence of a social security net means the poor cannot afford to be unemployed. Rural job guarantee scheme NREGA , signalled a recognition of this reality and sought to provide relief.
However, it has not been able to provide work for the promised 100 days a year to most households. In 2013. 14, only 9% of households who sought it could get work for 100 days. The average was 43 days per household. The scheme focuses on unskilled work. The problem of skill development enabling labour migration to services remains inadequately addressed. India's employment crisis is marred by social issues which don't allow women to join the labour force. While over 55% of men was available in the labour force at some time in the year, according to NSSO, only 22% of women were available for work. That women are often paid lower wages than men for doing the same work does not help gender parity, either.
Job creation and the states
2001-11: Poorer states create more jobs
Subodh Varma | TIMES INSIGHT GROUP 2013/06/17
Most of the poorer, less industrialized states like Jharkhand, Chhattisgarh and Bihar appear to have done well in increasing their work force in the past decade according to recently released Census 2011 data. Surprisingly, richer or more urbanized states like Punjab, Haryana and Kerala have lagged far behind in job creation. But if you take away natural population growth, the picture changes dramatically.
It becomes clear that the workforce increase in the poorer states is mainly because of their higher than national aver- population growth. But again surprisingly, the richer states still remain at the bottom of job creation rankings. In terms of increase in total workers’ population, the top five states were Jharkhand, Chhattisgarh, Rajasthan, Assam and Bihar, counting only major states, that is, those with over 2 crore population. The increase in their respective workforce was considerably higher than the national average. The states with the least increase over the past decade were Haryana, Punjab, Andhra Pradesh, Kerala and Gujarat.
UP, Bihar: least job creation
Since there is a natural growth in population, these figures do not give a correct picture of the changes in job opportunities in these states. Arough idea of what is the actual change in employment can be had by deducting the growth in population from the growth in workers. This reveals that Orissa, Assam, Kerala, Jharkhand and Rajasthan are the top five states in terms of job creation during 2001 and 2011.
While Orissa, Assam and Kerala appear to benefit from a much reduced population growth rate, Jharkhand and Rajasthan seem to have genuinely boosted jobs creation. After adjusting for population growth, the states with least job creation were Haryana, Punjab, Gujarat, Bihar and Uttar Pradesh. The latter two were hamstrung by still high population growth rates but the other three are laggards in job creation, reflecting stagnation and increased mechanization. These three also showed an absolute decline in the female workforce over 2001 and 2011. Census counts short term workers – those doing less than six months' work in a year – separately.
A look at how the cookie crumbles across the states in terms of short term work and longer term, more regular work throws up some bizarre results. While Maharashtra, Assam, Karnataka, Rajasthan and Gujarat created the most long term workers (‘main workers’), Bihar, Jharkhand, Punjab, West Bengal and Orissa added the least. On the other hand, short term, marginal workers increased by a jaw dropping 93% in Bihar, followed by Jharkhand, Chhattisgarh, Orissa, UP. This is the fragile nature of job growth in states which may appear to be adding jobs in the past decade.
The rural-urban divide is starkly shown up in job creation, reflecting the doldrums that Indian agriculture is in. Across India, rural job growth was just 13% compared to 44% in urban areas. Some of the most agriculturally advanced states like Haryana and Punjab showed a decline in rural workforce while others like Andhra Pradesh and Gujarat had very small increases. The situation flips for urban areas where most states showed a healthy increase in the workforce. But Punjab, along with the two most urbanized states in the country, Tamil Nadu and Maharashtra, still remained at the bottom.
B: OTHER ISSUES
Blue collar labour force
A profile of Blue collar workers in Delhi-NCR: 2018
Rachel Chitra, Delhi at No. 2 in blue-collar workforce, March 14, 2019: The Times of India
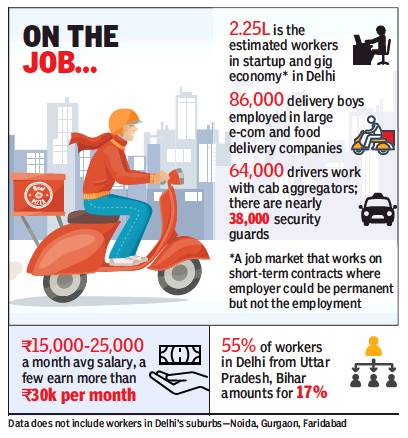
From: Rachel Chitra, Delhi at No. 2 in blue-collar workforce, March 14, 2019: The Times of India
Majority Of Migrant Workers From UP; B’luru Leads Chart
Next to Bengaluru, Delhi employs the secondhighest blue collar labour force in India. The city employs 2.3 lakh blue collar workers in startup/urban-centric jobs that have been created because of the new-age gig economy model, according to a survey from blue-collar job aggregator BetterPlace, which sourced data of 11 lakh respondents.
Workers in construction, manufacturing, agriculture, healthcare, and other traditional sectors have not been included in the survey. Independent businesses, SMEs and MSMEs are also not included and the data is limited to jobs sourced via large tech-aggregators/startups.
And the split-up for Delhi is Amazon, Flipkart, Zomato, Swiggy, Food Panda and others employ 86,019 delivery boys while the likes of Ola, Uber, other taxi aggregators employ 64,514 drivers. About 37,633 work as security guards, 26,881 facility personnel, 2,688 beauticians, 2,707 maintenance workers and 5,376 pre-school workers in the capital. Compared with Delhi, Noida and Gurgaon employ less individuals. Noida employs 85,460 blue-collar workers, while Gurgaon employs 50,690 workers.
The majority of blue-collar workers (35%) earn Rs 15,000-25,000, but there is a percentage of workers who make more than 30K a month. On average, 14% of blue-collar workers at startups earn Rs 30,000 a month; about 16% earn Rs 25,000-30,000; about 20% earn Rs 20,000-25,000 and 15% make Rs 10,000-15,000.
When it comes to the age group, the ratio is skewered towards youngsters. About 64% of the blue-collar workforce pan-India is between the age 24 and 38 years, 16% between 18 and 23 years, 10% between 39 and 43, 8% between 44-54 and 2% above 52 years of age. Pan-India, 96% of the workforce in blue-collar jobs is male, with only certain sectors like the beauty and services sector having a higher percentage of women.
And where does Delhi gets its migrant labour force from? Delhi gets as high as 55% of its workforce from Uttar Pradesh, 17% from Bihar, 6% from Haryana and 5% from Rajasthan, followed by Kerala (3%), Madhya Pradesh (3%), Uttarakhand (2%), Jharkhand (2%), West Bengal (1%), Punjab (1%), etc. When it comes to a city-wise split-up, Loni is the highest contributor to Delhi's workforce at 3.2%, followed by Aligarh (1.5%), Mainpuri (0.9%), Chapra (0.75%).
“Of the 14 lakh urban workers in metros, there is a 4% high-earning aspirational set of workers, who takes up two or more jobs to earn higher. This trend, we see more in Delhi and Mumbai. We have interviewed a plumber, who works an 8-hour shift for an MNC during the day and drives an Ola car by night. We have also interviewed Ola drivers, who start out with one car. Earn enough to buy more cars and today run a fleet of 4-10 cars. Upskilling also happens a lot in Delhi, where delivery boys take courses and acquire skills to become warehouse managers, accountants or supervisors," said Pravin Agarwala, CEO and cofounder, The Better Place.
Another trend from Delhi is that Delhi is not a supplier of migrant labourers. It is more a dominant employer of migrant labourers. When it comes to supply of migrant workers to other states - the top states are Uttar Pradesh (17%), Andhra Pradesh (17%), Assam (13%), Odisha (11%), Bihar (11%), West Bengal (4%), followed by Rajasthan (3%), Tamil Nadu (3%), Jharkhand (3%) and Delhi (3%).
Changing jobs (job hopping)
2017: Indians change employers more frequently
April 6, 2018: The Times of India
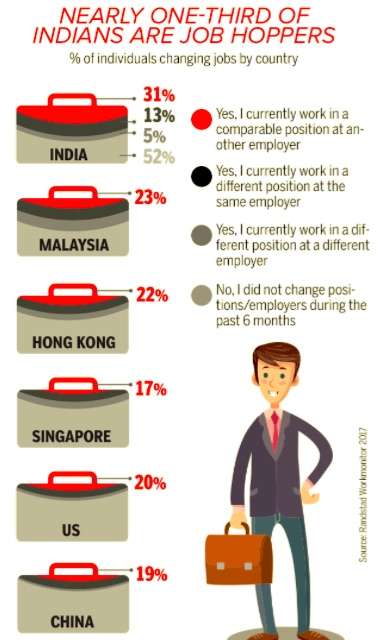
From: April 6,2018: The Times of India
When it comes to switching jobs, Indians is way ahead of others. More than 30% of Indians changed jobs in the previous six months — that’s far higher than most other countries —though over 50% worked with the same employer. Here's more:
Double income households
2011
Census busts urban myth, finds Bharat has more DINKs
Subodh Varma
The Times of India Aug 31 2014
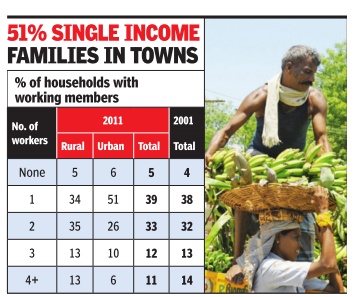
Rural Figure Is 42% Compared To 22% In Cities
With all the buzz around double-in come power couples, it is easy to believe that more and more urban families have given up the sole breadwinner model of the past. But that would be a mistake, as just released Census 2011 data shows.
An overwhelming 51% of urban households live on the income of a single earner, while double-income families are a distant 26%. In rural areas, the situation is quite different. While 34% of families have a single worker, double-worker families are slightly more at 35%.
In fact, the double-income-no-kids (DINK) lifestyle celebrated as a cosmopolitan aspiration is prevalent in nearly 42% of two-member rural families compared to just 22% of similar urban families.
If you combine the rural and urban figures, here is what emerges for the India picture: 39% of households sustain themselves on the income of a single working member while 33% depend on two workers. This is not too different from a decade ago, when Census 2001 had revealed that 38% of households had a single breadwinner while 32% had two working members.
Perhaps this is because rural families are bigger and so more members are able to work? Not true. In urban ar eas, nearly three quarters of families have 3-6 members. In rural areas, 66% are in this range. Clearly , this size is the most predominant one in both rural and urban areas. About 17% of families in rural areas have 7-10 members compared to nearly 13% in urban areas.
Two inter-related factors drive rural families towards multiple persons going out to work. The primary reason is economic necessity . Average rural income is estimated at a meagre Rs 6,307 per month for a typical household by the most recent consumer expenditure survey in 2011-12 done by the National Sample Survey Organization. In inflationadjusted terms, rural incomes have increased by a paltry 2% per year. So families need to supplement their incomes. In urban areas, average household income is Rs 11,394 for a typical sized household, and it has increased by a slightly better 3% annually . Alongside economic necessity, the second factor that tilts the balance for multiple worker families in rural areas is women workers. Census 2011 data had earlier shown that the share of working women in rural areas was 35% compared to just 21% in urban areas. This is despite the drastic drop in women’s employment in the past few years. For a variety of cultural, economic and security reasons, most women in urban families are not gainfully employed outside their homes, causing dependence on a single income.
In rural areas, efforts by families to supplement their incomes do not meet with much success because about a third of multiple workers are getting jobs for only up to six months. In urban areas, the proportion of such marginal workers is much lower at 12% to 20%. Marginal workers usually get irregular work for very low wages.
Education levels and employment, unemployment
2004-18: education, gender and urban/ rural
Surojit Gupta, June 2, 2019: The Times of India
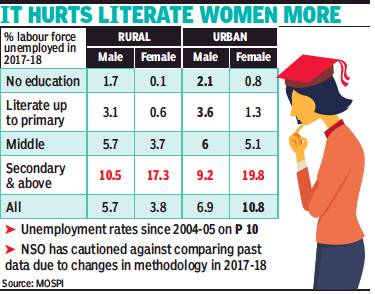
From: Surojit Gupta, June 2, 2019: The Times of India
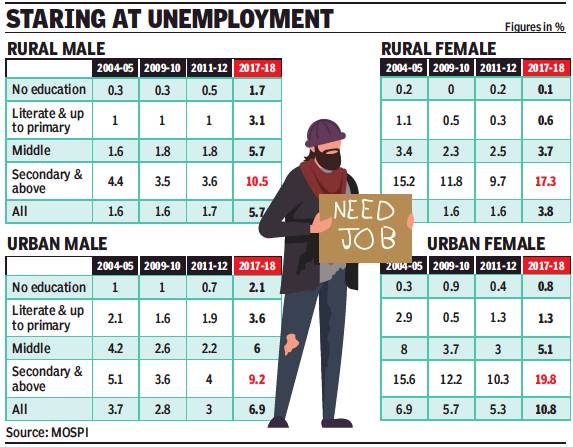
From: Surojit Gupta, June 2, 2019: The Times of India
It’s now official: Joblessness rises with education level
‘Minimum Edu Needed For Organised Sector Jobs Coming Down’
New Delhi:
Only 2.1% of illiterate urban men were unemployed in 2017-18, but 9.2% of men with at least secondary education didn’t have a job. The gap was even wider among urban women — 0.8% of those uneducated were jobless whereas 20% of women with secondary or higher education were not employed.
The Periodic Labour Force Survey (PLFS) released by the National Statistics Office (NSO) on Friday shows the unemployment rate (% of labour force without a job) rising by up to four times between urban women who have only middle-school education and those educated up to secondary school or more (see table). Unemployment in rural areas shows a similar pattern, though the degree of skewness is less.
The unemployment rate didn’t rise only with education level, it has also risen over time. The NSO’s Friday release also provides unemployment data for 2004-5, 2009-10 and 2011-12, adding a caution that past data shouldn’t be compared with 2017-18 figures because of several methodological changes introduced in the latest round of the survey. Even if exact figures are not to be compared across the four years, the broad trend across time is of rise in joblessness with level of education. “It’s not a surprise, we have known of the rising phenomenon of educated unemployment for some time. It’s just an official confirmation,” said Pronab Sen, former chief statistician of India.
Mahesh Vyas, CEO of Centre for Monitoring Indian Economy, says, “A generation ago it was inconceivable to get a job in the organised sectors without a graduation degree. Today the minimum education required to get a job in the organised sectors is much lower and is dropping.” CMIE has been conducting monthly job surveys since a few years. The PLFS report defined educated persons as those who have attained educational level of secondary and above.
‘15 may be too young an age to check for unemployment status’
The study among the educated is restricted to persons of the age of 15 years and above. Some experts believe 15 may be too young an age to check for employment status, especially in urban areas.
“It is possible that the unemployment rate should be higher in younger age brackets as a typical educated urban youth may not even start working before 23 to 24 years until he or she completes postgraduation,” says Soumya Kanti Ghosh, group chief economic adviser at Stae Bank of India .
For the survey, a person aged between 15-29 years was considered as a youth.
Eligibility for employment
1991-2018: salaried, agricultural employment
July 6, 2019: The Times of India
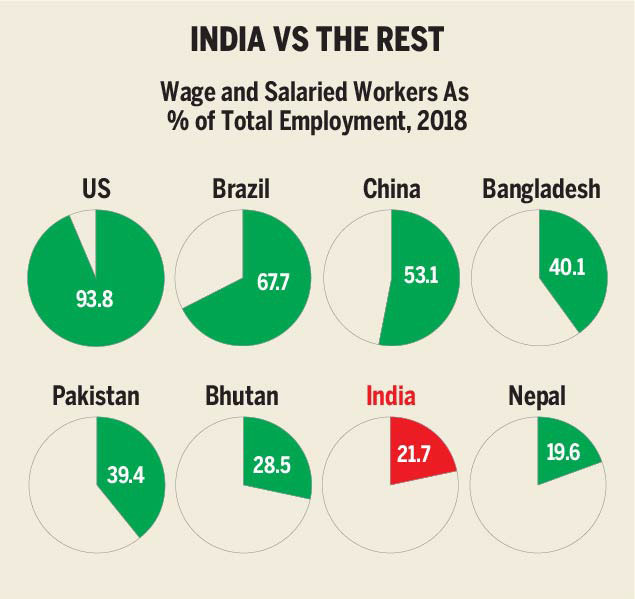
From: July 6, 2019: The Times of India
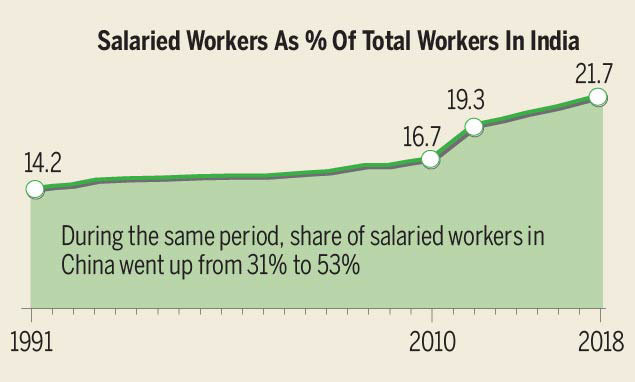
From: July 6, 2019: The Times of India
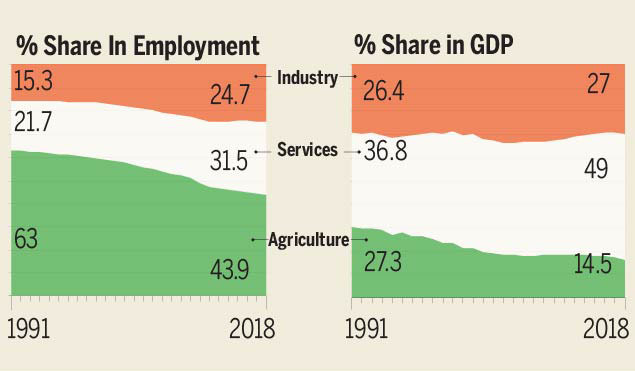
From: July 6, 2019: The Times of India
Why bad employment is a bigger problem than unemployment
When jobs are scarce, being employed is a blessing. But how many employed Indians have a job that the International Labour Organisation (ILO) defines as ‘decent’? In a global comparison of such jobs, India shows up very poorly. One of the constituents of decent employment is percentage of wage and salaried workers in the total workforce. India’s percentage is lower than even its less developed neighbours. This is the fallout of having a large informal sector and still-very-rigid labour laws.
SLOW IMPROVEMENT
Compared with many other countries, India’s share of wage and salaried workers in the overall workforce has been abysmal. While there has been a modest improvement, especially after 2010, it pales next to China’s, where the share of formal sector employment has crossed 50%.
LESS LABOUR
An explanation for low share of decent employment is the income-employment skew among three sectors of the economy — large and fast-growing sectors (services) are not creating enough jobs for people stuck in the small and shrinking agriculture sector.
ILO defines decent jobs as those that ensure dignity, equality, fair income and job safety. Wage and salaried employment is one of the indicators of decent employment. Workers should hold employment contracts with basic remuneration that is not dependent upon the revenue of the unit for which they work.
1991-2018: employment in industries
July 2, 2019: The Times of India
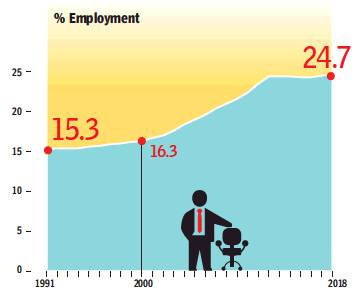
From: July 2, 2019: The Times of India
The Four Asian ‘Tigers’ — Hong Kong, Singapore, South Korea and Taiwan — as well as mainland China were lucky that the transition of their workforce from agriculture to manufacturing happened when manufacturing was still labour-intensive across the world. India’s liberalisation, however, saw massive automation of manufacturing, so there was no smooth shift of workforce from agriculture to industry. Despite this, there has been a steady increase in employment in this sector.
See graphic:
1991-2018: percentage of Indians employed in industries
As an engineer, 2014-17
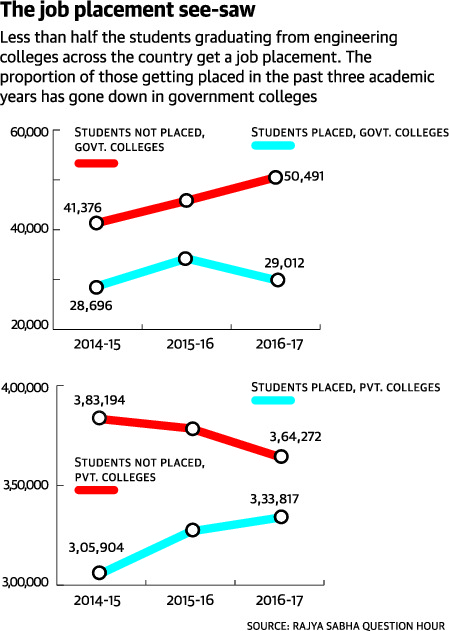
From: July 27, 2018: The Hindu
See graphic:
Number of students graduating from engineering colleges getting job placements in government and private colleges respectively, 2014-17, year-wise
As a lecturer
August 11, 2008
SC solves degree puzzle
Degree-holder in Pol Sc eligible to be a lecturer in Public Admn and vice versa
Dhananjay Mahapatra | TNN
FROM THE ARCHIVES OF ‘‘THE TIMES OF INDIA’’: 2008
The Supreme Court has ruled that a degree holder in political science is eligible to become a lecturer in public administration and vice versa.
This important ruling came from a Bench comprising Justices Altamas Kabir and Markandey Katju, which demolished a wedge driven by the apex court in 2001 between the two subjects, treating them as distinct and separate. Dr Rajbir Singh Dalal, who had a masters degree and PhD in political science, was appointed as reader in public administration by the Chaudhary Devi Lal University, Sirsa.
It was challenged in the Punjab and Haryana High Court by a person citing a 2001 judgment of the apex court in Bhanu Prasad Panda vs Sambalpur University, in which it was held that public administration and political science were two separate disciplines. The HC, relying on the SC judgment, cancelled Dalal’s appointment. To arrive at the conclusion, the HC further relied on Regulation 2 of the University Grants Commission (UGC) Rules which state that for appointment to the post of a reader, the candidate must have to be qualified in the relevant subject.
With two sets of disadvantages loaded against him, Dalal moved the apex court. Both Justices Kabir and Katju arrived at the same conclusion, using different routes, to rule that the 2001 judgment was a mere assertion and could not be taken as a precedent. Aided by the support of the UGC which said that the two subjects were inter-linked, Justice Kabir said that in 2001, the apex court did not have the benefit of the UGC’s view and had arrived at the conclusion on the basis of a personal understanding of public administration and political science.
Once the expert bodies had indicated that Dalal, who held a PG degree in political science, was rightly appointed to the post of reader, it was normally not for the courts to question such opinion, unless it had specialised knowledge of the subject.
The 2001 decision of the apex court did not reflect the reason for which the two subjects were not treated to be interlinked, he said and agreed with Justice Katju that expert opinion on such issues should get primacy from the courts.
Quality of work/ employment
The Just Jobs Index, 2019
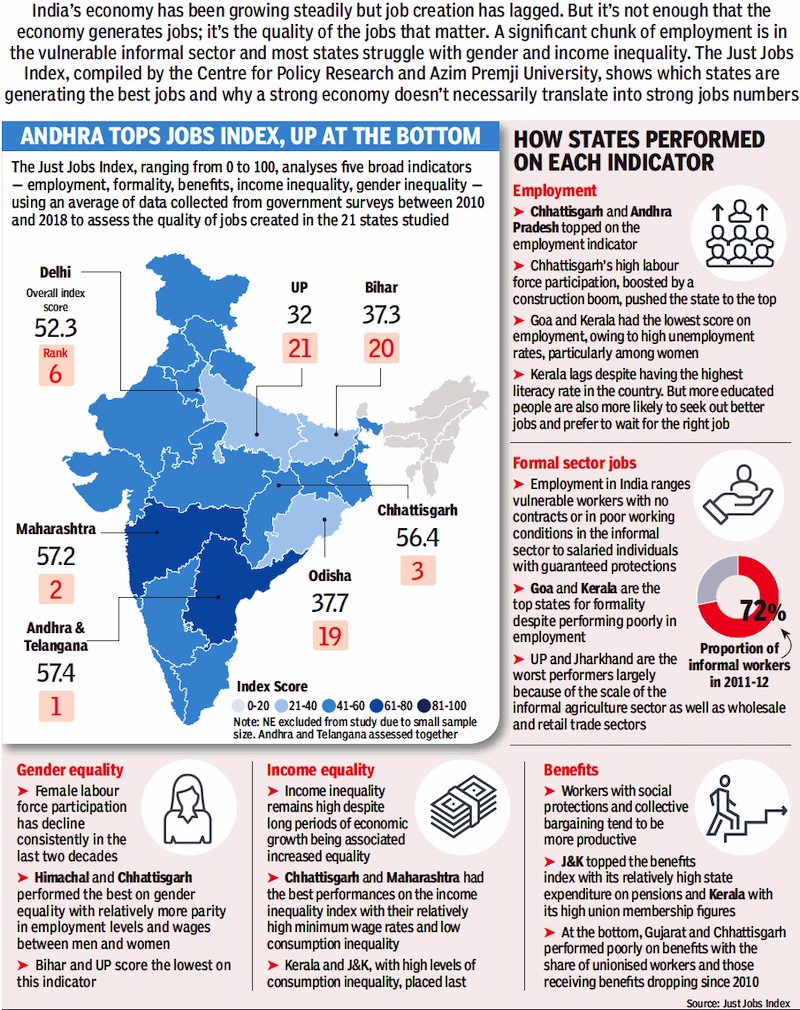
From: June 29, 2019: The Times of India
See graphic, 'The quality of work/ employment in India and the states of India, according to The Just Jobs Index, 2019'
Region-wise
2024, Jan-March/ urban areas
Surojit Gupta, May 24, 2024: The Times of India

From: Surojit Gupta, May 24, 2024: The Times of India
New Delhi : Kerala had the highest unemployment rate in the 15-29 age group in urban areas in the Jan-March quarter of 2024, while Delhi had the lowest joblessness rate among 22 states and Union territories, according to the latest Periodic Labour Force Survey (PLFS) released by the ministry of statistics and programme implementation (MOSPI). J&K, Telangana, Rajasthan and Odisha were among the five states with the highest unemployment rates in the 15-29 years category, the survey showed.
Overall joblessness rate for the period for this category was at 17%, higher than the 16.5% in the Oct-Dec period and marginally below the 17.3% in Jan-March 2023.
Joblessness rate for all age groups for the Jan-March quarter of 2024 has been estimated at 6.7%, slightly higher than the 6.5% in the OctDec quarter but marginally below the 6.8% in the JanMarch quarter of 2023.
Three out of the 22 states and UTs recorded unemployment rates in single digits — apart from Delhi (3.1%), the other states were Gujarat (9%) and Haryana (9.5%). The other two states among the five with low joblessness rates were Karnataka (11.5%) and Madhya Pradesh (12.1%).
Double-digit joblessness rate has been a sticky issue in the 15-29 age group for a significant period now. The rate had surged sharply during the Covid-19 pandemic. PostCovid, it slowed but still remains a problem area for policymakers battling to create fresh job opportunities for those entering the workforce.
The data also showed that the unemployment rate for women was the highest in J&K at 48.6%, followed by Kerala (46.6%), Uttarakhand (39.4%), Telangana (38.4%) and Himachal Pradesh (35.9%). The overall female unemployment rate in JanMarch quarter was at 22.7%, marginally higher than the 22.5% in the Oct-Dec period and slightly lower than 22.9% in Jan-March 2023 The quarterly PLFS survey measures joblessness rate, labour force participation rate and worker population ratio. The unemployment rate is on the basis of the current weekly status (CWS). Under the CWS, a person is considered ‘unemployed’ in a week if he or she did not work even for one hour on any day during the refer- ence week but sought or was available for work for at least one hour on any day during the reference week, according to the PLFS.
Religion-, caste-wise
2016-24
Udit Misra, May 30, 2024: The Indian Express
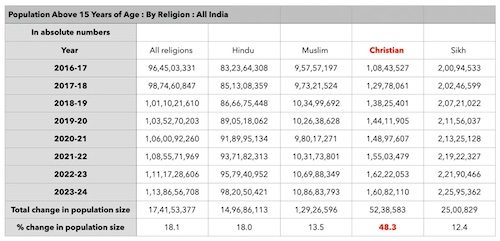
From: Udit Misra, May 30, 2024: The Indian Express
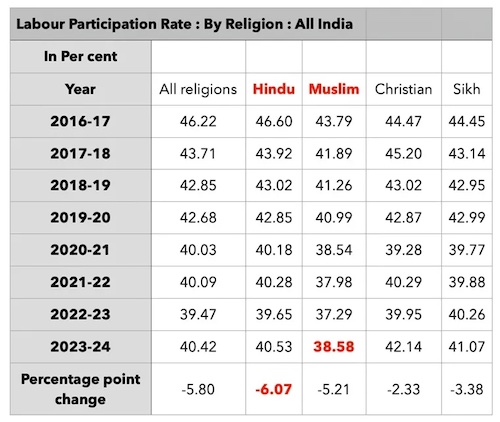
From: Udit Misra, May 30, 2024: The Indian Express
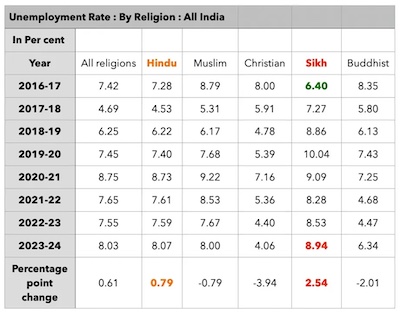
From: Udit Misra, May 30, 2024: The Indian Express
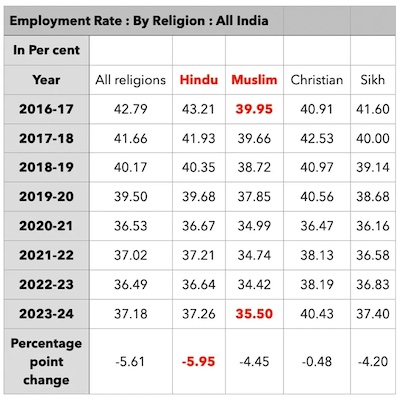
From: Udit Misra, May 30, 2024: The Indian Express
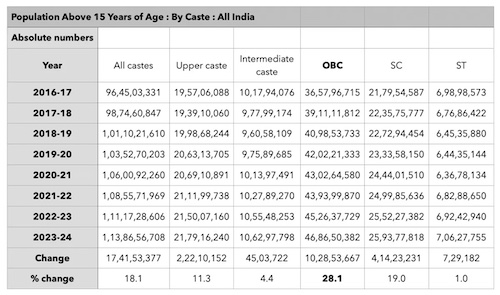
From: Udit Misra, May 30, 2024: The Indian Express
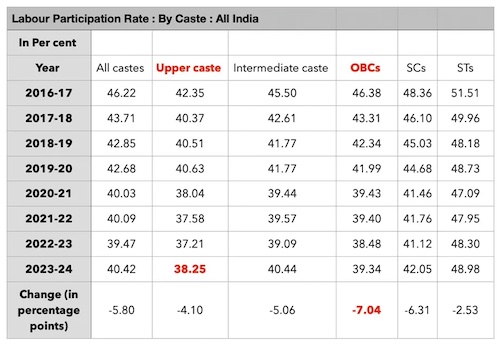
From: Udit Misra, May 30, 2024: The Indian Express
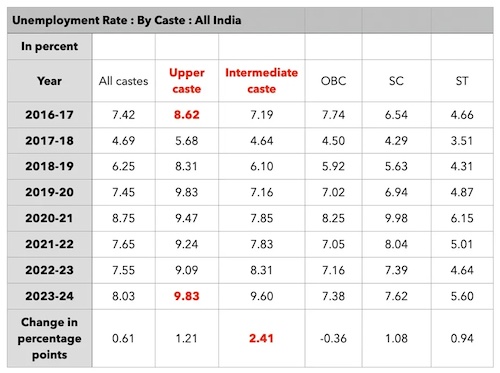
From: Udit Misra, May 30, 2024: The Indian Express
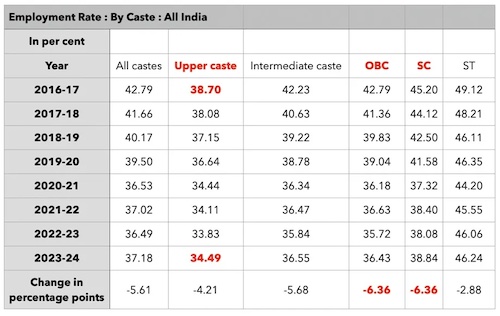
From: Udit Misra, May 30, 2024: The Indian Express
Within Hindus, OBCs and SCs, feel the brunt; employment rate for both fell sharply by 6.36 percentage points between 2016-17 and 2023-24.
1. The working-age population: This is simply the total population over the age of 15 years.
2. Labour Force Participation Rate (LFPR): The LFPR is the percentage of the working-age population that is demanding a job. As such, it excludes people like a 35-year-old married woman who is not actively looking for a job or a 22-year-old who is busy pursuing higher education or a 65-year-old who no longer wants to work. Thus the LFPR represents the demand for jobs in an economy.
3. Unemployment Rate (UER): The UER is the percentage of people looking for a job but are as yet unemployed. The UER is expressed as a percentage of the labour force. All over the world, the UER is often the most widely used metric to assess the health of the labour market.
However, it is important to note that in India it can often give misleading results. That’s because India’s LFPR has been falling. Often this can happen if people who have been unemployed for a long time decide to stop looking for (demanding) a job.
In such a case, the UER falls not because the economy has created more jobs but because fewer people are demanding them. As such, it is best to read the UER movement in conjunction with the LFPR movement.
4. The Employment Rate (ER): The ER is often considered the best metric to assess the health of employment in the Indian context. That’s because it is simply the ratio of the total number of employed people and the total size of the working-age population. By definition, it circumvents the analytical problem posed by reading UER in an economy where the LFPR rises or falls substantially over time.
The ER provides a neat, single-shot number that best captures the health of employment in any economy. If it is going up, it implies more and more people (as a percentage of the total working-age population) are getting jobs and if it falls it shows that the percentage of people with jobs is falling.
Lastly, data here only takes into account the main religions and the main castes.
Working-age population
As Table 1 shows, India’s working-age population grew 18.1% or 17.4 crore (or 170 million) from 96.45 crore in 2016-17 to 113.86 crore in 2023-24 (which ended March 31). Around 86% of this 17.4 crore increase is accounted for by Hindus, who also make up 86% of the working age population.
While the Hindu working age population grew by 18% during the period, Muslim working-age population has risen by just 13.5%. Muslims account for 9.54% of the working age population. The Christian population, even though much smaller in absolute numbers (just 1.41% of working age population), has grown 48%, the highest, during the period.
Religion-wise LFPR
Typically, for a developing economy such as India, a higher LFPR is considered better than a lower LFPR. Similarly, it is better if the LFPR shows a rising trend over time rather than a falling trend.
However, Table 2 shows disappointing numbers on both counts.
India’s overall LFPR was low in 2016-17 and has further declined by 5.8% over the past eight years. Again, the biggest contributors in this fall are Hindus, given that they constitute the bulk or 86% of the population. The percentage of working-age Hindus openly looking for a job has fallen from 46.6 per cent in 2016-17 to just 40.53% as of March 2024. That’s a fall of over 6 percentage points. It is noteworthy that Muslims had, and continue to have the lowest LFPR, although the decline in their LFPR was a bit lower at 5.2 percentage points.
Religion-wise Unemployment Rate (UER)
Given that LFPR is falling, one should presume that the unemployment rate would fall too. That’s because a smaller proportion of the working-age population is demanding jobs. But as can be seen from Table 3, India’s unemployment rate at 8.03% in 2023-24 is higher than 7.42% in 2016-17. But in the interim years, it hasn’t quite shown a consistent trend of rising or dropping. It was lowest at 4.69% in 2017-18 and highest at 8.73% in the Covid year, 2020-21.
Given that almost 86% of the working age population is Hindus, the UER among Hindus influenced the overall UER. At 7.28% in 2016-17, it was highest in the Covid year 2020-21 at 8.73%, but dropped by more than a percentage point over the next two years to 7.59% in 2022-23, and rose to 8.07% in 2023-24.
The unemployment rate among Muslims was highest among all communities in 2016-17 at 8.79%. It was lowest at 5.31% in 2017-18, and hit 9.22% in the Covid year, 2020-21. It dropped by 1.5 percentage points over the next two years, but ended 2023-24 with an UER of 8%, marginally less than that for Hindus.
In percentage terms, however, it is the Sikhs that are the worst affected. In 2016-17, they had the lowest UER at 6.4%. In 2023-24, it stood at 8.94%, which is almost similar to 9.09% in the Covid year, 2020-21, when unemployment levels for all communities was one of the highest during the eight year period
Religion-wise Employment Rate
This is the most important metric in the Indian context. Table 4 shows that India’s overall ER fell by 5.6 percentage points over the past eight years. In other words, the proportion of working-age Indians with a job dropped from 42.8% in 2016-17 to 37.2% in 2023-24.
The employment rate among Hindus fell the most — almost 6 percentage points to 37.26% in 2023-24. The ER among Muslims was lowest in 2016-17 and dropped 4.45 percentage points to 35.5% in 2023-24, the lowest among all religious communities.
What about castes within Hindus?
As the data above shows, in absolute numbers the number of those employed among the Hindus has dropped the highest over the last eight years. But which castes have seen more job losses within the Hindu fold? To answer this one needs to look at the following data tables.
In the chart, the intermediate castes grouping refers to castes such as Marathas, Jats, Gujjars, and others who often aspire to be included in the OBC category, to benefit from reservation.
Caste-wise working-age population
Table 5 shows the data. Almost 60% of the total working-age population belongs to the OBCs and another 23% is accounted for by SCs. These two groups account for almost 82% of the total working-age population among Hindus and have experienced the maximum growth.
Caste-wise LFPR
The LFPR has fallen for all castes. But, as Table 6 shows, upper-caste Hindus have the lowest LFPR.
In terms of the percentage decline in LFPR, the OBCs and SCs — the two biggest working-age population groups — have experienced the sharpest fall in LFPR.
Caste-wise unemployment rate
When LFPR falls, the unemployment rate should ideally fall. As Table 7 shows, this happens for OBCs where the UER falls from 7.7% to 7.4%. However, this relationship does not hold true for upper caste Hindus. The UER among upper castes was 8.62% in 2016-17, but at 9.83% in 2023-24, almost touched double-digits.
Caste-wise Employment Rate
ERs have fallen across the board as shown in Table 8. The OBCs and SCs, which had much higher ER compared with the upper caste in 2016-17, were the worst affected with their ERs in 2023-24 lower by 6.36 percentage points for both the categories, compared with a 4.21 percentage point fall for upper castes.
The upper caste Hindus had the lowest employment rate in 2016-17 and the story continues to be the same, albeit at an even lower level.
Salaried jobs
1991-2018
June 27, 2019: The Times of India
Salaried jobs have been increasing at a brisk pace in the past 10 years
The increase in regular salaried jobs — as opposed to ad hoc work — is a sign of economic development. Salaried workers get basic remuneration that is not directly dependent upon the revenue of the unit for which they work. Although the first 15 years after Liberalisation failed to create salaried employment at a rapid pace, the rate has picked up since 2010 and more than 20% of Indians are now in regular jobs.
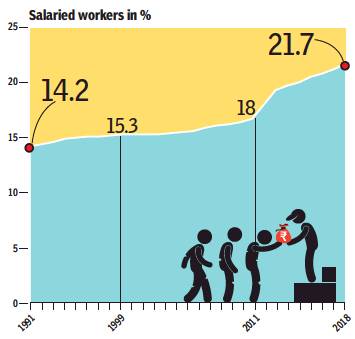
From: June 27, 2019: The Times of India
See graphic:
Salaried workers in %, 1991-2018
Unorganized Sector
Real estate biggest job creator: Report
PCOs Largest Enterprise In Unorganized Sector
New Delhi: If you feel the number of PCO booths and real estate agents in your colony seems to increasing every day, you are right. Delhi government’s report on service sector enterprises in Delhi that is based on the National Sample Survey 63rd Round Survey (July 2006-June 2007) shows that at 62,111 (18.40%) enterprises, communications — read PCO booths — comprise the largest number of unorganised sector enterprises in the city.
These include both own account enterprises (businesses where only family members work) and establishments (that have salaried employees). And the largest number of jobs (1,04,227, which comes to about 16.20%) are provided by real estate, renting etc. The report says that of the 2.39 lakh enterprises in the city, 12.64% (30255) were dhabas etc, 17.23% (41246) were real estate, renting and business activities, 19.88% (47584) were in transport activities, 18.40% (44054) were in communication, 16.58% (39696) were in other community, social and personal service activities.
About 17.62% (1.13 lakh) employees worked in dhabas, real estate employed 16.20% (1.04 lakh), 12.30% (0.79 lakh) were employed in education (private tutors etc) and 10.15% (0.65 lakh) were employed in health and social work activities.
Predictably, a big chunk of the employment in the unorganised sector comes from “other community, social and personal service activities” which includes maids, dhobis, dhaba workers etc. They comprise 13.43% of the total number of employees (6.44 lakh) in the sector. The gross value of all these enterprises, according to the report, comes to Rs 6,879 crore.
A comparison of the absolute figures however shows a decline in the number of OAEs in the city and an almost proportionate rise in the number of establishments.
Which officials say could actually signify expansion of the already existing smaller units rather than any new one actually opening.
In 2001-02, the number of OAEs stood at 16,6338, while in 2006-07 it was 14,7281.
On the other hand, 10 years back the number of establishments was 80,972, while in 2006-07 it stood at 92166.
Social realities are reflected in the ownership figures which show that just 10% businesses are woman-owned, 9.88% owned by scheduled castes and 73.11% are owned by other backward castes.
toireporter@timesgroup.com
Periodic Labour Force Survey (PLFS)
2020-21
Surojit Gupta, June 17, 2022: The Times of India
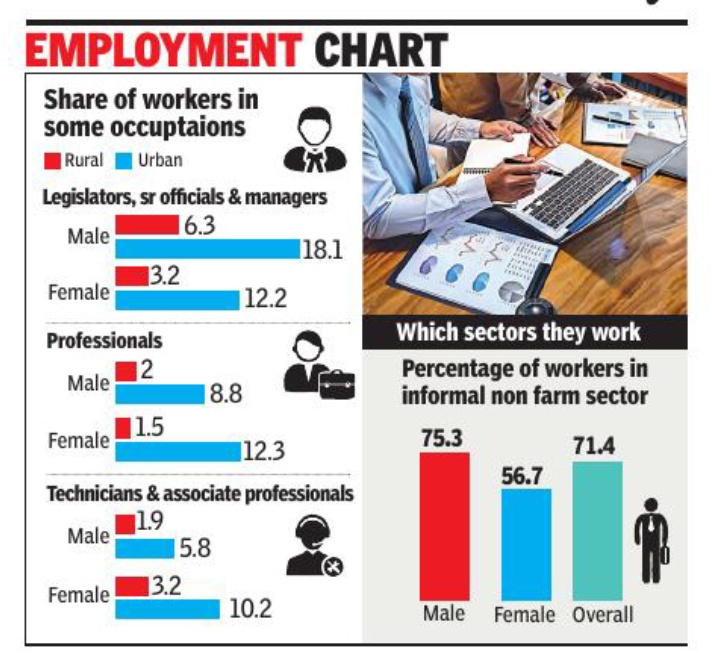
From: Surojit Gupta, June 17, 2022: The Times of India
New Delhi: Only 6. 3% of males from rural areas worked as legislators, senior officials and managers while 3. 2% women from rural backgrounds figured among such occupations, the Periodic Labour Force Survey (PLFS) for 2020-21 has shown. In urban areas it was 18. 1% for males and 12. 2% for females. In the category of professionals, 1. 9% were from rural areas for males. For females it was a higher share at 3. 2%.
The annual PLFS report covers both rural and urban areas whereas the quarterly bulletin is for urban centres. The PLFS report provides a glimpse into the jobs situation, working conditions and remunerations across rural and urban centres. It was launched in 2017 as part of efforts to get a better sense of the job situation and provide reliable and timely data.
Highlighting the working conditions, the survey showed that 65. 2% of male employees in the non-agriculture sector had no formal contract, and for females it was 61. 5%. Overall 64. 3% of them had no job contract. The results of the survey also showed that 47. 9% of workers were not eligible for paid leave. For males it was at 49. 3%, and for females it was estimated at 43. 7%.
In terms of any form of social security, 53. 8% of workers did not have it. Among males it was 53. 1%, and for women it was 55. 8%.
Experts attribute the lack of social security and formal jobs contracts to the impact of the pandemic, which ushered in informality in jobs. However, past data also suggests that the problem had existed before as well and there is need for reforms to ensure improvement in working conditions across segments.
“It’s important to remind ourselves that we walked into Covid with over 88% informality in our workforce, which means vulnerable work conditions and no contracts. Towards the beginning of the last financial year there have been opportunities. It led to increase in informality, as happens during any economic and social crisis,” said Rituparna Chakraborty, co-founder and executive director Teamlease, one of the largest staffing companies in the country.
“However if the rules for the four labour codes get notified and states fall in line, we can see the emerging impact of greater formalisation for both male and female workforce,” said Chakraborty.
Vacations
2015
The Times of India, Dec 13 2016

Indians world's fourth-most holiday-starved
Blame it on a busy family life or a bid to impress the boss: Indians are the fourth-most vacation-deprived people in the world, according to a study by an online portal. Around 63% of Indians surveyed said they took fewer days off than they were entitled to. On an average, Indians are entitled to 21 days of annual vacation but take just 15.
Only Spain and the UAE (both 68%), Malaysia (67%) and South Korea (64%) fared worse than India.
Incidentally, 95% of Indians said they believed vacations played a key role in creating work-life balance and re-energised people, which ensured better performance at work.
Weekly hours of work
1970-2017
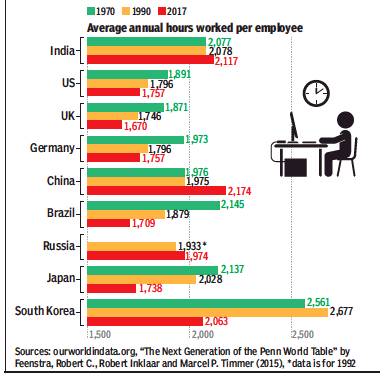
From: August 6, 2019: The Times of India
Employees in developed countries spend fewer hours at work. This is due to technical advances that increase efficiency, increased participation of women in the workforce, increase in the number of part-time employees, etc. Although work hours have increased in India after liberalisation, they may fall with economic progress
See graphic:
Average annual hours worked per employee, 1970-2017, in India, Brazil, China, Germany, Japan, Russia, South Korea, the UK and the USA.
2014
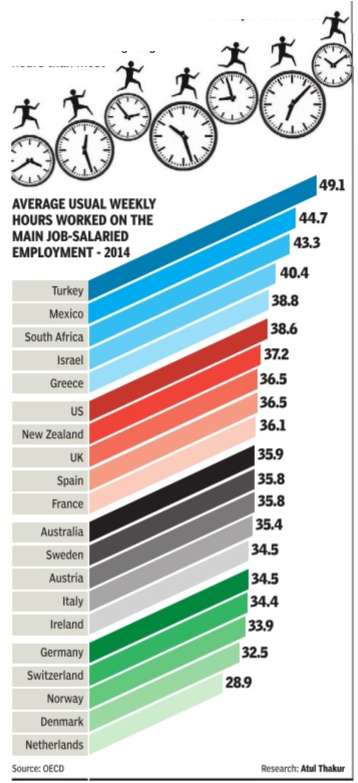
See graphic, ': Average usual weekly hours worked on the main job-salaried employment, 2014 '
See also
Employment, unemployment: India
Religion-wise demographics: India, after 2001
Transport sector: India for how Indians Commute to work
