The Lok Sabha
These are newspaper articles selected for the excellence of their content.
|
Sessions of Lok Sabha
…and the month of their commencement
First 13 May 1952
Second April 1957
Third April 1962
Fourth March 1967
Fifth March 1971
Sixth March 1977
Seventh January 1980
Eighth December 1984
Ninth December 1989
Tenth June 1991
Eleventh May 1996
Twelfth March 1998
Thirteenth October 1999
Fourteenth May 2004
Fifteenth May 2009
Sixteenth May 2014
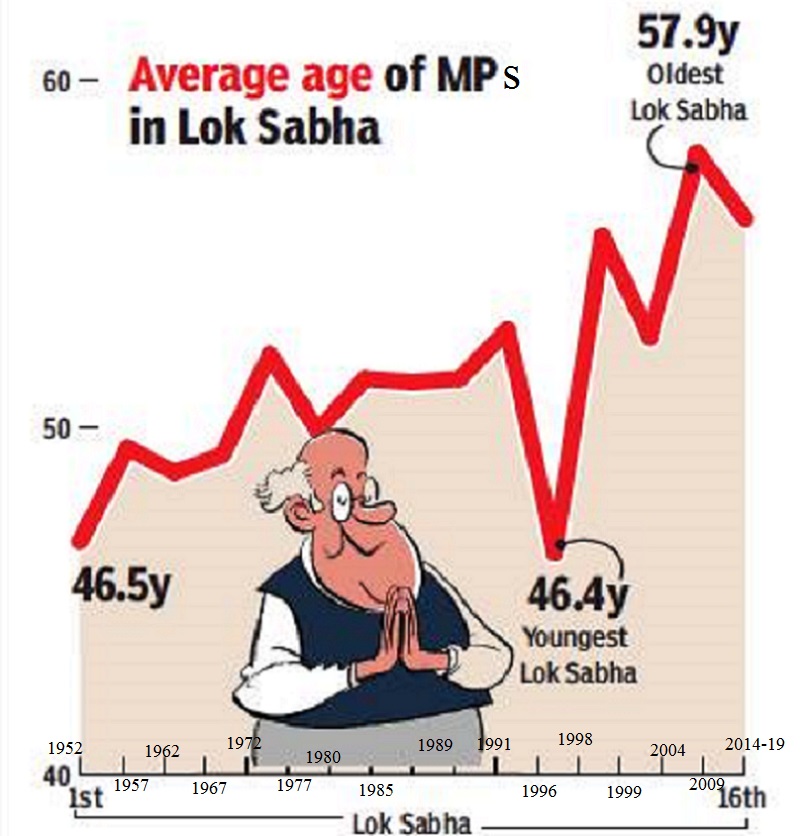
Age of MPs, average
1952- 2014
Adapted from The Times of India
See graphic, 'The average Age of Indian MPs, presumably on the date of their swearing-in, 1952- 2014'
Changes over the years
1952- 2014/ 19: Changes in the Lok Sabha
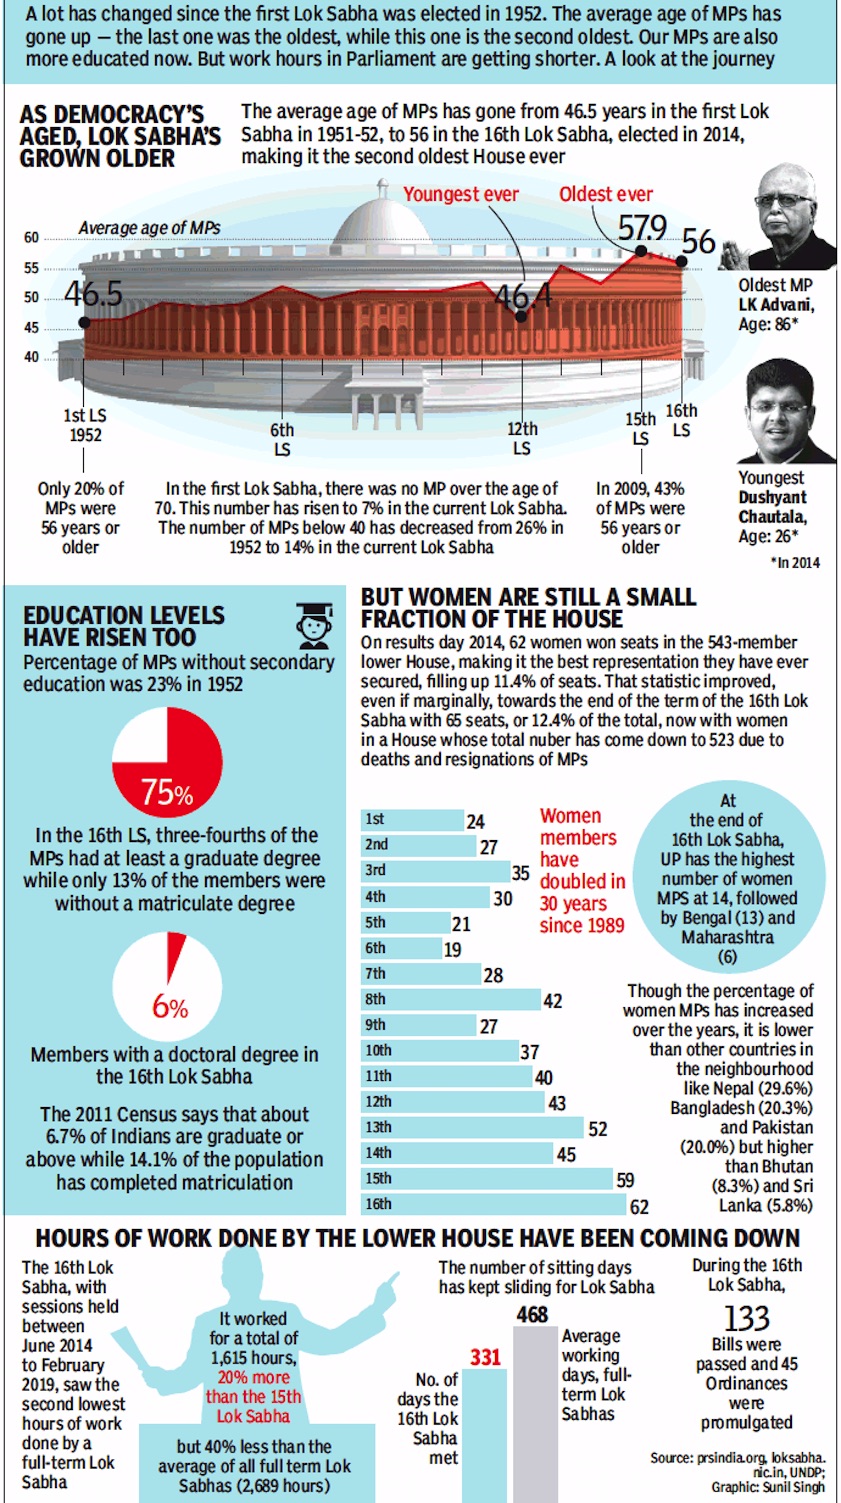
Average age
Education levels
Gender distribution
Hours of work done
From: March 17, 2019: The Times of India
See graphic:
1952- 2014/ 19: Changes in the Lok Sabha’s
Average age
Education levels
Gender distribution
Hours of work done
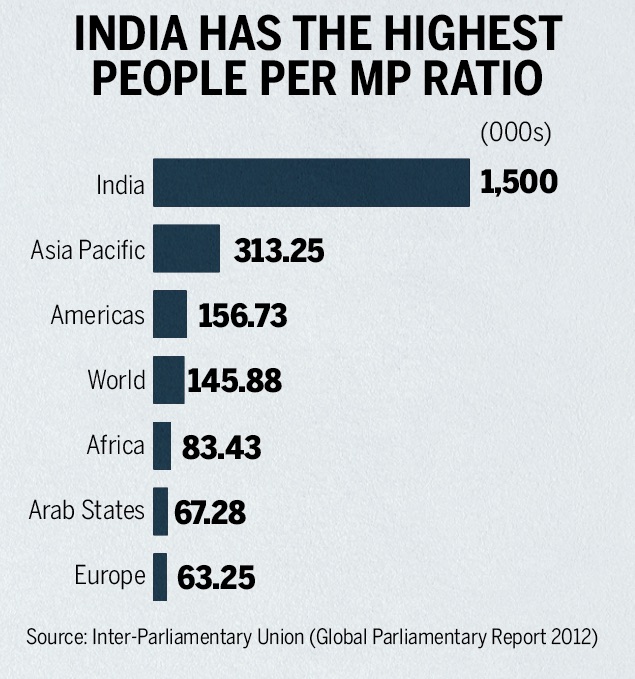
2012: People per MP ratio
From: March 19, 2019: The Times of India
See graphic:
People per MP ratio, India and some other regions of the world, as in 2012
2014: Biggest/ smallest constituencies

From: March 19, 2019: The Times of India

From: March 19, 2019: The Times of India
See graphics:
Biggest constituencies in 2014
Smallest constituencies in 2014
2019: constituencies' details
Team TOI Plus, August 24, 2021: The Times of India

From: Team TOI Plus, August 24, 2021: The Times of India
From: Team TOI Plus, August 24, 2021: The Times of India

From: Team TOI Plus, August 24, 2021: The Times of India
It was April 17, 1999. There was deep silence in Parliament. Members were voting over the confidence motion moved by Prime Minister Atal Bihari Vajpayee. All eyes were on the digital display board. It showed 269 Ayes (those who voted in favour of the motion) and 270 Noes (against the motion). Speaker GMC Balayogi announced that the confidence motion was defeated by one vote.
That’s how Madras high court chose to highlight the power of one member of Parliament’s vote in making or bringing down a ‘mighty’ central government in the largest democracy in the world. What the court was arriving at was a bigger question. If that’s the kind of difference one MP can make, is it fair to take away two MPs from a state’s quota because it managed to bring down its population by implementing successful family planning policies, the court asked.
The case of Tamil Nadu
Till 1962, there were 41 Lok Sabha members from Tamil Nadu. But after the 1967 general elections, the number came down to 39. That's because the number of seats in Parliament a state has, depends on its population and Tamil Nadu managed to bring down its population growth. This is "very unfair and unreasonable" the court said, adding that a state should be "honoured and complemented for successfully implementing central government's policies" and its interest cannot be "adversely affected". The court also noted that “those states which are unable to control population have been complimented with more representatives in Parliament”.
Seats and states
Article 81 of India’s Constitution laid down that every state and Union territory (UT) would be allotted seats in the Lok Sabha in such a manner that the ratio of population to seats should be as equal as possible across states. Electoral boundaries of parliamentary and assembly constituencies are redrawn in a process known as delimitation, which is meant to ensure equal population across constituencies.
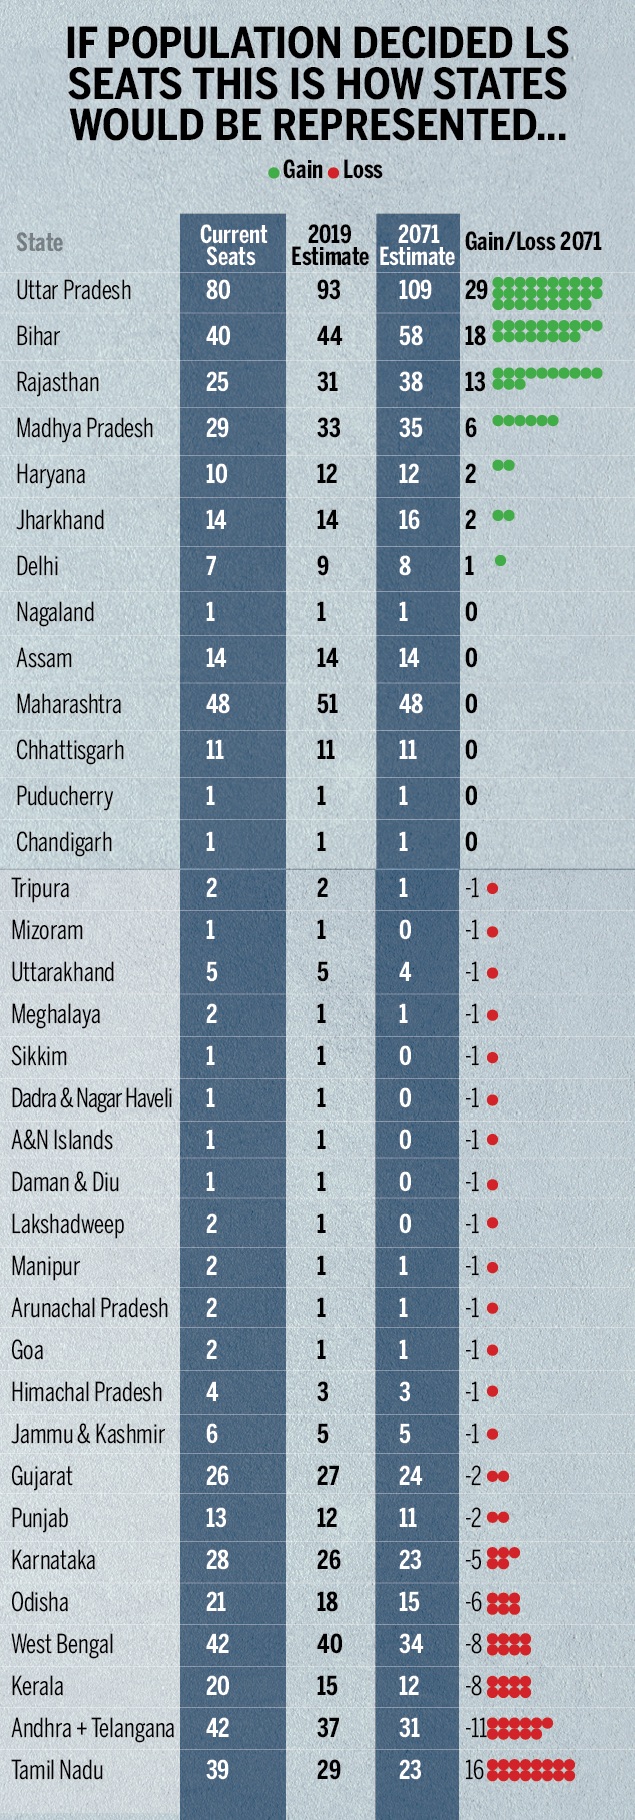
If the letter and spirit of this original provision were to be implemented today, the composition of the Lok Sabha would change drastically with states like Uttar Pradesh, Bihar, Madhya Pradesh, Maharashtra and Delhi gaining significantly more seats in the Lok Sabha, while southern states like Tamil Nadu, Kerala, Andhra Pradesh, Odisha and Telangana would lose out on seats. This is how states are represented currently, what the representation should have been in 2019 and what it would be in the future.
But things did not play out as originally planned. The reason: In 1976, during the Emergency, the 42nd amendment Act decreed that the population to be taken into consideration for the next 25 years would be the number in the 1971 Census. The rationale was that family planning was a national imperative and states would have little incentive to pursue it if success meant their share of political power would go down. The freeze on reapportioning seats between states and UTs was further extended by the 84th amendment Act in 2001 till 2026.
Why it matters The result of this freeze is that the principle of “one man (or woman) one vote” has been diluted in India. At the time of apportioning of seats based on the 1971 census, all big states had a Lok Sabha MP representing roughly 10 lakh people. The extent of the variation was from just over 10 lakh to about 10.6 lakh, hardly a huge disparity.
But in the last 40 years, seats have remained unchanged despite the increase in population. Today, the average MP from Rajasthan represents over 30 lakh people while the one in Tamil Nadu or Kerala represents less than 18 lakh. This means the voter in Tamil Nadu and Kerala has more say than the one in Rajasthan. MPs from smaller states and UTs, of course, represent even fewer people, but that has always been the case and is inevitable since even the tiniest UT cannot have less than one MP.
Prior to the 2008 delimitation, the situation was arguably worse with even voters within the same state not having the same weight. The most extreme example of this was in Delhi, where the Chandni Chowk constituency had an electorate of just 3.4 lakh while Outer Delhi had ten times the number at 33.7 lakh.
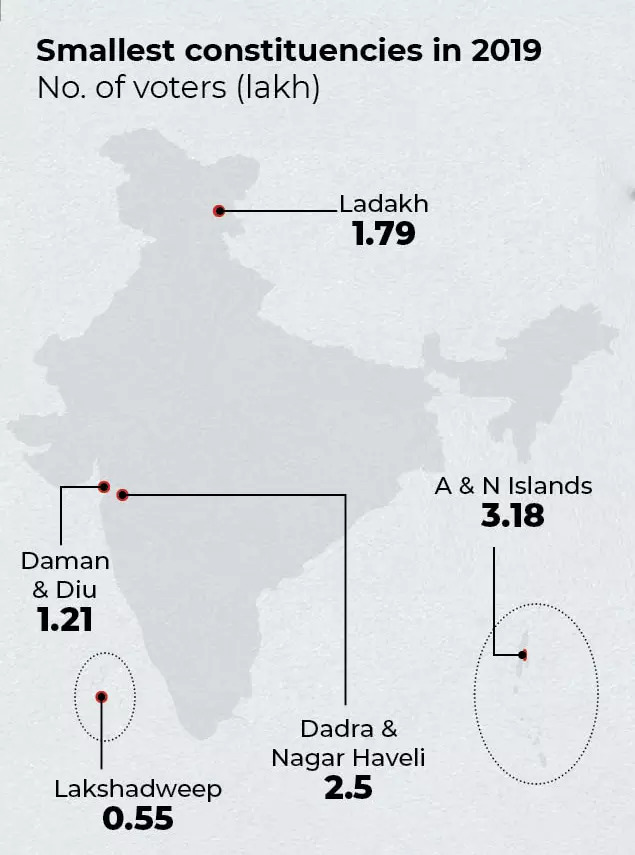
The same is reflected elsewhere. In 2019, the five smallest constituencies together had just over 9 lakh voters while the five largest had 1.4 crore voters, 15 times more than the smallest five.
Globally too, India tops the people per MP ratio with India’s 543 MPs serving 1.5 million people each, far higher than the global average of 145,880 persons represented by an MP. Though the number of voters have risen with population growth, the number of seats in Lok Sabha has not increased since 1977. As a result, an MP today represents more than four times the number of voters than what an MP did in 1951-52, when the first general elections were held.
Is there a way out?
The Madras high court, in its recent judgment, suggested that since the number of political representatives in Tamil Nadu was reduced for no fault of the state, it should be compensated either monetarily or by getting additional representation in the Rajya Sabha.
But what’s the value of a missing MP? The court came up with a formula. Since 14 general elections were held after the reduction of two MPs, that meant the state lost 28 representatives it would otherwise have been entitled to. If notionally, the contribution of an MP is taken as Rs 200 crore in five years, for every election Tamil Nadu should be compensated with Rs 400 crore, which adds up to Rs 5,600 crore for 14 elections.
The question of skewed or unequal political representation in the Lok Sabha has popped up several times over the years. In December 2019, the late President Pranab Mukherjee had pitched for raising the number of Lok Sabha seats to 1,000 from the existing 543 and for a corresponding increase in Rajya Sabha's strength.
While the current Parliament building has no place for more MPs, India is building a new one which will be bigger. So, will we have a Parliament of 1,000 MPs then?
2019- 2071 (estimate): representation, state-wise
Current seats as in March 20, 2019;
2019 estimate;
2071 estimate;
Gain/Loss 2071;
state-wise
From: March 19, 2019: The Times of India
See graphic:
If population decided seats, this is how states would be represented:
Current seats as in March 20, 2019;
2019 estimate;
2071 estimate;
Gain/Loss 2071;
state-wise
The leader of the opposition
Requirements for being the Leader of Opposition
Cong can't get LoP post in LS: AG to Speaker
Dhananjay.Mahapatra @timesgroup.com New Delhi:
The Times of India Jul 26 2014
In 2014, with just 44 seats, Congres had based its claim for the post of leader of opposition post in the Lok Sabha on the law relating to Salary and Allowances of Leader of Opposition in Parliament Act, 1977 and the rules there under. The law provides the largest opposition party would get the post. Answering a query on this issue posed to him by the 2014 Speaker Sumitra Mahajan, attorney general Mukul Rohatgi referred to the rulings given by highly regarded parliamentarian G V Mavalankar, the first Speaker of the Lok Sabha. He said Mavalankar's directions were adopted to deny LoP status to any party during the period when Jawaharlal Nehru was the PM from 1947 to 1964.
According to Rohatgi, Mavalankar had ruled that to get the post in the Lok Sabha, an opposition party has to secure a minimum of 10% of the seats, that is it must have a strength of 55 MPs.
Rohatgi said Mavalankar had felt that the main opposition party's numbers must equal the quorum, which is 10% of the total strength, required for functioning of the House. Following Mavalankar's ruling, the Congres regimes under Nehru, Indira Gandhi and Rajiv Gandhi had decided not to give the LoP post to the then largest opposition party because they had failed to reach the 55 MP-mark in the Lok Sabha.
The Centre has highlighted direction 121 of `Directions to the Speaker' which provide that a party's strength must be one-tenth of the Lok Sabha to be recognized as a parliamentary party or group.
No-confidence motions
1966-2018

From: July 21, 2018: The Times of India
See graphic :
No-confidence motions moved against the government in the parliament, 1966-2018
Number of seats in the Lok Sabha
TN, Telugu states lost 2 seats each in 1967
Srikkanth d, August 22, 2021: The Times of India
If Tamil Nadu has unfairly paid the price for controlling population growth by having its Lok Sabha seats reduced by two, is there a way to compensate for that? The Madras high court has come out with a formula that pegs monetary compensation to the state at Rs 5,600 crore.
Till 1962, Tamil Nadu had 41 Lok Sabha members. The number got reduced to 39 ahead of the 1967 general polls because the state had successfully controlled its population growth by then.
Juxtaposing this supposed anomaly with the dramatic no-confidence motion in 1999 that resulted in the toppling of the Atal Bihari Vajpayee government by one vote, the division bench said Tamil Nadu should be compensated either by way of monetary compensation or through additional representation in the Rajya Sabha. “When one MP vote itself was capable of toppling a government, it is very shocking that Tamil Nadu lost two MPs because of successful implementation of birth control in the state,” the bench of Justice N Kirubakaran and Justice B Pugalendhi said.
The judges then spelt out what they thought would be rightful compensation for all the years that have passed with two MPs less. “Notionally, the contribution of an MP in five years could be taken as Rs 200 crore, though it cannot be determined monetarily. Therefore, for every election since 1967, Tamil Nadu has to be compensated Rs 400 crore for reduction of two MP seats, which amounts to Rs 5600 crore,” the bench said.
Asking the Union government as to why Tamil Nadu’s Lok Sabha representation couldn’t be restored to 41 from the next general elections, the bench also suo motu impleaded 10 top political parties, including DMK and the main opposition AIADMK, besides Congress and BJP, to offer their responses.
The court was hearing a PIL seeking de-reservation of Tenkasi parliamentary constituency, which has remained a reserved constituency for more than half a century now. Population control can’t be a factor to decide the number of political representatives of the States in the Parliament, the bench said. “Those states which failed to implement the birth-control programmes benefited with more political representatives in the Parliament while, states, especially Tamil Nadu and Andhra Pradesh, which successfully implemented birth-control programmes, stood to lose two seats in Parliament. Andhra Pradesh also lost two MPs and got the number reduced from 42 to 40 seats in the Parliament”.
Number frozen in 1976
How 1976 seat freeze has altered LS representation, March 16, 2019: The Times of India

From: How 1976 seat freeze has altered LS representation, March 16, 2019: The Times of India
Move Was To Encourage Family Planning And Ensure States That Curbed Population Growth Didn’t Lose Out In Parliament
Article 81 of India’s Constitution laid down that every state (and Union territory) will be allotted seats in the Lok Sabha in such a manner that the ratio of population to seats should be as equal as possible across states. If the letter and spirit of the original provision were to be implemented today, the composition of the Lok Sabha would change drastically with states like Uttar Pradesh, Bihar, Madhya Pradesh, Maharashtra and Delhi gaining significantly and Tamil Nadu, Kerala, Andhra Pradesh, Odisha and Telangana losing out (see graphic).
The reason this hasn’t happened is because in 1976, during the Emergency, the 42nd amendment Act decreed that the population to be taken into consideration for the next 25 years would be the number in the 1971 census. The rationale was that family planning was a national imperative and states would have little incentive to pursue it if success meant their share of political power would go down. The freeze on reapportioning seats between states and UTs was further extended by the 84th amendment Act in 2001 till 2026.
The result of this freeze is that the principle of “one man (or woman) one vote” has been diluted in India? At the time of the apportioning of seats based on the 1971 census, all big states had a Lok Sabha MP representing roughly 10 lakh people. The extent of the variation was from just over 10 lakh to about 10.6 lakh, hardly a huge disparity.
With the seats having remained unchanged but population growth having varied widely, today (based on 2016 mid-year population) the average MP in Rajasthan represents over 30 lakh people while the one in Tamil Nadu or Kerala represents less than 18 lakh. But that has always been the case and is inevitable since even the tiniest UT cannot have less than one MP.
Prior to the 2008 delimitation, the situation was arguably worse with even voters within the same state not having the same weight. The most extreme extreme example of this was in Delhi, where the Chandni Chowk constituency had an electorate of just 3.4 lakh while Outer Delhi had ten times the number at 33.7 lakh.
Prior to the 2008 delimitation, the situation was arguably worse with even voters within the same state not having the same weight. The most extreme extreme example of this was in Delhi, where the Chandni Chowk constituency had an electorate of just 3.4 lakh while Outer Delhi had ten times the number at 33.7 lakh.
The same is reflected elsewhere. In 2014, the five smallest constituencies together had just under 8 lakh voters while the five largest had 1.2 crore voters, 15 times more than the smallest five.
Globally too, India tops the people per MP ratio with India’s 543 MPs serving 1.5 million people each, far higher than the global average of 145,880 persons represented by an MP. Though the number of voters have risen with population growth, the number of seats in Lok Sabha has not increased since 1977. As a result, an MP today represents more than four times the number of voters than what an MP did in 1951-52, when the first general elections were held.
Percentage of women members in Lok Sabha
1952-2009
Source: PRS Legislative Research
India Today June 1, 2009
Ladies first
1952-4.4%
1957-4.5%
1962-6.7%
1967-5.8%
1971-4.9%
1977-3.8%
1980-5.7%
1985-7.9%
1989-5.2%
1991-7.6%
1996-7.4%
1998-8.1%
1999-9.2%
2004-8.7%
2009-10.7%
Productivity
1952-2019

From: February 14, 2019: The Times of India
See graphic:
The productivity of the 1st to the 16th Lok Sabhas, i.e. 1952-2019
1962-2019

From: May 24, 2019: The Times of India
See graphic :
The productivity of the 3rd to the 16th Lok Sabhas, i.e. 1962-2019
1962-2014; 2019-21
From: Nov 26, 2021: The Times of India
See graphic:
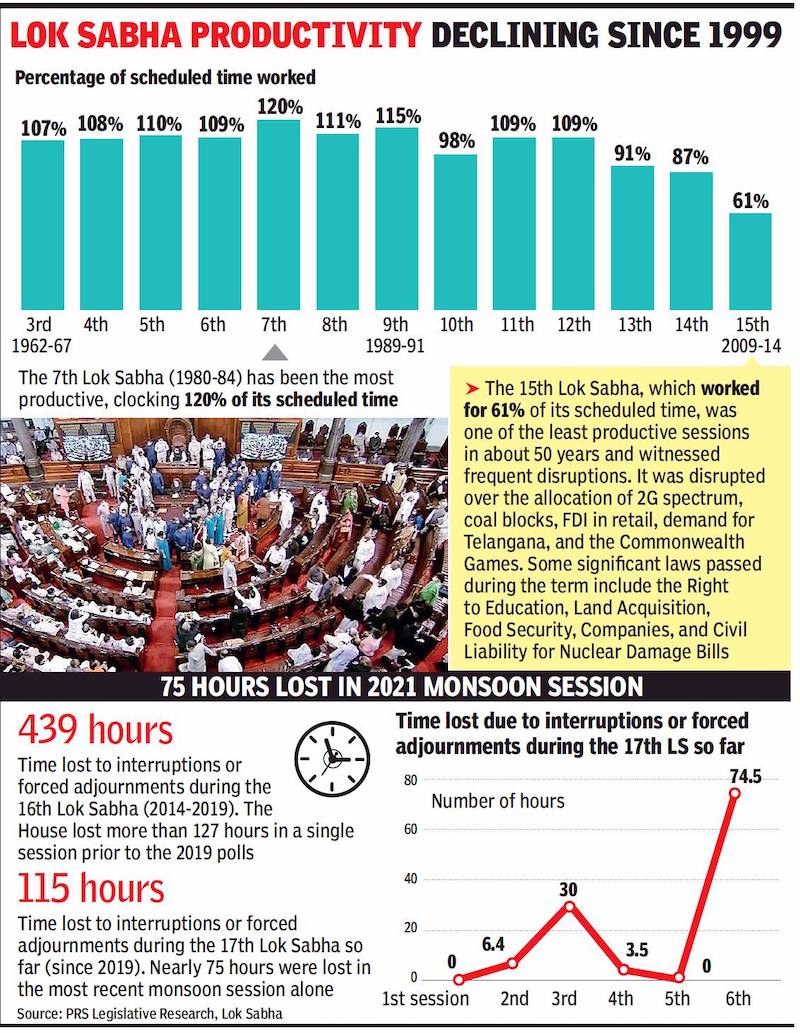
The Lok Sabha’s productivity: 1962-2014, 2019-21
1999, 2009-2019
August 8, 2019: The Times of India

From: August 8, 2019: The Times of India

From: August 8, 2019: The Times of India

From: August 8, 2019: The Times of India
From: August 8, 2019: The Times of India
Why this budget session was the most productive in decades
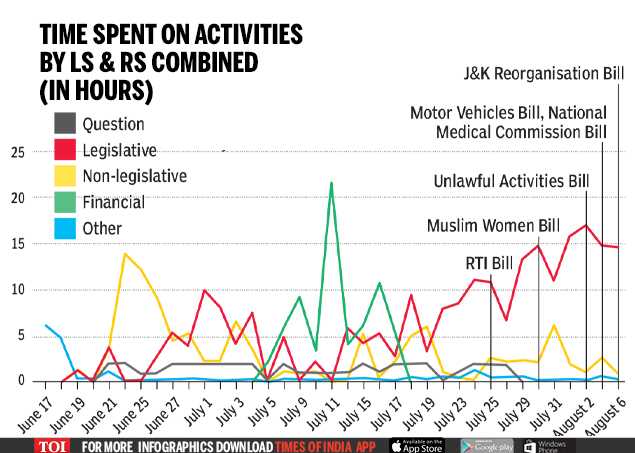
NEW DELHI: This budget session was one of the busiest sessions in the past 20 years. Both houses spent nearly half their time on legislative business, passing 30 bills and working more than 70 hours extra. A look at how the session panned out.
ALMOST EVERY WOMAN MP PARTICIPATED THIS SESSION
LOK SABHA BREAKS RECORD FOR MOST HOURS WORKED IN LAST 20 HOURS
In this session, Lok Sabha spent 281 hrs, or about 135% of the time it was scheduled to work — the most extra time spent working since 2000. In the past 20 years, Lok Sabha has worked only 80% of the total scheduled work hours on average. On the other hand, Rajya Sabha spent 195 hours working, about 103% of the scheduled working hours.
MOST BILLS PASSED BY BOTH HOUSES THIS SESSION IN PAST DECADE
This Parliament’s first session passed as many bills as the last seven sessions of the previous government. Indicative of the number of contentious bills passed, both houses required recorded or ballot paper votes to pass 14 bills. In most cases, a simple voice vote is enough to pass a bill 21% of this session’s LS bills were passed after a recorded vote and 23% for the RS. In the previous Lok Sabha, just 8% and 6% of LS and RS bill, respectively required recorded votes. No bill introduced in this session were referred to a Committee.
PARLIAMENT SPENT ALMOST HALF ITS TIME ON LEGISLATIVE MATTERS
While Lok Sabha spent 46% of it time on legislative business, that figure was 52%for Rajya Sabha. A whopping 36% of questions were answered orally in Lok Sabha, the most since 1999.
MANY KEY BILLS WERE PASSED NEAR THE END OF THE SESSION
Initially expected to end July 26, the Lok Sabha session was extended to August 7. Speaker Om Birla adjourned Lok Sabha a day early, calling this session “the most productive since 1952”.
Speakers of the Lok Sabha
The speakers: a table
|
First Lok Sabha |
Ganesh Vasudev Mavalankar |
5 May, 1952 – 27 February, 1956 |
|
First Lok Sabha |
M. Ananthasayanam Ayyangar |
8 March, 1956 – 10 May, 1957 |
|
Second Lok Sabha |
M. Ananthasayanam Ayyangar |
11 May, 1957 – 16 April, 1962 |
|
Third Lok Sabha |
Hukam Singh |
17 April, 1962 – 16 March, 1967 |
|
Fourth Lok Sabha |
Neelam Sanjiva Reddy |
17 March, 1967 – 19 July, 1969 |
|
Fourth Lok Sabha |
Gurdial Singh Dhillon |
8 August, 1969 – 19 March, 1971 |
|
Fifth Lok Sabha |
Gurdial Singh Dhillon |
22 March, 1971 – 1 December, 1975 |
|
Fifth Lok Sabha |
Bali Ram Bhagat |
5 January, 1976 – 25 March, 1977 |
|
Sixth Lok Sabha |
Neelam Sanjiva Reddy |
26 March, 1977 – 13 July, 1977 |
|
Sixth Lok Sabha |
K. S. Hegde |
21 July, 1977 – 21 January, 1980 |
|
Seventh Lok Sabha |
Bal Ram Jakhar |
22 January, 1980 – 15 January, 1985 |
|
Eighth Lok Sabha |
Bal Ram Jakhar |
16 January, 1985 – 18 December, 1989 |
|
Ninth Lok Sabha |
Ravi Ray |
19 December, 1989 – 9 July, 1991 |
|
Tenth Lok Sabha |
Shivraj V. Patil |
10 July, 1991 – 22 May, 1996 |
|
Eleventh Lok Sabha |
P. A. Sangma |
23 May, 1996 – 23 March, 1998 (FN) |
|
Twelfth Lok Sabha |
G. M. C. Balayogi |
24 March, 1998 – 20 October, 1999 (FN) |
|
Thirteenth Lok Sabha |
G. M. C. Balayogi |
22 October, 1999 – 3 March, 2002 |
|
Thirteenth Lok Sabha |
Manohar Joshi |
10 May, 2002 – 4 June, 2004 |
|
Fourteenth Lok Sabha |
Somnath Chatterjee |
4 June, 2004 – 31 May, 2009 |
|
Fifteen Lok Sabha |
Smt. Meira Kumar |
3 June, 2009 – 4 June,2014 |
|
Sixteenth Lok Sabha |
Smt.Sumitra Mahajan |
5 June 2014 - |
1952- 2014 repeated, with explanatory footnotes
Sixteenth Lok Sabha Smt.Sumitra Mahajan 5 June 2014 -
Suspension of members (MPs)
2005-19
Lok Sabha has witnessed suspension of members for unruly behaviour on many past occasions.
Then Speaker Sumitra Mahajan had suspended 45 members on January 2, 2019 for the rest of the session after a ruckus. She first suspended 24 ADMK members, followed by another batch of 21, which included MPs from ADMK, TDP and an unattached YSRCP member. While the ADMK members were protesting against a proposed dam over the Cauvery river, the Andhra MPs were demanding special status for their state.
On February 12, 2014, Meira Kumar had suspended 18 Andhra MPs for the rest of the Budget session after supporters and opponents of Telangana sprayed pepper in the House and indulged in fisticuffs.
In the 14th Lok Sabha, Somnath Chatterjee had stopped short of suspending Mamata Banerjee, then a TMC MP, in August 2005 when she threw a sheaf of papers at the Speaker’s chair, occupied by the then deputy speaker Charanjit Singh Atwal at that time. She then sent her resignation to the deputy Speaker and walked out.
Chatterjee turned down the resignation. He said he wanted Banerjee to return and act according to her conscience. He didn’t initiate action. Banerjee’s unruly act came after Atwal informed her that the Speaker had disallowed her notice to raise the subject of illegal Bangladeshi migration. Banerjee had earlier thrown her shawl at then Speaker Purno Sangma.
2020 March

From: March 6, 2020: The Times of India
See graphic:
The seven Congress Lok Sabha members who were ‘suspended’ for the rest of the session.
Vote margins
1962- 2014/ Closest and widest win margins

From: March 25, 2019: The Hindu
See graphic:
The table shows the closest and widest win margins in Lok Sabha elections in terms of vote percentage, 1962-2014
Walkouts, disruptions
1962-2014, 2019-21
Nov 26, 2021: The Times of India
Chaos in Parliament a sign of India’s strong democracy
In A Vast And Diverse Country Like India, The Occasional Cacophony Of Voices In The Street Or In Parliament Shouldn’t Sound Alarming
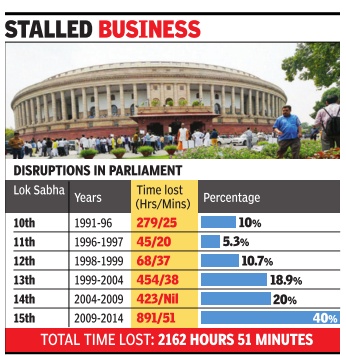
It’s not an exaggeration to say that disruptions define the Indian Parliament. The numbers back this up. The amount of time lost due to disruptions in Parliament had steadily risen from 5% of working time in the truncated 11th Lok Sabha (1996-97) to 39% in the 15th Lok Sabha (2009-14). The year 2011 was a particularly bad one when 30% of the available time was lost due to disruptions. The year before, the entire winter session was lost due to the furore over the 2G scam. Though disruptions have come down after the BJP’s dominant victories in the 2014 and 2019 general elections, the threat of disorder is always lurking. Disruptions have usually occurred when a government policy or a national issue has united the Opposition. The month-long winter session of 2016 was the least productive of the 16th Lok Sabha (2014-19) after the Opposition united against the Modi government’s sudden and ill-conceived decision to demonetise high-denomination currency notes, which was announced days before the session began. As much as 92 hours or 73% of the session was lost due to disruptions. In fact, despite a single-party majority, the 16th Lok Sabha worked for 20% more than the disruptionhit 15th Lok Sabha, but 40% lower than the average of all full-term Lok Sabhas.
Behaviour issues
Disruptions in Parliament, however, have a long history. When India’s first Lok Sabha met in 1952, there were highquality debates on issues of critical importance to independent India. But it wasn’t as if the precincts of Parliament only saw calm and reasoned debates. Soon after the first Lok Sabha convened in 1952, an amendment to the contentious Preventive Detention Bill brought about, in the words of veteran journalist BG Verghese, “an unprecedented hullaballoo”. During the debate on preventive detention, a marshal even approached a Communist party member, KA Nambiar, to evict him, but he responded by shouting, “I will not go. You will have to take me by force.” It was left to one of India’s best parliamentarians and fellow Communist, Hiren Mukherjee, to pacify the Speaker. Subsequently the Communists staged a walkout only to return later in the day.
A decade later, during the third Lok Sabha in 1963, when the Official Languages Bill was introduced, there were strong protests by some Opposition members, which this newspaper described as the first time that such “disorderly scenes” were witnessed in the House. Two members, including Swami Rameshwaranand of the Bharatiya Jana Sangh, had to be forcibly ejected by the watch and ward staff. Another member grabbed the microphone and hurled abuse at the Speaker and the Prime Minister. Nehru, always a strict disciplinarian, took strong exception to this behaviour, noting: “I do not know if that gentleman has the least conception of what Parliament is, what democracy is, and how one is supposed to behave or ought to behave.”
Indeed, as a foreign journalist observed, it was Nehru rather than the Speaker who “held the reins of the House” and when the Speaker’s entreaties were ignored, it would be “Nehru’s cutting voice which overrode the tumult and restored contrite decorum”. An unrepentant Rameshwaranand would later light a “sacred fire” in the Central Hall of Parliament and set fire to a copy of the Bill. When the Speaker informed him that lighting a fire was “forbidden” inside Parliament House, Rameshwaranand took position outside the gate for visitors and burnt a copy of the Bill.
Earlier that year, some members had tried to disrupt the President’s address to the two Houses, delivered once a year and considered one of the most important and sacrosanct events of the parliamentary schedule. A committee was formed to investigate the incident and in its report laid down some norms for the conduct of members during the President’s address. It said that it was a “constitutional obligation on the part of the members to listen to the President’s address with decorum and dignity” and reiterated that the House can punish a member if in its opinion a member has “acted in unbecoming manner or has acted in a manner unworthy of a member.”
Disruptions the new normal
After Nehru’s death in 1964, it seems his warnings about parliamentary decorum too were forgotten. There were fears raised by the historian of parliament, WH Morris-Jones, who noted that the passing of Nehru was likely to mark the “end of a period” for the Westminster model. From the fourth Lok Sabha (1967-70) – the first without Nehru present in the House – walkouts and disruptive behaviour became increasingly common. Subhash Kashyap, a former secretary general of the Lok Sabha, points out that from the fourth Lok Sabha the culture of parliamentary politics changed and it was politics with the “masks and gloves off”.
The floor of the Lok Sabha was not the only site of protests. Members wanted permission to hold protests, and even hunger strikes, within the premises of Parliament. The Communist MP AK Gopalan in 1964 held a one-day hunger strike in the lobby of Parliament to protest food shortage in his home state of Kerala. In 1966, Rameshwaranand led a mob protesting cow slaughter towards Parliament in an attempt to storm the complex. Seven people died and over 100 were injured after police fired on the protesters. The Upper House was not immune to such protests either. In 1971, the volatile Raj Narain – who had filed the election malpractice case against Indira Gandhi, which was one of the proximate causes of the Emergency, and defeated her from Rae Bareli in the 1977 general elections – had to be forcibly removed from the Upper House after disobeying the chair’s order.
The reasons for the progressive rise in disruptions are varied. The Indira Gandhi years can be seen as a critical moment for the undermining of institutions, including Parliament. Atal Bihari Vajpayee had once observed, “Pandit Nehru stayed away from the house only when it was absolutely unavoidable. She (Indira) attends Parliament only when she must.” This led the eminent political scientists, Lloyd and Susanne Rudolph, to conclude, “Nehru was the schoolmaster of parliamentary government, Indira Gandhi its truant.” Besides the damaging effect of the Indira years, there are a host of reasons for the upturn in disruptions: the limited efficacy of the rules and disciplinary powers of successive Speakers; the more heterogeneous composition of Parliament compared to its first three decades of existence; the replacement of a dominant party system with a fragmented one where coalition governments were the norm; the televising of parliamentary proceedings; and an acceptance that disruptions were part of parliamentary and India’s political culture.
Disruptions also probably have something to do with the nature of India’s parliamentary democracy, which was once described by British Prime Minister Anthony Eden as “not a pale imitation of our practice at home, but a magnified and multiplied reproduction on a scale we have never dreamt of.” The scale and diversity of India have contributed to the cacophonous nature of Indian democracy, which in turn has found expression in Parliament. Indeed, while disruptions impact the functioning of Parliament, they are also a barometer of the robustness of Indian democracy.
See also
The 15th Lok Sabha: 2009-14/ The 16th Lok Sabha (2014-19): MPs complete list of MPs / The 16th Lok Sabha (2014-19): trends


