The Lok Sabha
(→1962-2019) |
(→Productivity) |
||
| Line 190: | Line 190: | ||
'' The productivity of the 3rd to the 16th Lok Sabhas, i.e. 1962-2019 '' | '' The productivity of the 3rd to the 16th Lok Sabhas, i.e. 1962-2019 '' | ||
| + | |||
| + | ==1999, 2009-2019== | ||
| + | [https://timesofindia.indiatimes.com/india/why-this-budget-session-was-the-most-productive-in-decades/articleshow/70580766.cms August 8, 2019: ''The Times of India''] | ||
| + | |||
| + | |||
| + | [[File: 16th and 17th Lok Sabhas- First time MPs, Women MPs.jpg|16th and 17th Lok Sabhas: <br/> First time MPs <br/> Women MPs <br/> From: [https://timesofindia.indiatimes.com/india/why-this-budget-session-was-the-most-productive-in-decades/articleshow/70580766.cms August 8, 2019: ''The Times of India'']|frame|500px]] | ||
| + | |||
| + | |||
| + | [[File: The Rajya and Lok Sabhas, 1999-2019- actual hours of a sitting as a % of scheduled hours.jpg|The Rajya and Lok Sabhas, 1999-2019- actual hours of a sitting as a % of scheduled hours <br/> From: [https://timesofindia.indiatimes.com/india/why-this-budget-session-was-the-most-productive-in-decades/articleshow/70580766.cms August 8, 2019: ''The Times of India'']|frame|500px]] | ||
| + | |||
| + | [[File: The Rajya and Lok Sabhas, 2009-2019- the number of bills passed.jpg|The Rajya and Lok Sabhas, 2009-2019- the number of bills passed <br/> From: [https://timesofindia.indiatimes.com/india/why-this-budget-session-was-the-most-productive-in-decades/articleshow/70580766.cms August 8, 2019: ''The Times of India'']|frame|500px]] | ||
| + | |||
| + | |||
| + | Why this budget session was the most productive in decades | ||
| + | |||
| + | NEW DELHI: This budget session was one of the busiest sessions in the past 20 years. Both houses spent nearly half their time on legislative business, passing 30 bills and working more than 70 hours extra. A look at how the session panned out. | ||
| + | |||
| + | ''' ALMOST EVERY WOMAN MP PARTICIPATED THIS SESSION ''' | ||
| + | |||
| + | |||
| + | ''' LOK SABHA BREAKS RECORD FOR MOST HOURS WORKED IN LAST 20 HOURS ''' | ||
| + | |||
| + | In this session, Lok Sabha spent 281 hrs, or about 135% of the time it was scheduled to work — the most extra time spent working since 2000. In the past 20 years, Lok Sabha has worked only 80% of the total scheduled work hours on average. On the other hand, Rajya Sabha spent 195 hours working, about 103% of the scheduled working hours. | ||
| + | |||
| + | ''' MOST BILLS PASSED BY BOTH HOUSES THIS SESSION IN PAST DECADE ''' | ||
| + | |||
| + | This Parliament’s first session passed as many bills as the last seven sessions of the previous government. Indicative of the number of contentious bills passed, both houses required recorded or ballot paper votes to pass 14 bills. In most cases, a simple voice vote is enough to pass a bill 21% of this session’s LS bills were passed after a recorded vote and 23% for the RS. In the previous Lok Sabha, just 8% and 6% of LS and RS bill, respectively required recorded votes. No bill introduced in this session were referred to a Committee. | ||
| + | |||
| + | ''' PARLIAMENT SPENT ALMOST HALF ITS TIME ON LEGISLATIVE MATTERS ''' | ||
| + | |||
| + | While Lok Sabha spent 46% of it time on legislative business, that figure was 52%for Rajya Sabha. A whopping 36% of questions were answered orally in Lok Sabha, the most since 1999. | ||
| + | |||
| + | ''' MANY KEY BILLS WERE PASSED NEAR THE END OF THE SESSION ''' | ||
| + | |||
| + | Initially expected to end July 26, the Lok Sabha session was extended to August 7. Speaker Om Birla adjourned Lok Sabha a day early, calling this session “the most productive since 1952”. | ||
[[Category:Government|LTHE LOK SABHA | [[Category:Government|LTHE LOK SABHA | ||
| Line 195: | Line 230: | ||
[[Category:India|LTHE LOK SABHA | [[Category:India|LTHE LOK SABHA | ||
THE LOK SABHA]] | THE LOK SABHA]] | ||
| + | [[Category:Pages with broken file links|THE LOK SABHA]] | ||
[[Category:Politics|LTHE LOK SABHA | [[Category:Politics|LTHE LOK SABHA | ||
THE LOK SABHA]] | THE LOK SABHA]] | ||
Revision as of 09:56, 9 February 2021
These are newspaper articles selected for the excellence of their content.
|
Sessions of Lok Sabha
…and the month of their commencement
First 13 May 1952
Second April 1957
Third April 1962
Fourth March 1967
Fifth March 1971
Sixth March 1977
Seventh January 1980
Eighth December 1984
Ninth December 1989
Tenth June 1991
Eleventh May 1996
Twelfth March 1998
Thirteenth October 1999
Fourteenth May 2004
Fifteenth May 2009
Sixteenth May 2014
Age of MPs, average
1952- 2014
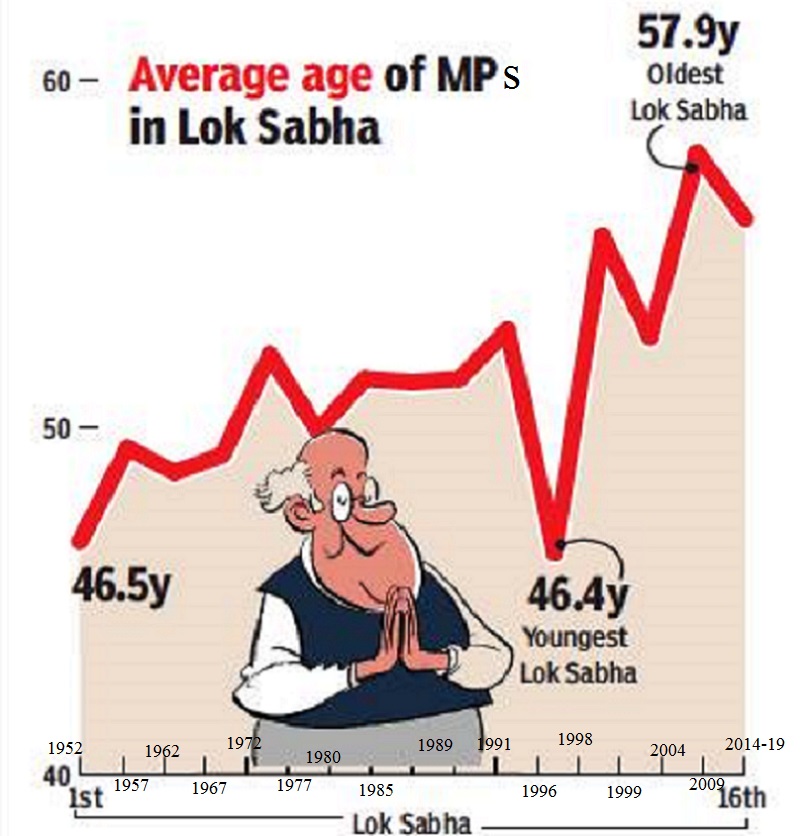
Adapted from The Times of India
See graphic, 'The average Age of Indian MPs, presumably on the date of their swearing-in, 1952- 2014'
Changes over the years
1952- 2014/ 19: Changes in the Lok Sabha
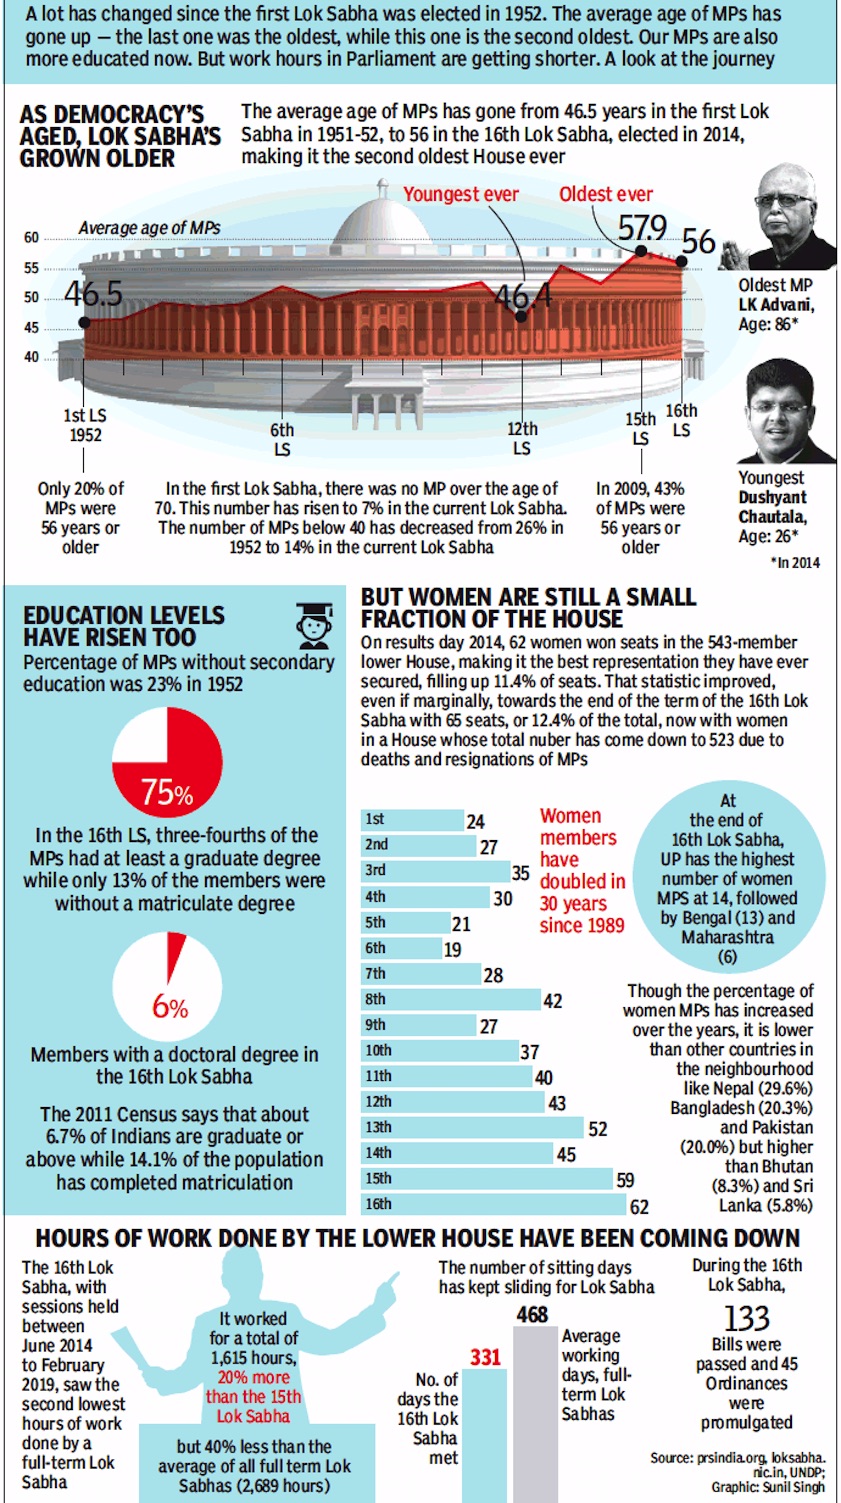
Average age
Education levels
Gender distribution
Hours of work done
From: March 17, 2019: The Times of India
See graphic:
1952- 2014/ 19: Changes in the Lok Sabha’s
Average age
Education levels
Gender distribution
Hours of work done
2012: People per MP ratio
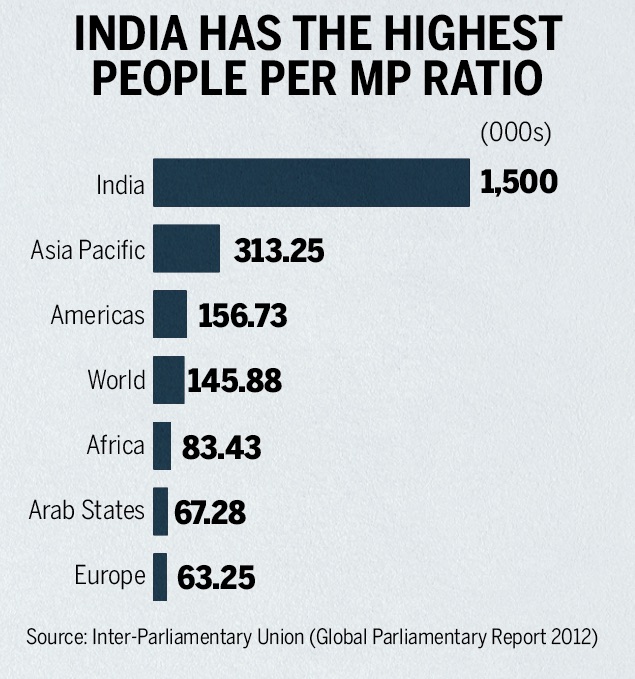
From: March 19, 2019: The Times of India
See graphic:
People per MP ratio, India and some other regions of the world, as in 2012
2014: Biggest/ smallest constituencies

From: March 19, 2019: The Times of India

From: March 19, 2019: The Times of India
See graphics:
Biggest constituencies in 2014
Smallest constituencies in 2014
2019- 2071 (estimate): representation, state-wise
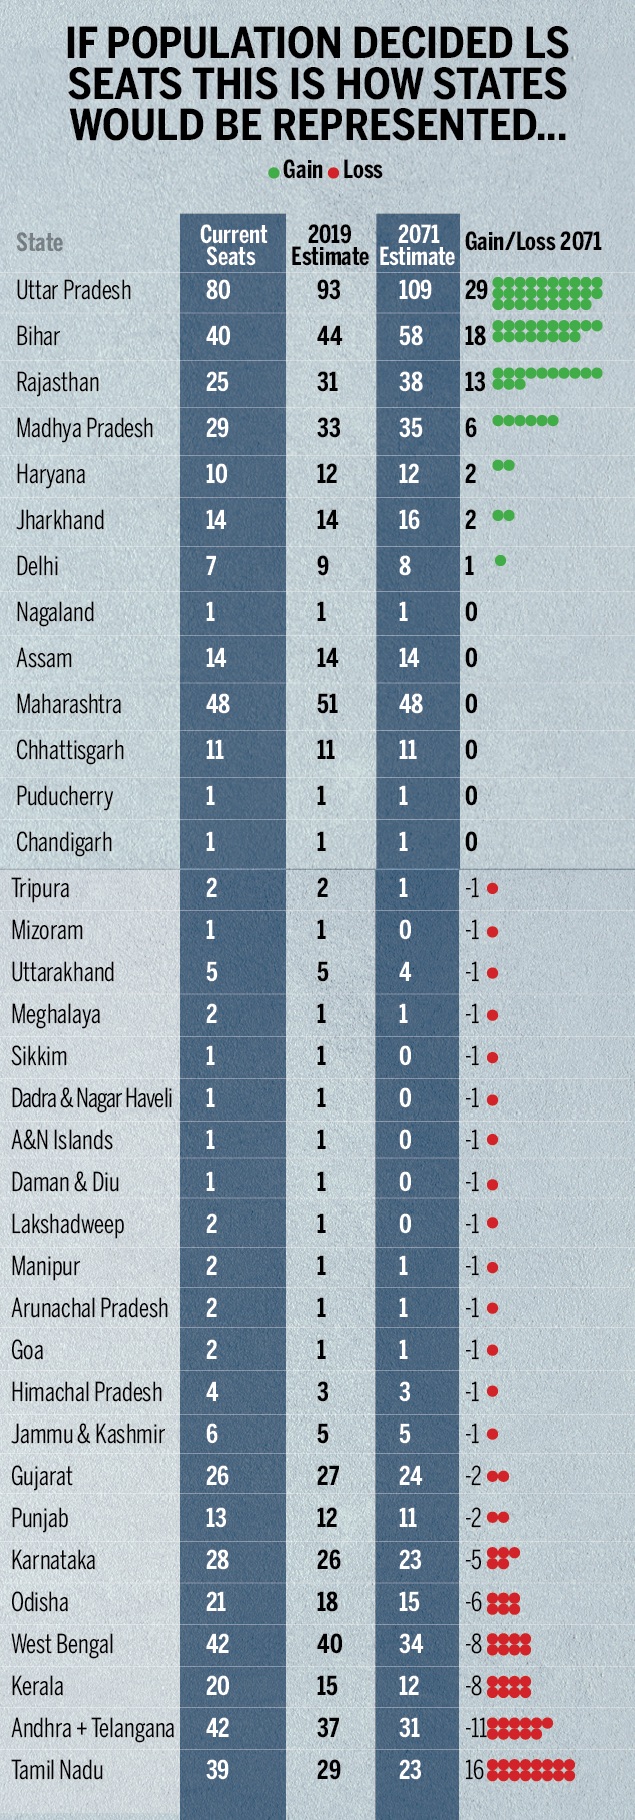
Current seats as in March 20, 2019;
2019 estimate;
2071 estimate;
Gain/Loss 2071;
state-wise
From: March 19, 2019: The Times of India
See graphic:
If population decided seats, this is how states would be represented:
Current seats as in March 20, 2019;
2019 estimate;
2071 estimate;
Gain/Loss 2071;
state-wise
The leader of the opposition
Requirements for being the Leader of Opposition
Cong can't get LoP post in LS: AG to Speaker
Dhananjay.Mahapatra @timesgroup.com New Delhi:
The Times of India Jul 26 2014
In 2014, with just 44 seats, Congres had based its claim for the post of leader of opposition post in the Lok Sabha on the law relating to Salary and Allowances of Leader of Opposition in Parliament Act, 1977 and the rules there under. The law provides the largest opposition party would get the post. Answering a query on this issue posed to him by the 2014 Speaker Sumitra Mahajan, attorney general Mukul Rohatgi referred to the rulings given by highly regarded parliamentarian G V Mavalankar, the first Speaker of the Lok Sabha. He said Mavalankar's directions were adopted to deny LoP status to any party during the period when Jawaharlal Nehru was the PM from 1947 to 1964.
According to Rohatgi, Mavalankar had ruled that to get the post in the Lok Sabha, an opposition party has to secure a minimum of 10% of the seats, that is it must have a strength of 55 MPs.
Rohatgi said Mavalankar had felt that the main opposition party's numbers must equal the quorum, which is 10% of the total strength, required for functioning of the House. Following Mavalankar's ruling, the Congres regimes under Nehru, Indira Gandhi and Rajiv Gandhi had decided not to give the LoP post to the then largest opposition party because they had failed to reach the 55 MP-mark in the Lok Sabha.
The Centre has highlighted direction 121 of `Directions to the Speaker' which provide that a party's strength must be one-tenth of the Lok Sabha to be recognized as a parliamentary party or group.
No-confidence motions
1966-2018

From: July 21, 2018: The Times of India
See graphic :
No-confidence motions moved against the government in the parliament, 1966-2018
Number of seats in the Lok Sabha
Number frozen in 1976
How 1976 seat freeze has altered LS representation, March 16, 2019: The Times of India

From: How 1976 seat freeze has altered LS representation, March 16, 2019: The Times of India
Move Was To Encourage Family Planning And Ensure States That Curbed Population Growth Didn’t Lose Out In Parliament
Article 81 of India’s Constitution laid down that every state (and Union territory) will be allotted seats in the Lok Sabha in such a manner that the ratio of population to seats should be as equal as possible across states. If the letter and spirit of the original provision were to be implemented today, the composition of the Lok Sabha would change drastically with states like Uttar Pradesh, Bihar, Madhya Pradesh, Maharashtra and Delhi gaining significantly and Tamil Nadu, Kerala, Andhra Pradesh, Odisha and Telangana losing out (see graphic).
The reason this hasn’t happened is because in 1976, during the Emergency, the 42nd amendment Act decreed that the population to be taken into consideration for the next 25 years would be the number in the 1971 census. The rationale was that family planning was a national imperative and states would have little incentive to pursue it if success meant their share of political power would go down. The freeze on reapportioning seats between states and UTs was further extended by the 84th amendment Act in 2001 till 2026.
The result of this freeze is that the principle of “one man (or woman) one vote” has been diluted in India? At the time of the apportioning of seats based on the 1971 census, all big states had a Lok Sabha MP representing roughly 10 lakh people. The extent of the variation was from just over 10 lakh to about 10.6 lakh, hardly a huge disparity.
With the seats having remained unchanged but population growth having varied widely, today (based on 2016 mid-year population) the average MP in Rajasthan represents over 30 lakh people while the one in Tamil Nadu or Kerala represents less than 18 lakh. But that has always been the case and is inevitable since even the tiniest UT cannot have less than one MP.
Prior to the 2008 delimitation, the situation was arguably worse with even voters within the same state not having the same weight. The most extreme extreme example of this was in Delhi, where the Chandni Chowk constituency had an electorate of just 3.4 lakh while Outer Delhi had ten times the number at 33.7 lakh.
Prior to the 2008 delimitation, the situation was arguably worse with even voters within the same state not having the same weight. The most extreme extreme example of this was in Delhi, where the Chandni Chowk constituency had an electorate of just 3.4 lakh while Outer Delhi had ten times the number at 33.7 lakh.
The same is reflected elsewhere. In 2014, the five smallest constituencies together had just under 8 lakh voters while the five largest had 1.2 crore voters, 15 times more than the smallest five.
Globally too, India tops the people per MP ratio with India’s 543 MPs serving 1.5 million people each, far higher than the global average of 145,880 persons represented by an MP. Though the number of voters have risen with population growth, the number of seats in Lok Sabha has not increased since 1977. As a result, an MP today represents more than four times the number of voters than what an MP did in 1951-52, when the first general elections were held.
Percentage of women members in Lok Sabha
1952-2009
Source: PRS Legislative Research
India Today June 1, 2009
Ladies first
1952-4.4%
1957-4.5%
1962-6.7%
1967-5.8%
1971-4.9%
1977-3.8%
1980-5.7%
1985-7.9%
1989-5.2%
1991-7.6%
1996-7.4%
1998-8.1%
1999-9.2%
2004-8.7%
2009-10.7%
Productivity
1952-2019

From: February 14, 2019: The Times of India
See graphic:
The productivity of the 1st to the 16th Lok Sabhas, i.e. 1952-2019
1962-2019

From: May 24, 2019: The Times of India
See graphic :
The productivity of the 3rd to the 16th Lok Sabhas, i.e. 1962-2019
1999, 2009-2019
August 8, 2019: The Times of India

From: August 8, 2019: The Times of India

From: August 8, 2019: The Times of India
Why this budget session was the most productive in decades
NEW DELHI: This budget session was one of the busiest sessions in the past 20 years. Both houses spent nearly half their time on legislative business, passing 30 bills and working more than 70 hours extra. A look at how the session panned out.
ALMOST EVERY WOMAN MP PARTICIPATED THIS SESSION
LOK SABHA BREAKS RECORD FOR MOST HOURS WORKED IN LAST 20 HOURS
In this session, Lok Sabha spent 281 hrs, or about 135% of the time it was scheduled to work — the most extra time spent working since 2000. In the past 20 years, Lok Sabha has worked only 80% of the total scheduled work hours on average. On the other hand, Rajya Sabha spent 195 hours working, about 103% of the scheduled working hours.
MOST BILLS PASSED BY BOTH HOUSES THIS SESSION IN PAST DECADE
This Parliament’s first session passed as many bills as the last seven sessions of the previous government. Indicative of the number of contentious bills passed, both houses required recorded or ballot paper votes to pass 14 bills. In most cases, a simple voice vote is enough to pass a bill 21% of this session’s LS bills were passed after a recorded vote and 23% for the RS. In the previous Lok Sabha, just 8% and 6% of LS and RS bill, respectively required recorded votes. No bill introduced in this session were referred to a Committee.
PARLIAMENT SPENT ALMOST HALF ITS TIME ON LEGISLATIVE MATTERS
While Lok Sabha spent 46% of it time on legislative business, that figure was 52%for Rajya Sabha. A whopping 36% of questions were answered orally in Lok Sabha, the most since 1999.
MANY KEY BILLS WERE PASSED NEAR THE END OF THE SESSION
Initially expected to end July 26, the Lok Sabha session was extended to August 7. Speaker Om Birla adjourned Lok Sabha a day early, calling this session “the most productive since 1952”.
Speakers of the Lok Sabha
The speakers: a table
|
First Lok Sabha |
Ganesh Vasudev Mavalankar |
5 May, 1952 – 27 February, 1956 |
|
First Lok Sabha |
M. Ananthasayanam Ayyangar |
8 March, 1956 – 10 May, 1957 |
|
Second Lok Sabha |
M. Ananthasayanam Ayyangar |
11 May, 1957 – 16 April, 1962 |
|
Third Lok Sabha |
Hukam Singh |
17 April, 1962 – 16 March, 1967 |
|
Fourth Lok Sabha |
Neelam Sanjiva Reddy |
17 March, 1967 – 19 July, 1969 |
|
Fourth Lok Sabha |
Gurdial Singh Dhillon |
8 August, 1969 – 19 March, 1971 |
|
Fifth Lok Sabha |
Gurdial Singh Dhillon |
22 March, 1971 – 1 December, 1975 |
|
Fifth Lok Sabha |
Bali Ram Bhagat |
5 January, 1976 – 25 March, 1977 |
|
Sixth Lok Sabha |
Neelam Sanjiva Reddy |
26 March, 1977 – 13 July, 1977 |
|
Sixth Lok Sabha |
K. S. Hegde |
21 July, 1977 – 21 January, 1980 |
|
Seventh Lok Sabha |
Bal Ram Jakhar |
22 January, 1980 – 15 January, 1985 |
|
Eighth Lok Sabha |
Bal Ram Jakhar |
16 January, 1985 – 18 December, 1989 |
|
Ninth Lok Sabha |
Ravi Ray |
19 December, 1989 – 9 July, 1991 |
|
Tenth Lok Sabha |
Shivraj V. Patil |
10 July, 1991 – 22 May, 1996 |
|
Eleventh Lok Sabha |
P. A. Sangma |
23 May, 1996 – 23 March, 1998 (FN) |
|
Twelfth Lok Sabha |
G. M. C. Balayogi |
24 March, 1998 – 20 October, 1999 (FN) |
|
Thirteenth Lok Sabha |
G. M. C. Balayogi |
22 October, 1999 – 3 March, 2002 |
|
Thirteenth Lok Sabha |
Manohar Joshi |
10 May, 2002 – 4 June, 2004 |
|
Fourteenth Lok Sabha |
Somnath Chatterjee |
4 June, 2004 – 31 May, 2009 |
|
Fifteen Lok Sabha |
Smt. Meira Kumar |
3 June, 2009 – 4 June,2014 |
|
Sixteenth Lok Sabha |
Smt.Sumitra Mahajan |
5 June 2014 - |
1952- 2014 repeated, with explanatory footnotes
Sixteenth Lok Sabha Smt.Sumitra Mahajan 5 June 2014 -
Suspension of members (MPs)
2005-19
Lok Sabha has witnessed suspension of members for unruly behaviour on many past occasions.
Then Speaker Sumitra Mahajan had suspended 45 members on January 2, 2019 for the rest of the session after a ruckus. She first suspended 24 ADMK members, followed by another batch of 21, which included MPs from ADMK, TDP and an unattached YSRCP member. While the ADMK members were protesting against a proposed dam over the Cauvery river, the Andhra MPs were demanding special status for their state.
On February 12, 2014, Meira Kumar had suspended 18 Andhra MPs for the rest of the Budget session after supporters and opponents of Telangana sprayed pepper in the House and indulged in fisticuffs.
In the 14th Lok Sabha, Somnath Chatterjee had stopped short of suspending Mamata Banerjee, then a TMC MP, in August 2005 when she threw a sheaf of papers at the Speaker’s chair, occupied by the then deputy speaker Charanjit Singh Atwal at that time. She then sent her resignation to the deputy Speaker and walked out.
Chatterjee turned down the resignation. He said he wanted Banerjee to return and act according to her conscience. He didn’t initiate action. Banerjee’s unruly act came after Atwal informed her that the Speaker had disallowed her notice to raise the subject of illegal Bangladeshi migration. Banerjee had earlier thrown her shawl at then Speaker Purno Sangma.
2020 March

From: March 6, 2020: The Times of India
See graphic:
The seven Congress Lok Sabha members who were ‘suspended’ for the rest of the session.
Vote margins
1962- 2014/ Closest and widest win margins

From: March 25, 2019: The Hindu
See graphic:
The table shows the closest and widest win margins in Lok Sabha elections in terms of vote percentage, 1962-2014
See also
The 15th Lok Sabha: 2009-14/ The 16th Lok Sabha (2014-19): MPs complete list of MPs / The 16th Lok Sabha (2014-19): trends


