Corporations, corporate performance: India
This is a collection of articles archived for the excellence of their content. |
Brands, the most valued
2017
April 16, 2018: The Times of India

From: April 16, 2018: The Times of India
See graphic:
The most valued Indian brands of 2017
Despite the growth in the entertainment and telecom sector, five of the top 10 most valuable Indian brands remain banks and financial institutions. While the combined value of the country’s top 50 brands is estimated at $105 billion, over half of that value is held by the top 10 alone.
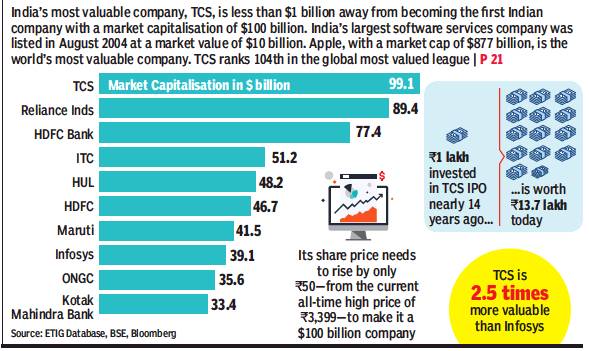
Market capitalisation
From: April 21, 2018: The Times of India
See graphic:
The Market capitalisation of India’s top ten companies, presumably in early 2018
Capex (capital expenditure)
India and the world
2019-21

From: July 8, 2021: The Times of India
See graphic:
Capex in India and the world, 2019-21
2020, Feb
February 2, 2020: The Times of India

From: February 2, 2020: The Times of India
Life Insurance Corporation (LIC), when it lists, has the potential to zoom straight to the top of market capitalisation rankings in the domestic bourses as it’s expected to emerge as the country’s most valuable company, ahead of traditional heavy weights Reliance Industries or TCS.
LIC is the largest financial institution in the country with assets under management (AUM) of over Rs 31 lakh crore. SBI Life Insurance, which is predominantly owned by a publicsector bank, has an AUM of Rs 1.6 lakh crore and is valued at Rs 89,400 crore.
Valued on the basis of its AUM, LIC would have a market cap of Rs 55 lakh crore. Currently, the most valuable company is Reliance Industries with a market cap of Rs 8.8 lakh crore. “Going by this valuation, the government can meet its entire disinvestment target of Rs 2.1 lakh crore by divesting 5% of LIC,” said Nilesh Sathe, former member, Irdai.
However, Sanket Kawatkar, head of actuarial firm Milliman’s life insurance practice in India, struck a cautious note on this valuation. He said that AUM alone cannot be a factor as it would vary according to product. The valuation for ULIP business would be different as compared to traditional business, which will be different from AUM obtained from group policies, he said. According to life industry executives, LIC has a large share of single-premium business where earnings are much lower than regular premium policies.
However, there are roadblocks to its listing, including an amendment to the Life Insurance Nationalisation Act of 1956. According to former LIC chairman S B Mathur, listing of the corporation will require amendments to the Act.
Cash surpluses
As in 2019
‘60 cos can give shareholders ₹89k cr’, February 7, 2020: The Times of India
From: ‘60 cos can give shareholders ₹89k cr’, February 7, 2020: The Times of India
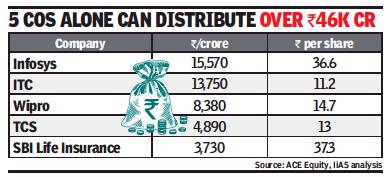
An investor advisory firm has said that 60 of the S&P BSE 500 companies can, conservatively, return Rs 88,600 crore of surplus cash to their shareholders. This, said Institutional Investor Advisory Services India (IiAS), is just about one-third of the companies’ aggregate cash on the balance sheet as on March 31, 2019.
The study, which is into its fifth edition, is an effort by IiAS to ask boards to critically re-evaluate their capital allocation policy and rally against cash hoarding. Of the 60 companies, almost a third are MNCs. The excess cash, if distributed by these 60 companies, translates into a median dividend yield of 3.8%, significantly higher than the current 1.1%. There are six companies where the excess cash translates into an additional dividend yield of more than 15%. “The 60 companies can return a median of 52% of their total cash to shareholders. There are 10 companies that can distribute over 75% of their March 31, 2019, on-balance sheet cash. These include Oracle Financial Services Software, Justdial, Multi-Commodity Exchange of India and AstraZeneca Pharma India,” IiAS said.
The report said that MNC companies — including GlaxoSmithKline Consumer Healthcare, Oracle Financial Services Software and Pfizer — are likely to pay higher dividends from FY21 onwards due to abolition of the dividend distribution tax (DDT). The Finance Bill 2020 proposes to remove the DDT and dividends, henceforth, will be taxable in the hands of shareholders.
“While the proposed amendment may work out beneficial for certain retail shareholders in the lower tax brackets, the effective tax rate can be as high as 42.7% for individuals with income of over Rs 5 crore. On the other hand, companies will bear buyback tax of 20% (effective rate of 23.3%), which was introduced in the Finance Act 2019, if they decide to return surplus cash through the buyback route,” the report said.
The consolidated profit after tax (PAT) for these 60 companies increased by 13.4% over 2018 fiscal, while the PAT for the BSE 500 companies in aggregate increased by 0.3%. While the 60 companies have outperformed the index (based on profitability), almost half of these companies reported a decline in the FY19 return on equity (RoE), compared to the previous year. “This should compel their boards to review capital allocation and return some of the excess cash to shareholders,” the report said.
Corporate debt
2016/ debt-to-GDP ratio is 55%
Corporate debt in emerging market economies including India, which used to average at 49% GDP nearly a decade ago, has now risen to 55% of the GDP , according to a latest RBI report.
India stands at the seventh place when measuring its government debt-to-GDP ratio -far behind countries such as China, Indonesia and Malaysia. The report also sheds light on how the system could be setting itself up for more cases of wilful defaulters like the now defunct Kingfisher Airlines. In a study of firms with more than $1-billion assets over 19 years, it was found that bigger corporates tend to be more leveraged post a crisis, compared to smaller firms.
Why it matters? In December, the RBI, in its fifth bimonthly policy statement, held rates for the first time in 2016, given the excess liquidity entering the system post-demonetisation. From some qu arters, the low-interest rate regime was hailed as the right time for pushing more loans to consumers, but the latest RBI report cautions against such a move. Titled, `Corporate Leverage in EMEs: Has the Global Financial Crisis Changed the Determinants?', the report draws parallels to the 2008 financial crisis.
“The post crisis period was characterised by abundant global liquidity and search for yield, which possibly resulted in lenient creditscore evaluations and leverage built-up. It is also possible that these firms with low profit took advantage of their possible future upturn and borrowed cheaply from debt markets,“ said the report.
Given the RBI's successive interest rates and current neutral stance, it is possible that we are on the cusp of a change in the policy rate cycle. And its at this juncture, the reports warns that lenders need to exercise more prudence.
2019, 20: India and the world

From: February 13, 2021: The Times of India
See graphic:
2019, 20: Corporate debt in India and the world
Corporate performance, year-wise
1992-2018

From: August 25, 2019: The Times of India
See graphic, ‘The performance of Indian corporations, 1992-2018 ’
1999-2018-19
April 12, 2019: The Times of India
From: April 12, 2019: The Times of India
See graphic:
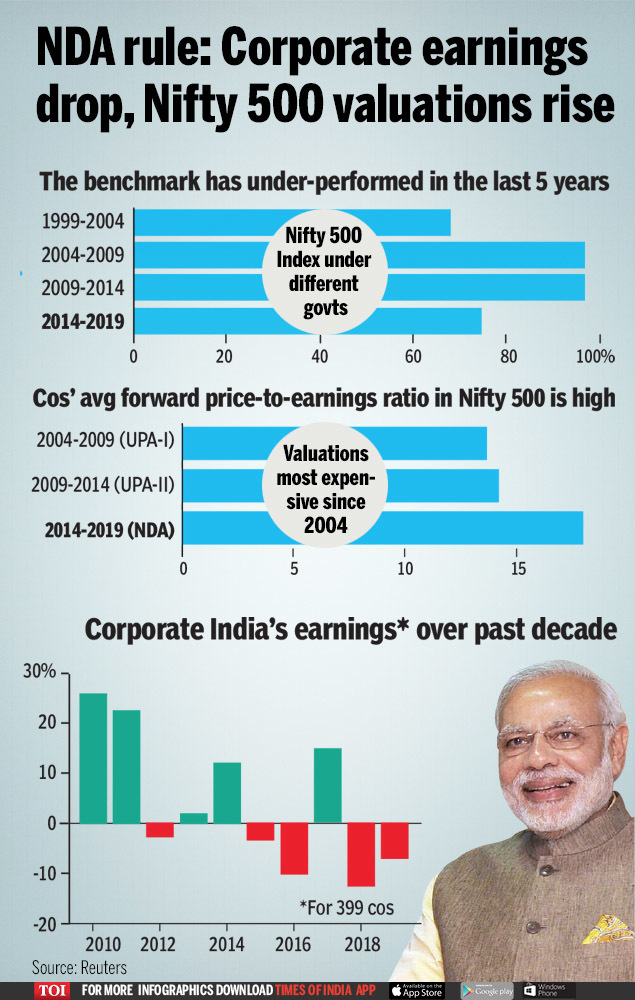
The performance of Indian corporations under NDA and UPA governments, 1999-March 2019.
It has been a mixed bag for the market and India Inc during Modi’s tenure. The growth of corporate earnings has dropped in four of the five years. Also, the rise in Nifty 500 index during the last five years lagged UPA’s two terms. However, under Modi, the valuations of Nifty 500 companies are at a higher level than the UPA regimes.
2013-18: worst 5 years for India Inc since liberalisation
Atul Thakur, August 25, 2019: The Times of India
The period from 2013-14 to 2017-18 (both inclusive) has been the worst five-year period for corporate India in the last 25 years. This is true for sales growth as well as profit after taxes. Not surprisingly, the employee compensation too grew slowest in this period. This was true for both government-owned and private-owned domestic companies, though the pattern was a little different for foreign-owned companies. Analysing data from the Centre for Monitoring Indian Economy (CMIE), an independent agency that tracks economic and business data, TOI found that the average annual increase in sales revenue was 6% for the five years ending 2017-18 (the latest for which the relevant data is available). This was by far the lowest for any of the five-year blocks starting 1993-94.
Corporate sales in the five years between 2002-03 and 2007-08 saw an average annual increase of 21.2%, the highest for these blocks. Government-owned companies saw the lowest annual increase in sales (2.6%) in the latest five-year period. In this period, the domestic private sector increased its sales revenues by 6.5% annually, while the corresponding figures for the foreign-owned companies was 13.6%.
The five years till 2017-18 actually saw profit after taxes falling on average by 4.7% each year. Even the period between 2007-08 and 2012-13 had seen profits after tax rising by an average of 1.1% a year despite the initial years of this period being impacted by the global financial meltdown, which is an indication of just how bad the last five-year period has been.
Further slicing of the data shows that once again, the foreign private sector bucked the trend, its profits growing by a healthy 12.2% annually during this period. The government-owned companies were the worst sufferers.
The latest five-year block also saw the lowest annual increase in employee compensation paid by corporates. The annual increase of 12.2% was the lowest since 1992-93. The five years between 1992-93 and 1997-98 that immediately followed economic liberalisation saw the highest increase when compensation increased by 18.4% annually. Ownership-wise analysis for the most recent years shows that the increase was lowest in government-owned corporates (5.5%). At 14.3%, the increase was more than double in domestic private sector while it was highest in the foreign private sector at 19.5%. The increase in employee compensation could be either due to higher wages or more manpower.
1991-2021 Jan: company-wise performance
January 22, 2021: The Times of India
What makes cos stock market favourites? They dare to dream
How A ₹10K Investment In These Stocks Grew Over The Decades...
IT
₹1.5Cr 1995*
Infy | Infosys is the stuff of middle class dreams. It was founded as an IT services company in 1981 by seven engineers led by N R Narayana Murthy, with an initial capital of Rs 10,000 that Murthy’s wife gave him. It was money she had saved for a rainy day. The same year it signed its first software client, New York-based Data Basics Corporation. In 1987, it opened its first international office in Boston. Six years later, it introduced an employee stock options programme and the same year, it did a very successful IPO. In 1999, it became the first India-registered company to list on the Nasdaq. As India’s IT revolution took off, and Infy’s share price surged, the widely distributed share structure created numerous dollar millionaires.
₹2.7L 2004
TCS | Tata Consultancy Services launched as a division of Tata Sons on April 1, 1968, as a management and technology consultancy that would create demand for downstream computer services. F C Kohli, a brilliant technocrat, was brought in from Tata Electric Cos to run it. Since the govt mandated that any import of computers must entail exports of twice the value, TCS developed an external market focus. It started building software for common processes like financial accounting. In 1973, a partnership with American business equipment maker Burroughs resulted in the first recorded instance of an offshore software delivery done out of India, accomplished using automation. These efforts resulted in TCS leading India’s software revolution.
₹36L 1995*
Wipro | Wipro was founded in 1945 in Amalner, Maharashtra, by Mohamed Premji to manufacture vegetable oil. It did an IPO the year after and was listed on the BSE. Mohamed died in 1966, forcing his son Azim to abandon his studies and take over the company. In three decades, Premji took Wipro first into computing hardware, and then into IT services. It was listed on the NYSE in 2000. India’s IT revolution resulted in Wipro’s revenue and share price surging. Premji’s ownership of 75% of the stock made him one of the richest Indians. The economic benefits of most of those shares are committed to his philanthropic foundations.
EQUITY CULTURE
₹39.5L 1992*
RIL | Started in 1966 as a small textile manufacturer, RIL has morphed into an enterprise with interests in petrochemicals, oil & gas, retail, telecom and financial services. Its IPO in 1978 introduced the equity culture in India and its market value then was Rs 10 crore. Today, RIL enjoys a market cap of Rs 13.3 lakh crore. After founder Dhirubhai Ambani’s demise in 2002, the empire was divided between his two sons, with the older Mukesh inheriting the flagship, and Anil getting the new-age biz like telecom. In 2016, RIL disrupted India’s mobile services sector with the launch of Jio.
OTHERS
₹42L 1992*
Titan | Started as a watchmaker in 1984, Titan is a JV between the Tatas and the Tamil Nadu Industrial Development Corp. It listed in 1987 and, in 1993, it entered jewellery — now its biggest revenue contributor. Titan also got into perfumes & eyewear. It has emerged as the second biggest jewel in the Tata Group’s crown with a Rs 1.4-lakh-crore mcap after TCS.
₹43L 1992*
Asian Paints | Founded by four friends in the pre-independence era, Asian Paints is a sector leader. It expanded into related areas in the home improvement space from furnishings to lightings. It also launched hand sanitisers and surface disinfectants. RIL holds about 5% stake in Asian Paints, bought in 2008, months before the collapse of Lehman Brothers.
₹11L 1994
Crisil | An S&P arm, the homegrown rating agency has transformed into a global analytics co, generating more revenue from outside the country than from within. The support from a parent, which has a large stake, and Rakesh Jhunjhunwala holding another big chunk has helped the stock.
FINANCIALS
₹37L 1995
HDFC Bank | What sets it apart from other performers is the consistency with which it has delivered. It has generated a 20% profit growth over the years, irrespective of market conditions. The bank, which started out by cherry-picking corporate salary accounts for retail deposits, is now a pan-India institution that has cracked the ability to deliver small loans profitably and gained global recognition. Despite its scale, it is on the cutting edge of innovation and gives fintechs a run for their money with its digital strategy.
₹20L 1993
HDFC | HDFC is synonymous with home loans. What makes it a star performer is that despite competition from banks, it is able to maintain its scale of operations without diluting its loan quality. The strict underwriting and a practical approach to loans has resulted in the company having the lowest level of bad loans among all lenders including banks. What many do not realise is that besides being a housing finance company, HDFC is an investment co holding large chunks of valuable businesses like banking, life & non-life insurance and stockbroking.
Bajaj Finance | When Rahul Bajaj split his business between his sons
₹30L 1994
Rajiv and Sanjiv, it looked like the younger Sanjiv Bajaj was getting an offshoot of the main family business. No corporate had cracked financial services. But this was one rare instance where the division of business led to the multiplication of wealth. Bajaj identified that there were manufacturers and retailers willing to partner lenders who finance the purchase of their products. Also, technology was available to deliver small loans after underwriting customers. The result — a company that is valued at over Rs 3 lakh crore, more than SBI’s Rs 2.6 lakh crore.
₹2L 2008
Bajaj Finserv | While its twin Bajaj Finance gets most of the loans and the market valuation, Bajaj Finserv has the advantage of being a holding company, which owns two extremely valuable insurance businesses. Unknown to most, Bajaj’s insurance joint ventures are the most profitable private insurance companies. Although two decades ago, Bajaj had contracted to sell a majority stake to foreign partner Allianz if laws allowed it, however, the absence of liberalisation enabled Bajaj to retain a majority in the insurance companies, which continue to thrive as part of Bajaj Finserv group.
PHARMA
₹2.2Cr 1991
Dr Reddy’s | Dr Reddy’s Laboratories, listed here in 1991, is one of the first drug companies to be listed on the NYSE. It was set up in 1984 by (late) K Anji Reddy and his associates. Dr Reddy’s has a diversified manufacturing footprint spread across India, the US, the UK, China and Mexico, and is considered a proxy for foreign investors.
₹47L 2003
Divi’s Labs | Founded by Murali Divi in 1990 after a split from Dr Reddy’s, it’s been on an uptick due to consistent and strong performance. Divi’s is one of the largest generic API manufacturers globally, and an established player in the highly-lucrative CDMO business (contract development and manufacturing organisation) with a strong relationship with six of the top 10 Big Pharma.
₹31L 1994
Sun Pharma | It was started by Dilip Shanghvi in 1983 with a capital of few thousand rupees. Listed in 1994, it is now the world’s fourth-largest generics player. It has had a steady streak upwards, underpinned by lucrative acquisitions like Taro, a strong, diversified portfolio in India, which gives it a commanding share of over 8%. The company’s offerings of branded generics and specialty generics in the US, provide an edge, fetching significant margins. (Text by Shilpa Phadnis, Mayur Shetty, Reeba Zachariah & Rupali Mukherjee)
1995-2020

From: December 24, 2020: The Times of India
See graphic:
India’s top wealth creators, 1995-2020
2013-18: HDFC Bank, RIL top
HDFC Bank, RIL create most wealth in FY13-FY18, November 6, 2018: The Times of India
From: HDFC Bank, RIL create most wealth in FY13-FY18, November 6, 2018: The Times of India
Consumer-Driven Cos Most Consistent: Study
Companies from sectors that are consumerdriven — like FMCG, retailfocused banks, passenger vehicles and cement — are the most consistent in creating wealth for shareholders in the long term. Of these sectors, banking and financial services companies have been emerging as the fastest wealth creators of late, according to a study by leading domestic financial services house Motilal Oswal.
The study also noted that Titan, the Tata Group company that’s a major player in the watches and jewellery sector, is the most consistent wealth creator in India, followed by Godrej Consumer. Both the companies are majority-owned by Parsi families, known for entrepreneurship and long-term business acumen.
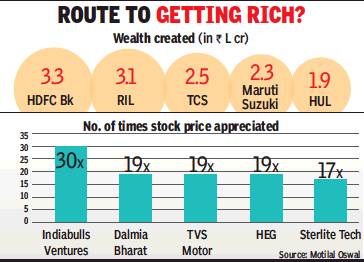
The study also showed that HDFC Bank, Reliance Industries and TCS were the biggest wealth creators for their shareholders in the last five years, starting fiscal 2013, while Indiabulls Ventures, Dalmia Bharat and TVS Motors were the fastest wealth creators during the same period. The annual wealth-creation study, with market capitalisation as the proxy for wealth, is in its 23rd year.
The study found that between these five fiscals, private sector banking major HDFC Bank had created about Rs 3.25 lakh crore worth of wealth for its shareholders, followed by Reliance Industries (Rs 3.1 lakh crore) and TCS (Rs 2.5 lakh crore). Indian oil Corp is the only PSU in this list that created about Rs 1 lakh crore worth of shareholders’ wealth.
It also showed that Indiabulls Ventures nearly doubled its stock price every year during the last five fiscals, while Dalmia Bharat’s stock price, on an average, went up by 81% every year. For TVS Motor, the corresponding figure was 80%. The top 100 companies on BSE that were considered for this study together created value worth nearly Rs 45 lakh crore.
2020

From: January 5, 2021: The Times of India
See graphic:
The top wealth creators and destroyers of 2020.
2021
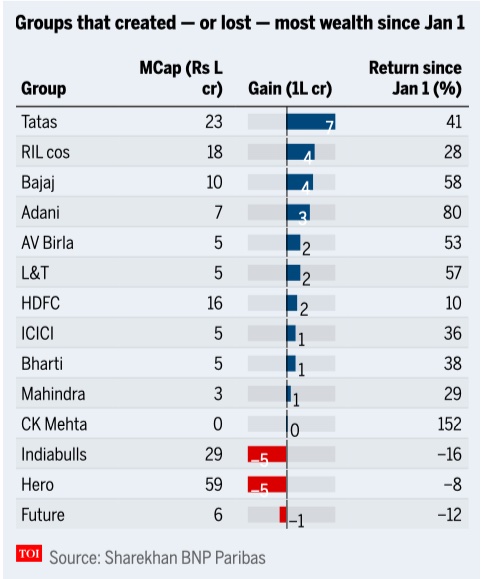
From: Reeba Zachariah, Sep 26, 2021: The Times of India
See graphic:
Corporate performance in India, 2021, Jan- mid Sept
Inputs, raw materials as %age of net sales
2008-2020
Mahesh Vyas, December 5, 2020: The Times of India
Why profits rose sharply during lockdown
NEW DELHI: The main reason why the corporate sector made bumper profits in the quarter ended September 2020 was the significantly lower spending on inputs compared to the sales. Both, sales and expenses declined sharply during the lockdown quarters of June and September 2020. But, expenses fell more sharply than sales did. This helped the corporate sector record bumper profits.
Purchase of raw materials and finished goods for resale accounts for the bulk of the cost structure of non-finance companies. Traditionally, its share has been well over 50 per cent. Therefore, if expenses on account of these grow at a slower pace than the growth in sales, it has a huge impact on the profits. In the past two recessionary quarters when business has shrunk, the fall in expenses on raw materials and finished goods was significantly greater than the fall in the topline. The profits, therefore did not shrink and in fact grew even though the business shrank.
But, how can the growth in expenses on raw materials and purchased finished goods be lower than the growth in sales? This can happen because of one or a combination of more than one of the following three factors a shift in the terms of trade or, by a drawing down of inventories, or through efficiency gains.
A favourable shift in the terms of trade implies that the prices of raw materials and purchased finished goods rise at a slower rate compared to the increase in prices of the corresponding goods sold or, they fall at a faster rate compared to the fall in prices of goods sold.
In times of uncertainty such as the kind faced by the corporate sector during the lockdown, companies would prefer to use the raw materials and purchased finished goods available in their stock and not replenish them till these are drawn down substantially and the uncertainty of the business environment reduces.
During the lockdown, the logistics cost of replenishing stocks could have increased and this could be a cost companies would try and avoid. This would directly lead to a fall in raw material and purchased finished goods stock. But, companies would try their best to sell in a difficult market to meet their fixed cost. This positively impacted profits in the September 2020 quarter.
The third factor of efficiency gains usually plays out over the long run. Efficiency gains are obtained by companies engineering structural changes including inventory management to reduce the effective working capital cycle.
We can examine the impact of a shift in terms of trade using the wholesale price indices for manufactured goods on the one hand and, minerals, crude petroleum and gas, fuel and power, and non-food-non-mineral primary articles such as fibres and oilseeds which are inputs to manufacturing companies. Prima facie, manufactured companies did gain from favourable terms of trade in the September 2020 quarter.
The wholesale price index of manufactured products rose y-o-y by 1.19 per cent. However, the index for fuel and power fell 9.49 per cent, that for non-food-non-mineral articles fell by 2.41 per cent and crude oil and natural gas fell by 17.74 per cent. Only the index for minerals rose by 4.99 per cent. The minerals index has a weight of only 0.83 per cent in the WPI compared to crude petroleum and gas that has a weight of 2.41 per cent, non-food articles of 4.12 per cent and fuel and power of 13.15 per cent.
Manufacturing companies had favourable terms of trade even in the June 2020 quarter. Prices of manufactured goods fell by 0.03 per cent but those of fuels were down by 17.36 per cent, non-food articles by 3.23 per cent and crude petroleum and natural gas by 35.59 per cent. Only minerals rose 1.40 per cent.
Next, we examine the role of draw-down of inventories. A quick way of examining this would be the ratio of raw material costs as a per cent of sales. In the present case such a comparison will be partially confounded by the terms-of-trade factor described above. Nevertheless, it may be instructive to see the behaviour of this ratio in the past two quarters.
The raw materials to sales ratio dropped from over-50 per cent historically, to 44 in the June 2020 quarter. This is a very sharp fall and may not be explicable entirely by the change in terms of trade. It implies that companies spent less on raw materials than they earned through sales. This is possible through drawing down of inventories. But, inventories are not infinite. At some time they have to be replenished.
In the September 2020 quarter, the raw material to sales ratio climbed to 50 per cent. This is still lower than historical values which were higher than 50 per cent. Companies were still drawing upon inventories. But, this was much lesser than it was in the June 2020 quarter.
If, as is evident from the above, companies have been drawing down inventories for two consecutive quarters, then the need to replenish in the coming quarters will be correspondingly high. This could mean that sales growth would be lower than growth in expenses on raw materials and purchased finished goods.
But, it may not be wise to expect the replenishing of stocks to be an arithmetical phenomenon. Business managers do not waste a crisis easily. The lockdown is likely to have taught them lessons to manage with lower stocks. We say this with some confidence because historically, companies have been systematically reducing the ratio of raw materials and purchased finished goods to sales. A structural change is underway.
The ratio has come down from 60-65 per cent till 2014 to 55-58 per cent since then. It is possible that this ratio will structurally fall further as companies worry about the increased risks and uncertainties of the new post-pandemic world.
(Mahesh Vyas is an economist and CEO of Centre for Monitoring Indian Economy)
Integrity and corporate governance
2011-18

From: September 26, 2018: The Times of India
See graphic:
Integrity and corporate governance in India, 2011-18
Management, senior: liabilities of
Top officials cannot be prosecuted if no specific allegation/ SC
AmitAnand Choudhary, Sep 29, 2021: The Times of India
Observing that vicarious liability cannot be imputed automatically on the top management for an offence committed by the company in the absence of any statutory provisions, the Supreme Court has said that chairman/managing director/director of a company cannot be prosecuted if there is no specific allegation against them.
A bench of Justices M R Shah and A S Bopanna said in such cases, a magistrate had to record his satisfaction about a prima facie case against the managing director, the company secretary and the directors of the company and the role played by them in their respective capacities before initiating criminal proceedings against them. It said they cannot be summoned in a routine manner on a bald statement made against them for the offence committed by their company.
The bench upheld the order passed by the Karnataka High Court setting aside summon order passed by a magistrate against the managing director and other top officials of a company on a private complaint filed by a person alleging that they all had connived and were involved behind the company's actions for damaging his property. He alleged that his compound wall was demolished and trees were cut by the company while laying down a pipeline.
The top court noted that there was no specific allegation against any of the officials who were not even present in the city when the alleged trespassing and demolition took place.
“As held by this court in the case of India Infoline Limited, in the order issuing summons, the learned magistrate has to record his satisfaction about a prima facie case against the accused who are managing director, the company secretary and the directors of the company and the role played by them in their respective capacities which is a sine qua non for initiating criminal proceedings against them. Looking to the averments and the allegations in the complaint, there are no specific allegations and/or averments with respect to role played by them in their capacity as chairman, managing director, executive director, deputy general manager and planner & executor,” the bench said.
“Merely because they are chairman, managing director/ executive director and/or deputy general manager and/orplanner/supervisor of A1 & A6(companies), without any specific role attributed and the role played by them in their capacity, they cannot be arrayed as an accused, more particularly they cannot be held vicariously liable for the offences committed by A1 & A6,” it said. The bench said automatically they cannot be held vicariously liable, unless there are specific allegations and averments against them with respect to their individual role.
Micro-markets
Catering to them, As in 2019
Namrata Singh, February 12, 2020: The Times of India
From: Namrata Singh, February 12, 2020: The Times of India

From: Namrata Singh, February 12, 2020: The Times of India

From: Namrata Singh, February 12, 2020: The Times of India
From: Namrata Singh, February 12, 2020: The Times of India
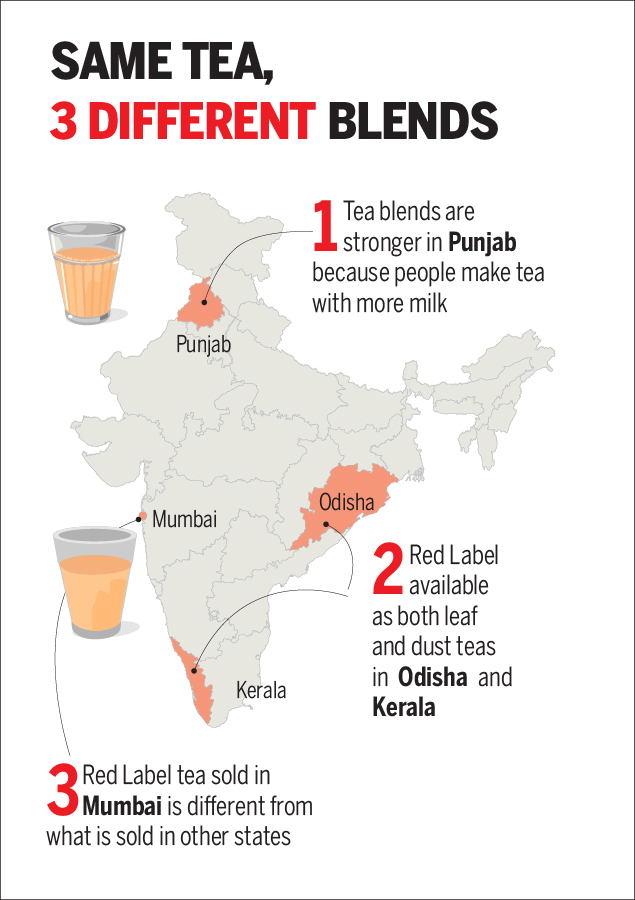
Punjab likes tea with extra milk, so Hindustan Unilever (HUL) sells stronger blends in the state. The brand names are the same, the packaging is pan-Indian, but the tea itself changes from region to region. Welcome to the era of ‘micro-markets’ where one size no longer fits all, and marketers slug it out for dominance in each one of the ‘many Indias’.
“Step back and compare South Mumbai to suburban Mumbai,” said HUL CFO Srinivas Phatak, “there’s a fundamental transformation in the profile of consumers.” Their tastes and budgets are different, so the way stores are stocked differs. For companies, the challenge is to achieve the right level of ‘disaggregation’. “If you are able to get that right, you are able to service the consumers very differently.” The fight for every inch of ground is partly technology-driven. Earlier, the FMCG majors were in an unassailable position. Their scale of distribution and communication, and their brand equity, kept new players out. But now, any upstart can catch consumers’ attention on social media. This by itself may not weaken brand loyalty, but new brands can have phenomenal trial rates.
HUL woke up to this changed reality first with its ‘Winning in Many Indias’ (WIMI) strategy that sorted the country into 14 clusters. Godrej Consumer Products (GCPL) is launching its ‘Conquering Micro Markets’ (CMM) plan in phases, and Dabur India aims to grow with its ‘Project RISE’ (Regional Insights and Speed in Execution) that sees India as 12 geographical clusters.
“Different states are growing differently from a GDP perspective, or in terms of infrastructure and agriculture,” said HUL executive director (home care) Priya Nair. “Chhattisgarh and Tamil Nadu are very different structurally, in terms of their GDP patterns, income profiles and consumer habits. The right strategy in Chhattisgarh is not equal to the right strategy in TN.”
A company may be ahead in a region or a state, but focusing on micro-markets tells it where it can do better within the region. “We are zeroing in on micro-markets through what we call dynamic district regions or DDRs,” said GCPL CEO (India & SAARC) Sunil Kataria. “In UP alone we have around 7 DDRs. Till now, we would do maybe one television ad for entire UP. When we look at DDRs, the game changes completely.”
“We used to be 4-5 branches a decade ago, and it worked very well for us then. Today, we think 14 WIMI clusters is the right way to do it. Maybe, in some time, it could be a completely different paradigm,” said Phatak.
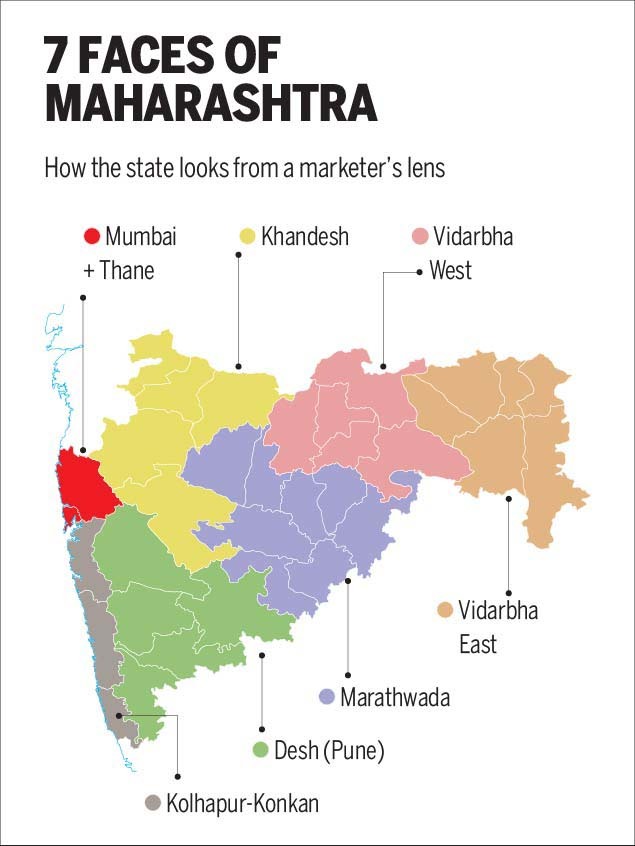
Maharashtra is one of the biggest states for FMCG companies in terms of size and value. GCPL has divided it into seven smaller district clusters under its micro-markets plan — Vidarbha East, Vidarbha West, Marathwada, Khandesh, Kolhapur-Konkan, Desh Pune and Mumbai plus Thane. “There are pockets in Maharashtra where GCPL has headroom for growth. Our micro-marketing approach for cluster districts gives us an opportunity to understand these skews,” said Kataria. “Each of these districts exhibits its own unique cultural nuances in language, food, occupations and the media they consume.”
In Marathwada, for instance, both Marathi and Dakhini are spoken. It is drought-prone and under-developed. Vidarbha in the state’s east is surrounded by Madhya Pradesh and Chhattisgarh, and most people speak Varhadi and Zadi dialects of Marathi and Hindi.
Kataria said a region’s standard of living affects its media consumption, which is an important part of marketing strategy. “For example, in Vidarbha and Marathwada, TV is the lead media followed by mobile, while print and digital penetration is relatively less. However, in the Kolhapur-Konkan region, apart from TV, print and digital are also well received by consumers. In cities like Mumbai, Thane and Pune, internet penetration is the highest along with the influence of cinema.”
How effective are these micro-market strategies? “In Northeast India, where Dabur did a pilot of Project RISE, revenue grew about 30% in the cluster,” said Dabur India CEO Mohit Malhotra. “We may get lead measures, but the final proof would be if my share changes in 4-5 months. In six months, we would like to see some quick wins. It will take one year to get an idea of how to do this,” said Kataria.
Understanding the change is one thing, building a marketing strategy around it is another. Considering that India has 10 million FMCG outlets, of which about 6 million are in rural areas, the task is tough. Old-school marketing based on gut-feel doesn’t work anymore. Now it’s all about deriving consumer insights from data.
“It’s easier said than done. One thing we are realising is that the way we all learnt marketing over the years is changing completely,” said Kataria, indicating that mindsets need to change. While GCPL will have a regional trade marketing head in each of its regions, it may need to double efforts for local implementation.
Systems, processes and technology also need to be brought up to date to implement such a differentiated marketing plan. HUL has a head for each of its WIMI clusters. “We expect marketers to have a more experimental mindset. As an organisation, we are investing significantly in experimentation on how to win the consumer,” said Phatak, adding that anyone who has the scale and capabilities along with the ability to be agile, responsive and nimble will succeed.
Number of companies

India and the world: Number of listed companies (July 2015)
Listed and unlisted registered companies in India
2019

From: Sidhartha, Dec 27, 2019 The Times of India
See graphic:
Listed and unlisted registered companies in India, presumably as in 2019
Number of companies by market capitalization
Billion-dollar companies
2019- 2024
See graphic:
Number of Billion-dollar companies in India by market capitalization, 2019- 2024
Subsidiaries, associates, JVs
2023
Sep 18, 2024: The Times of India
New Delhi : Citing multiple accounting lapses, audit watchdog National Financial Reporting Authority (NFRA) proposed aligning a key accounting standard with global norms, which has been resisted by a powerful lobby of chartered accountants. NFRA has argued that it is important to converge SA600, fixed 22 years ago, with the global standard to ensure that the interest of investors, particularly retail investors whose numbers are multiplying, are protected.
While doing so, it has proposed to restrict it to the audit of listed private companies — which account for under 2% of the 17 lakh active companies in the country. In the process, it also sought to dismiss concerns of small audit firms being hit by the move.
While the International AS 600 was revised in 2009 and 2023, a bunch of auditors have blocked a similar revision in India, despite RBI and Sebi backing the plan. “We are still riding in a Santro car when the world has moved to modern vehicles,” said an official.
In its 35-page consultation paper, NFRA has highlighted how the gap — which does not let the principal auditor coordinate with other auditors of subsidiaries or even check paperwork — has led to multiple failures from Reliance Capital to Reliance Home Finance, Reliance Commercial Finance, DHFL, IL&FS, and Café Coffee Day.
Analysing data, it pointed out how 100 listed companies (excluding banks and insurance companies) had multiple subsidiaries, associate companies, and joint ventures with at least 23 having over 50 such entities, while 76 had overseas entities. In several of these companies, over 50% of the net assets were from subsidiaries, associates, and JVs.
Citing the increase in de- mat accounts, mutual fund SIPs and pension schemes, the paper said: “The primary reason for proposing adoption of a revised atandard for group audits is to help safeguard public interest and investor protection, and the need for a standards framework that is robust enough to meet the challenges posed by complex financial systems today. The inherent complexity of group structures… cannot be handled by the 2002 version of SA 600 and the related provisions across other standards.”
NFRA also said various panels have underlined the need to converge domestic and global standards.
Ownership pattern/ structure
As in 2021
Chandra Bhushan, March 6, 2021: The Times of India
Family ownership is the most dominant form of business around the world. Historically, family businesses have dominated the Indian industry. Until the 1990s, a few old business ‘houses’ were dominant, holding diversified business interests across the economy. Their dominance was partly enabled by the planned economy ‘license raj’ model of the time. Since the economic reforms of 1991, these older business houses have been challenged by new families and non-family entrants. But the power of family conglomerates as a business model has not diminished. While some of the older houses did not survive the reforms, many – such as the Tatas, the Bajajs, the Birlas, the Mahindras – did and flourished and are joined by new houses –the Ambanis, the Adanis, the Mittals, and the Jindals.
Presently, India has the third-highest number of publicly-listed, familycontrolled companies in the world, after China and the United States. Fifteen of the BSE Sensex – the index of 30 reputed companies listed on the Bombay Stock Exchange – are family-controlled, accounting for more than half of the Sensex combined market capitalisation. Share-price returns of family businesses have also consistently outperformed non-family firms.
Profit growth
2012-2020
Mahesh Vyas, November 19, 2020: The Times of India
From: Mahesh Vyas, November 19, 2020: The Times of India
From: Mahesh Vyas, November 19, 2020: The Times of India
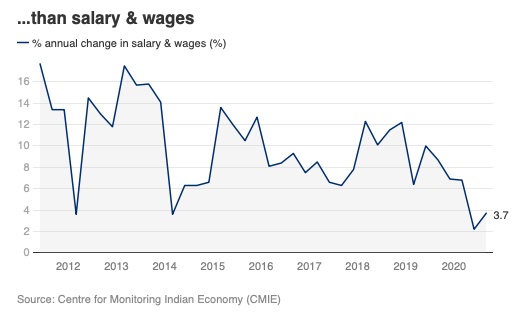
Covid-19: Why profits have rebounded faster than wages
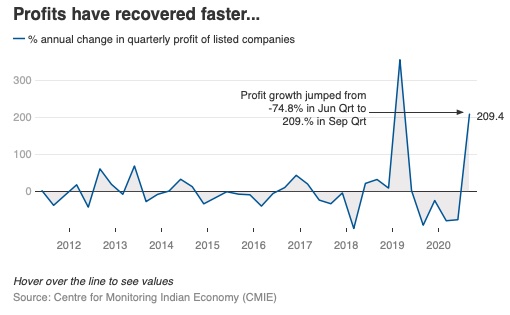
NEW DELHI: Companies listed on the stock markets made bumper profits in the quarter ended September 2020. They registered their highest aggregate profits during the most recessionary times in Indian history. The economy is shrinking this year and companies have seen their sales decline year-on-year for five straight quarters. But, listed companies have never made profits like they made in the quarter ended September 2020. Understandably, shareholders are being awarded interim dividends or buy-backs. There is still very little interest in investing into new capacities.
Owners of capital have benefitted well in these very difficult times. But, labour has not been as lucky. Growth in profits in the September 2020 quarter was higher than in the top quartile of the distribution of profits growth over the past 60 quarters, which was 21.9 per cent. Wages grew by 3.8 per cent in the quarter of September 2020, which was lower than the bottom quartile of its distribution which was 7.8 per cent.
The average y-o-y growth in wages over the past 60 quarters has been of the order of 13 per cent. The low single-digit growth in wages in the last two quarters is therefore very low by historical standards and is in stark contrast to the extraordinary profits earned by companies.
It is enticing to compare the growth in profits against growth in wages. It harks back to a classic tussle between owners of capital and owners of labour. But, in business and for corporate honchos, there is no relation between growth in profits and growth in wages. The two move completely independently. Corporate managers would minimise their wage bill to maximise their profits.
Manufacturing companies witnessed a 9.1 per cent fall in wages in the June 2020 quarter. This was the toughest quarter. Sales had shrunk by 42 per cent and net profits by 62 per cent. An axe on the wage bill was understandable. Then, in the September 2020 quarter, while sales fell again by 9.7 per cent, profits sprang a surprise by scaling up by a handsome 17.8 per cent. Yet, wages declined by one per cent. Evidently, companies do not apportion resources to labour in any proportion of profits.
Labour has a structural relationship with other costs. In listed manufacturing companies, wages accounted for 4-5 per cent of net sales till 2014 and since then it has accounted for 5-6 per cent. In the June 2020 quarter in spite of a 9.1 per cent fall in the wage bill, its share in net sales went up to 8.6 per cent. In the September 2020 quarter it was 6.2 per cent, which was closer to its earlier level. This share is still higher than historical levels and this could make a case for a further cut by either a recovery in business and thereby an increase in other costs or through further cuts in the wage bill.
Labour plays a bigger role in the cost structure of the services sectors. In non-financial services, wages accounted for about 15 per cent of net sales till 2014. This has since risen to 20-21 per cent. In the June 2020 quarter, this spiked to 27.6 per cent. Then it came down to 24 per cent in the September 2020 quarter. But again, it is out of line with the past cost structures and therefore is likely to decline as a proportion of net sales as the business improves.
The non-financial services sector suffered losses on an aggregate basis in the March and June 2020 quarters. Profits were posted in the September 2020 quarter. However, the large sustained losses in the communications, aviation, trade and hotels and tourism industries may continue for some more quarters. This raises doubts about the ability of these labour intensive industries to provide employment again in the short term.
Employment in the corporate sector could recover if business picks up again and employment would grow only if the corporate sector starts investing into new capacities. New reports suggest that the banking and IT sectors have started awarding pay hikes and bonuses. But, these two sectors were outliers in the fall in sales and wages in the last two quarters. Wages in the banking industry grew by 23-24 per cent and in the IT sector they grew by 5-6 per cent during this period. The remaining sectors collectively saw a 9 per cent fall in wages in the June quarter and a 5 per cent fall in the second quarter.
The outstanding profit performance in the September 2020 quarter may contain any fall in the wage rate in the corporate sector for some time but, employment growth will depend upon a sustained revival of demand. The last quarter benefitted from an exceptionally good southwest monsoon, a correspondingly bumper kharif crop, increased spending on MGNREGA and pent-up demand.
The rising share of wages in the total cost structure of manufacturing and services companies could bring it under the managers’ axe if demand does not pick-up. The lockdown has taught companies a lesson or two on running business with fewer human resources. These lessons are unlikely to be forgotten.
(Mahesh Vyas is an economist and CEO of Centre for Monitoring Indian Economy)
2015 – 2023

From: July 31, 2023: The Times of India
See graphic:
Corporate profits, 2015-2023
Profit-to-GDP ratio
2019: lowest in 15 years
Cos’ profit-to-GDP ratio at 15-year low, January 26, 2019: The Times of India
From: Cos’ profit-to-GDP ratio at 15-year low, January 26, 2019: The Times of India
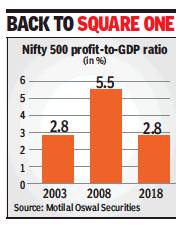
The contribution of India Inc’s profitability to the country’s GDP dipped to a 15-year low in fiscal 2018, thanks mainly to the below-par performance by public sector banks. From a high of 5.5% in 2008, the ratio of corporate profitability to India’s GDP is currently at 2.8% — the same level it was in 2003.
The other sectors that contributed to this decline significantly were the metals and oil & gas sectors, where prices are dictated mainly by global factors, along with the telecom sector, which saw huge competition in the past few years. On the other hand, the sectors that cushioned the fall were private banks, NBFCs, autos and technology, all of which put up a good show, according to a report by domestic brokerage major Motilal Oswal Securities.
“Over the last decade, the corporate earnings distress in India has translated into corrosion in the Nifty 500 profitto-GDP ratio from 5.5% to 2.8%,” the report noted. “Sectors that have been most stable and rising to prominence over these 15 years are technology, NBFCs, private financials, autos and metals. Profits of these sectors as a percentage of GDP has increased by three-four times over 2003-18.”
The report pointed out that profit contribution to GDP of NBFCs is at a new high (0.40%), while that of PSU banks is at a new low (-0.44%).
2011-2021
Dec 7, 2021: The Times of India

From: Dec 7, 2021: The Times of India
See graphic:
The Profit: GDP ratio of Indian companies, 2011-2021
The ratio of profits generated by listed companies to GDP has risen to 2. 9% — the highest since 2015. There are several reasons for this. First, the pandemic has resulted in consolidation of business, with larger entities gaining share. Second, a record dip in interest rates has helped companies. Third, a large contribution comes from the financial sector, which has turned around in FY21… (Source: CMIE, UBS)
2021, 2022

From: June 29, 2022: The Times of India
See graphic:
The Profit- GDP ratio of Indian companies, 2018- 22
Sales revenue
2015-16: worst year since 1991
Atul Thakur, February 12, 2018: The Times of India

profit after tax,
of 21,000 Indian companies
From: Atul Thakur, February 12, 2018: The Times of India
HIGHLIGHTS
Sales during 2015-16 grew at a mere 1.6 per cent, worst since the liberalisation of economy in 1991
Over these 26 years, there have been five years in which growth in sales revenue crossed 20 per cent, with the 27 per cent recorded in 1994-95 being the highest
The year 2015-16 was the worst corporate India has seen in the post-liberalisation era in terms of growth in sales revenue. Sales during that year grew at a mere 1.6 per cent, shows data from the Centre for Monitoring Indian Economy (CMIE), an independent agency that tracks economic and business data.
The data, which collates information for over 21,000 companies, shows that other indicators like profitability and growth in employee compensation during 2015-16 were also among the worst in the last 26 years.
The data for the period 1990-91 to 2015-16 shows that there were only six years in which the combined sales of all the companies being tracked grew at single-digit rates and 2015-16 was by far the worst. The growth in corporate sales was just over 3 per cent for 2001-02, the second-lowest in this period.
Over these 26 years, there have been five years in which growth in sales revenue crossed 20 per cent, with the 27 per cent recorded in 1994-95 being the highest.
Not surprisingly, profitability took a severe beating. In 2015-16, profit after taxes (PAT) for 21,588 companies for which CMIE compiled data fell by more than 19 per cent, the third-largest year-on-year decline since 1990-91. The worst was in 2011-12 when profits had shrunk by over 20 per cent. In 2008-09, the year of the global financial crisis, posttax profits had gone down by nearly 20 per cent.
What makes the profitability picture even gloomier is that it comes on the heels of really low growth rates in post-tax profit in the previous two years —nearly 4 per cent in 2013-14 and 1.5 per cent in 2014-15. As a result, if one looks at the five-year period from 2011-12 to 2015-16, what emerges is that profits in the last of those years was about 25 per cent lower than in 2010-11.
This five-year period stands out as an exception in the entire post-liberalisation era. The years immediately following liberalisation saw extraordinary jumps in corporate profits. In 1993-94 and 1994-95, PAT increased by more than 90 per cent, the highest for this period. Similarly, 2002-03 and 2003-04 saw almost 58 per cent and over 69 per cent increases, respectively, in profits.
Given stagnant sales and declining profits, it should come as no surprise that 2015-16 saw one of the lowest increases in total compensation to employees — just above 9 per cent, the lowest since 2010-11. To put that in perspective, even 2009-10, the year following the global financial crisis that witnessed job losses and salary rollbacks, saw a more than 7 per cent increase in employee's compensation. Stagnant sales and falling profits also explain a continued fall in private investment growth, which started in 2012-13.
The CMIE data, mercifully, suggests that there was some respite from this gloomy situation for India Inc with a smaller sample for 2016-17, which covered 7,152 companies, showing an improvement in all these indicators. Sales were up just over 6 per cent, PAT 18 per cent and employee compensation nearly 10 per cent. Whether this trend will hold when data for the full sample of over 21,000 companies becomes available remains to be seen.
Sales vis-à-vis inventories
2004-2018
August 22, 2018: The Times of India
From: August 22, 2018: The Times of India
See graphic:
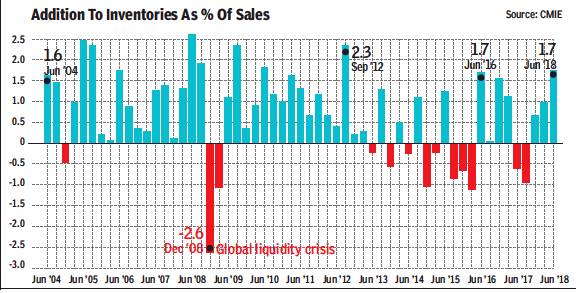
Addition to inventories as % of sales, 2004-2018, June
For quarter ending June, inventories as percentage of sales for listed non-finance companies climbed up to a 23-quarter high. The highest build-up was with makers of commercial vehicles, readymade garments and machinery. Is this a sign of demand slowdown towards the end of the last quarter or expectations of a high demand in the forthcoming busy season (Oct-Dec)? Experts are betting on the latter
August 17, 2019: The Times of India

From: August 17, 2019: The Times of India
Govt eases norms for DVR shares
Special Stocks Get Up To 74% Voting Power, Even With A Small Stake
New Delhi:
The government eased rules for issuing shares with differential voting rights (DVR), allowing those with special category shares to have up to 74% voting power, even if they hold only a small stake in the company.
The move meant to enable promoters — especially of startups — to retain control while raising growth capital. The amendments announced by the ministry of corporate affairs on Friday will also end ambiguity in the earlier rule, which had capped DVR shares at 26% of the post-issue equity capital, which was also interpreted by many as the ceiling on voting rights. “Now someone with 10% equity holding can have 74% voting rights if she holds DVRs,” said an officer.
The ministry of corporate affairs has also dispensed with the requirement of distributable profits for three years for a company to be eligible to issue DVR shares.
“These two initiatives have been taken by the government in response to requests from innovative technology companies and startups and to strengthen the hands of Indian companies and their promoters, who have lately been identified by deep pocketed investors worldwide for acquisition of controlling stake in them to gain access to the cutting edge innovation and technology development being undertaken by them. The government had noted that such Indian promoters have had to cede control of companies, which have prospects of becoming unicorns (valued at $1 billion), due to the requirements of raising capital through issue of equity to foreign investors,” an official statement said.
To benefit startups recognised by the department for promotion of industry and internal trade (DPIIT), the government has also doubled the time period within which employee stock options (ESOPs) can be issued to promoters or directors with over 10% stake to 10 years from the date of their incorporation.
While new companies can include DVR provisions in their articles of association (AoA) at the time of incorporation, those which have been registered will need to amend the AoA. The change in DVR rules came along with easing of norms by Sebi for listed companies. Officials explained that an unlisted company will now have to amend its AoA and wait for a year to take advantage of the relaxations ushered in for listed companies.
Sector-wise performance
2010-14
HIGH-GROWTH RIDE - Auto, Pharma top wealth creators in 4 years
The Times of India, Jan 01 2015


Partha Sinha & Shubham Mukherjee
Realty, infra cos saw biggest value erosion since the 2010 highs as the economy went through a turmoil and the markets stagnated before rebounding to new peaks in 2014
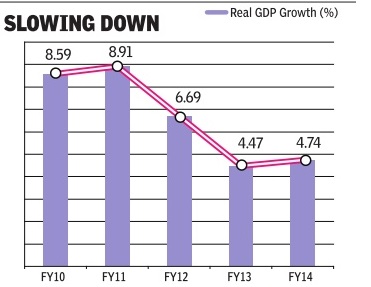
Just over four years ago, the Indian economy was cruising at a near 9% annual rate of growth and on Di wali day in 2010, the sensex scaled a new high, closing above the 21,000 mark for the first time ever.However, since then as inflation rates spiked and interest rates spiralled, the government entered a phase of prolonged policy paralysis with the growth nearly halving to about 4.5% within two years. Rupee depreciation and widening current account deficit added to the negativity and it has since been a phase of almost flat GDP growth with muted corporate performance.
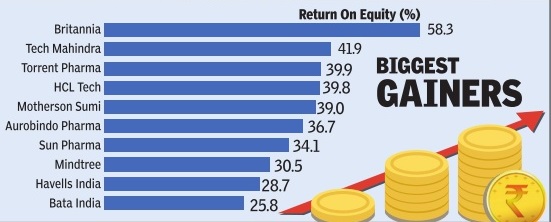
But a focused group of companies braved the headwinds and posted handsome returns for anyone who had invested in them, reveals a TOI-commissioned study done by Motilal Oswal Securities (See `Top Of The Charts' table). Significantly, most of these companies are not even leaders in the respective industries they operate in.Incidentally , the sectors that created wealth such as healthcare, consumer, automobiles, private sector banks and retail are all consumer-facing.
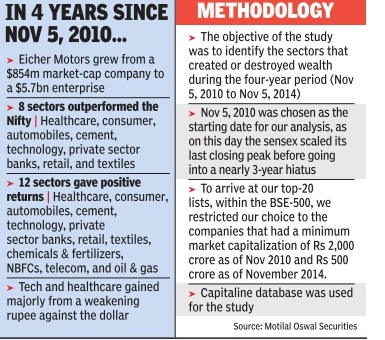
Topping the list of these outliers is Eicher Motors, makers of Royal Enfield bikes, with an eye-popping stock rise of about nine times in just four years. The stock rose from Rs 1,410 in early November 2010 to Rs 12,849 on this Diwali day . On the flip side, the biggest loser is MMTC with a current market capitalization of just about 5% of the value four years ago. So if you had invested Rs 100 in MMTC four years ago, you would be left with just Rs 5.
When contacted by TOI, Siddhartha Lal, MD & CEO, Eicher Motors, credited his performance to a differentiated product offering, providing a seamless chain between production to retail and an unrelenting focus on the two product lines motorcycles and commercial vehicles. “We are committed to the investor community and our longterm focus may have added to this (performance),“ he said.
Six of the top-20 wealth creators Eicher Motors, Motherson Sumi, TVS Motor, MRF , Wabco India and Apollo Tyres belong to automobiles. Consumer (Berger Paints, Bata India and Britannia), healthcare (Aurobindo Pharma, Sun Pharma and Torrent Pharma), and technology (Mindtree, HCL Technologies and Tech Mahindra) have contributed three companies each to the top-20 wealth creators' list. Besides, there are two NBFCs (Sundaram Finance and Bajaj Finance), a cement company (Shree Cement), a capital goods company (Havells India), and a Logistics company (Blue Dart Express).
Rajat Rajgarhia, MD, institutional equities, Motilal Oswal Securities, puts the findings of the study in perspective. “ Any time is the right time to buy stocks; the art lies in stock-picking. Even during the last four years, when the market indices have gone nowhere, numerous stocks have multiplied several times. On the flip side, hordes of stocks are now available at small fractions of their value four years ago,“ he said.
In contrast to the stocks that have grown investors' wealth multiple times, some of the worst performers have lost up to 95% of their value during this period, while a large number have witnessed around 75% value erosion (See `Bottom Of The Pile' table). All the stocks in the list of top-20 wealth destroyers have erased at wealth destroyers have erased at least 75% of their market capitali zation during the four-year period.
Some of the top laggards are from sectors which have been in a secular downturn for the past few years like power, real estate, infra structure and sugar. Companies like Shree Renuka Sugars, Bajaj Hindustan, JP Power Ventures, etc belong to this group.Metal companies like MMTC, Monnet Ispat and Hindustan Copper are in a cyclical downturn. There's a third group, consisting of companies which got into major controversies and faced regulatory scrutiny . DB Realty , Financial Technologies and Bhusan Steel belong to the third group.
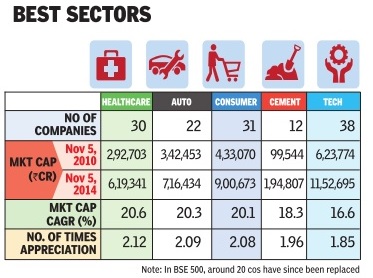
Eight sectors outperformed the CNX Nifty over the four-year period: healthcare, consumer, automobiles, cement, technology , private sector banks, retail, and textiles (see `Best Sectors' table). All other sectors chemicals & fertilizers, NBFCs, telecom, oil & gas, capital goods, media, public sector banks, utilities, metals, real estate, and miscellaneous underperformed. A total of 12 sectors healthcare, consumer, automobiles, cement, technology , private sector banks, retail, textiles, chemicals & fertilizers, NBFCs, telecom, and oil & gas delivered positive returns. Seven sectors capital goods, media, public sector banks, utilities, metals, real estate, and miscellaneous delivered negative returns. The performance of the technology and healthcare sectors has been favourably impacted by a weakening rupee. Most of the sectors that destroyed wealth including real estate, metals, utilities, infrastructure, public sector banks, and capital goods are deeply cyclical and were affected by policy paralysis during the UPA-2 regime.
2022

From: Dec 10, 2022: The Times of India
See graphic:
Top sectors of 2022 Burgundy Private Hurun India 500' list
As in 2019 July
July 6, 2019: The Times of India
From: July 6, 2019: The Times of India
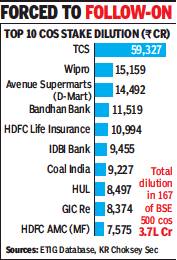
The Budget proposal to hike non-promoter shareholding in listed companies to 35% could lead to stake dilution by promoters in 167 of BSE-500 companies, including in blue chips like TCS, Wipro, HUL, HDFC Life and HDFC AMC. The government will also need to divest large stakes in a number of leading PSUs like Coal India, NHPC and several governrun banks to meet the 35% target limit. There are also several MNCs which will need to cut their stakes in their Indian arm or delist.
According to Amar Ambani, president, Yes Securities, increase in public shareholding is potentially negative for MNCs and companies with high promoters holding. “In many mid and small cap companies, it is better to have more promoter ‘skin in the game’ since India’s capital market is in the developing phase. Many listed MNCs may consider delisting, if increased public shareholding limit is implemented,” he said.
Going by Thursday’s market capitalization of these companies, total stake dilution in these 167 companies will be worth about Rs 3.7 lakh crore. “Increased public shareholding norm will also increase supply of paper in the market which means that money will be sucked out of secondary market and valuations will remain under check,” Ambani said.
This coupled with a move to levy 20% tax on share buybacks could render some of the large cap IT stocks like TCS and Wipro vulnerable believe market participants.
Leading brokerages pointed out that with huge promoter shareholdings, TCS (72%), Wipro (73%) and L&T Infotech (75%) have less than 35% public shareholding. There will be pressure on the promoters of these entities to divest stake. “We believe the consequent pressure on these entities to meet the new promoter shareholding norm would keep the respective stocks under pressure. However, the proposal is currently with Sebi and we will keep close tabs on it,” said Edelweiss Research in a note.
2014-19: Non- banks overtake MFs

From: July 11, 2019: The Times of India
See graphic, '2014-19: Shares pledged to non- banks, MFs and Indian banks'
See also
Companies/ corporations: India
Public issues, Initial Public Offerings (IPOs): India
Banking, India: I For The market capitalisation of banks
Sensex <> The stock market: India <> Mutual Funds: India <> Currency: India <> Gold in the Indian economy <> Sovereign credit ratings: India <> Corporations, corporate performance: India <> Public Companies, South Asia's Biggest