Indian states: developmental indicators


This is a collection of articles archived for the excellence of their content. Readers will be able to edit existing articles and post new articles directly |
Contents |
The best performing states, overall
2025/ CareEdge
April 30, 2025: The Times of India
Mumbai : Maharashtra emerged as India’s best-performing state in CareEdge Ratings’ 2025 state rankings, followed by Gujarat and Karnataka. The annual index, based on 50 quantitative indicators across seven pillars—economic, fiscal, infrastructure, financial development, social, governance, and environment—places Maharashtra at the top for financial development, with strong performances in economic, fiscal, and social metrics. Gujarat leads the economic pillar, driven by high per capita GSDP, FDI inflows, and industrial capital formation, while Karnataka ranks high due to its diversified economic base and environmental record.
Western and southern states dominate the upper tier of the rankings. Goa tops Group B, comprising northeast, hilly, and small states, scoring consistently across financial, infrastructure, eco- nomic, and social indicators. Odisha leads in fiscal management with sound debt control and low interest burdens, followed by Gujarat and Maharashtra. Punjab and Haryana stand out in infrastructure, while Kerala and Tamil Nadu score high in social development. Andhra Pradesh ranks first in governance, and Karnataka leads in environmental performance. The rankings exclude Union Territories and aim to provide a comparative, data-driven view of state-level progress and investment appeal.
HP, J&K, Kerala, TN: 2019- 2023
Rema.Nagarajan, Nov 16, 2025: The Times of India

From: Rema.Nagarajan, Nov 16, 2025: The Times of India
When it comes to development indicators, Kerala usually gets the spotlight. But three states — Jammu and Kashmir, Himachal Pradesh and Tamil Nadu — now top the charts with Kerala, despite not having its historic head start. On some indicators, they are even beginning to pull ahead. What these three states have in common is govts that invested early in social justice and welfare.
If life expectancy at birth indicates overall well-being, all three have crossed the 70-plus mark. In Himachal, it rose from just 52.6 years in 1970-75 to 74.4 years in 2019-23, and in J&K, from 56 to 74.4 years, according to the Sample Registration System. In the same period, Tamil Nadu’s life expectancy went up from 49.6 to 73.4 years. Other health and social indicators follow a similar arc, placing these states in the top ranks.
J&K and Himachal used land reform to successfully redistribute resources and alleviate poverty, while Tamil Nadu invested in social welfare schemes such as universalising school lunch, reserving up to 69% seats for oppressed castes in education and govt jobs, and maintaining a universal and functioning public distribution system (PDS). Each forged its own path to strengthen welfare services, adopting policies best suited for their state rather than being directed from Delhi.
J&K was the first to adopt land reform, as far back as 1948, even before the Communist govt was formed in Kerala. Land belonging to large landholders was redistributed to the poor, the cultivators and tenants. According to economist Jean Dreze, this played an important role in reducing poverty and laying the foundation of a relatively egalitarian economy in rural areas. In fact, he points out, this was possible because of Article 370. The Indian Constitution, at that time, protected land ownership. Himachal abolished the big landed estates system in 1953. These early land reforms meant that the two states have among the highest proportions of population owning agricultural land — 64% in J&K and 71% in Himachal. As many studies have shown, landlessness and poverty are closely correlated, and these two states also have relatively few who are multi-dimensionally poor (less than 5%), according to the latest Niti Aayog report, which gauges poverty on several dimensions, including access to civic amenities, health and education. This is despite very low urbanisation — 31% in J&K and 10% in Himachal. In contrast, more than half of Tamil Nadu’s population lives in urban areas, and only 2.2% are considered multi-dimensionally poor. Though it started off much worse than J&K and Himachal on most health indicators, TN has caught up and even surpassed them on many.
“Bureaucrats tend to see social sector spending as a waste and would rather spend on industries and infrastructure. But political leaders are more conscious of the people’s needs, and they continuously pushed for greater spending on social welfare, right from the 1970s, which has paid rich dividends in the long run for Tamil Nadu,” says former health secretary R Poornalingam, who pioneered the concept of a corporation to buy and distribute essential drugs and consumables for the entire public health system. This pooled procurement put an end to stock-outs and ensured better quality medicines, helping to build people’s trust in publicly funded healthcare facilities. This model has now been adopted by states across India. Several other TN schemes, once dismissed as populist, including midday meal, subsidised rice through PDS, and maternity benefit scheme, were later adopted across India.
The state has maintained a strong focus on publicly funded primary healthcare. “We have been the proverbial dissenters. When the rest of the states merged medical service and public health as recommended by the Bhore committee, Tamil Nadu alone decided to keep the public health department. The public health directorate built up our primary healthcare network of services from the 1970s. We put a woman from the village as a lady health worker in every village; these were state workers and not central govt workers. We had universalised noon meals in schools by the 1980s and lady health workers could use the noon meal centres as a coordination point,” says Dr Girija Vaidyanathan, former health secretary of Tamil Nadu.
It also focused on population control. “We convinced women to come forward for smaller families in 1975-85. Maternal and child health services run by the directorate of public health became a strong component of our health system,” adds Dr Vaidyanathan. As a result, the state’s total fertility rate (TFR), which was almost 4 in 1971, fell to 2.1 by 2000 and is currently 1.3. Infant mortality rate is 12 and maternal mortality rate is 35, among the lowest in the country. Tamil Nadu has also constantly tweaked its education policy in response to its social equity goals. From policies that helped students from Tamil medium govt schools to become doctors to reservation in postgraduate seats for doctors in govt service, it used creative strategies to ensure that the public system did not face a shortage of doctors. While Tamil Nadu has often fought the Centre to forge its own path, Himachal used central grants to prioritise health, water, electricity, education and rural infrastructure. Himachal was 100% electrified by the 1980s despite the difficult terrain. From 7% literacy in 1947, Himachal has achieved 99% literacy, becoming a fully literate state with a very high level of education among women. The state also maintained a large, trained workforce to maintain its social infrastructure, including enough anganwadi and ASHA workers, schools and hospitals. But fiscal restructuring has affected this. As a former deputy mayor of Shimla wrote recently, where almost 45,000 workmen ensured adequate services for six lakh electricity subscribers in the 1980s, there are now just 12,000 workmen for nearly 23 lakh subscribers. This slashing of public employment has started affecting delivery of services and reduced opportunities for govt jobs. “Himachal has the highest ratio of govt employees to the population as you need people to efficiently maintain and provision public services such as health, education, power, water and roads. If you see them as costs, then the problems arise,” says a govt official.
Bureaucrats in Himachal and J&K also attribute better health indices to the trust in public health facilities. These are used widely for childbirth, immunisation and other health needs compared to other states. “Most people’s first point of contact is a govt health facility like a district hospital or medical college. For higher-level care, they prefer PGI Chandigarh than a corporate hospital because of trust in public facilities,” says a senior official in Himachal. Privatisation of health is low in both states compared to TN and Kerala. According to the National Health Accounts estimates for 2021-22, people in J&K spend the least out of their own pockets on healthcare. Govt spending accounts for 71% of the total expenditure on health. It is 57.5% in Himachal and 51.7% in TN against the national average of 48%.
Clearly, it’s not just about spending to strengthen the public health system. The three states seem to be reaping the benefits of more than 50 years of policies addressing the social determinants of health by reducing social inequity and improving living conditions through better access to clean drinking water, housing, sanitation and nutrition.
Economic freedom
Gujarat tops
Gujarat is India’s top state in economic freedom
Swaminathan S Anklesaria Aiyar
The Raghuram Rajan Committee on development indicators says Gujarat’s social indicators are just middling. Looking at children of class 3-5 who can do subtraction, Gujarat has declined from 22nd among 28 states in 2006 to 23rd in 2012. However, economist Arvind Panagariya argues that Gujarat has made substantial social progress under Modi, starting from a low base.
One annual report has long provided indicators of governance. This is Economic Freedom of the States of India (EFSI), written by Bibek Debroy, Laveesh Bhandari and Aiyar. The 2013 EFSI report shows Gujarat has been No. 1 in economic freedom for the last three years, widening its lead over others. On a scale from 0 to 1, its overall freedom score has improved from 0.46 to 0.65. Tamil Nadu comes a distant second with 0.54.
Economic freedom is not identical to good governance. But lack of economic freedom typically means poor governance — a jungle of rules and obfuscating bureaucrats that promote corruption, delay and harassment. This hits everybody from farmers and consumers to industrialists and transporters.
What exactly is economic freedom? EFSI uses a methodology adapted from Economic Freedom of the World, an annual publication of the Fraser Institute. Data for Indian states is not available on many issues. So, EFSI limits itself to 20 indicators of the size and efficiency of state governments, their legal structure and property rights, and regulation of labour and business.
Many of these indicators directly measure governance — the proportion of stolen property recovered; proportion of judicial vacancies; proportion of violent crimes; proportion of investigations completed by police and of cases completed by the courts; and the pendency rate of corruption cases. The list is by no means comprehensive, but provides strong clues.
Gujarat has the best record with pendency of corruption cases, and in the proportion of non-violent crime. It is close to the top in completion of police investigations. It scores poorly in judicial vacancies and recovery of stolen property.
Its quality of government spending is high: it has the lowest ratio of administrative GDP to total GDP. Spending is focused on infrastructure rather than staff. Modi’s repeated state election victories show that his approach produces high voter satisfaction.
Gujarat is not a classical free-market state. It has large, expanding public sector companies, and substantial taxes on capital and commodities. It has many subsidies, though fewer than in other states. Still, business thrives in its business-friendly climate.
One businessman told me that in Tamil Nadu, it took six months and several visits (and payments) to ministries for industrial approval. But in Gujarat, the ministry concerned called him the day before his appointment, asking for details of his proposal. Next day, he found the bureaucracy had in advance prepared plans of possible locations for his project, and settled the matter on the spot. This was unthinkable elsewhere, and showed both efficiency and honesty. Corruption has not disappeared in Gujarat, but is muted.
Modi’s Jyotigram scheme provides 24/7 electricity for rural households, plus reliable power at fixed times for tubewells. This explains why Gujarat has India’s fastest agricultural growth (10%/year for a decade, say economists Gulati and Shah). Indian agriculture is crippled by regulations, but Gulati shows that Gujarat has the highest agricultural freedom among states. Modi charges farmers for power, and so all his three state power companies are profitable. By contrast, power companies in other states with free rural power have accumulated losses of almost Rs 200,000 crore.
Critics accuse him of giving cheap land to favoured industrialists. But state and national governments the world over use such sops to attract industries. Unlike most politicians, Modi has clearly not enriched himself.
Good governance includes communal peace. So, the 2002 Muslim killings reflect terribly on Modi. For some, it puts him beyond the pale. But since 2002 the state has been peaceful. In 2011-12, Gujarat had the lowest Muslim rural poverty rate among all states. Its overall poverty rate for Muslims (11.4%) was far lower than for Hindus (17.6%). This was also true of six other states, so Gujarat is not unique in this.
In sum, EFSI and other studies show that Gujarat has good governance. It has social and communal flaws. But it is India’s top state in economic and agricultural freedom..
Economic growth, Comparative
2011-13
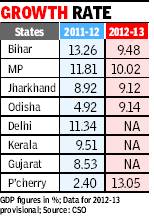
New Delhi: BJP-led Madhya Pradesh has dislodged champion Bihar from its numero uno position in terms of highest growth of gross state domestic product. Provisional data released by Central Statistical Organisation for 2012-13 for states shows Bihar’s growth has slowed, slipping from an impressive 13.26% last year to digit 9.48% this year as against 10% clocked by MP.
Other backward states have maintained their upward trajectory, with Jharkhand and Odisha growing at 9.12% and 9.14%, respectively, this year.
However, a comprehensive comparison will have to wait till growth data from Kerala, Maharashtra, Gujarat, Rajasthan and Delhi, all of which have maintained robust growth in the past years, comes in. Provisional GDP figures for these states for 2012-13 are still awaited.
Bihar added Rs 13,679 crore to its GDP, taking its economy from Rs 144,278 crore in 2011-12 to Rs 157,957 crore in the current fiscal.
MP added 20k cr to its economy in a year
Data released by Central Statistical Organisation for 2012-13 shows a deceleration in Bihar’s phenomenal economic. The state's growth slipped from an impressive 13.26% last year to a single digit 9.48% this year as against 10% clocked by MP.
MP adding more than Rs 20,000 crore to its economy during the last one year, and expanding its GDP from Rs 2,01,290 crore last year to Rs 2,21,463 crore this year.
Growth in per capita income has been more disappointing for Bihar. It has added merely Rs 1,090 in 2012-13 to its per capita income, lowest among other states. In comparison, Jharkhand and MP have seen its per capita income rise by over Rs 2,000. Odisha has also managed to add Rs 1,450 in its per capita income in the last one year – up from Rs 24,134 last year to Rs 25,584 this year.
In contrast, Bihar’s per capita stands at Rs 14,268 in the current year, just marginally up from last year’s Rs 13,178. In past five years, Bihar has been on a high growth path, consistently recording double-digit rate: 12% in 2008-09; 11% (2010-11) and 13% (2011-12). The only exception was 2009-10 when state’s GDP grew by a modest 7.09%.
MP has been another consistent performer. It grew by 12.47% in 2008-09 .The following year it defied downturn to post a respectable 9.88%. Though it came down to 7.13% the next year, it bounced back to double digit by managing a rate of 11.81% in 2011-12
2013-’17: CRISIL’s report
See graphic:
The best and worst states of India, ranked on
i) quality of growth,
ii) inflation, and
iii) fiscal position.

i) quality of growth,
ii) inflation, and
iii) fiscal position.
From: December 8, 2017: The Times of India
2015: Business reforms: Gujarat no. 1
The Times of India, Sep 15 2015

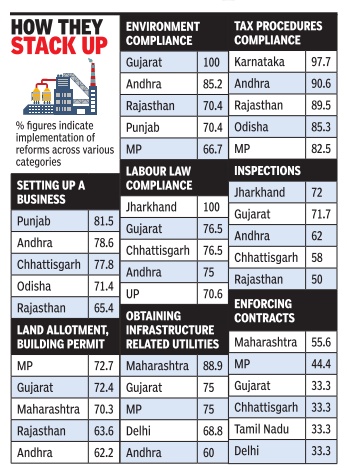
Gujarat tops in biz reforms: Report
Gujarat has topped the list of states in rapidly implementing business reforms, a study conducted by the World Bank and the government's Department of Industrial Policy and Promotion (DIPP) has shown. Key states such as Maharashtra, Karnataka and Tamil Nadu have been slow in making progress and even lag less-developed states such as Jharkhand and Chhattisgarh.
The first-ever such study which covers the country in an in-depth manner, ` Assessment of State Implementation of Business Reforms', took stock of reforms implemented by the states from the beginning of January this year to the end of June. It worked out its findings on the progress made on a 98-point action plan that had been agreed upon between various states, union territories and the DIPP towards the end of last year.
The report highlights how states are implementing reforms. “On an average, only 32% of the proposed reforms have been implemented across the country . The implementation of reforms regarding inspection and enforcement of contracts, which necessitate medium term actions, stands at less than 20%,“ the report said.
Other partners in the study, which saw states faring poorly in areas such as setting up electronic courts, included KPMG and industry cham bers CII and FICCI.
The study comes at a time when PM Narendra Modi is attempting to attract investment and create jobs through initiatives such as Make in India. The PM has often referred to the need to make significant progress on ease of doing business.
India ranks 142 among 189 nations in the World Bank's Doing Business report and investors complain about the slow pace of decision making and red tape on approvals.“Thus the need of the day is reform, and the reforms must be led by the government both at central and state levels,“ said Onno Ruhl, World Bank country director in India. Seven out of the top 10 sta tes in terms of imple menting business re orms have the BJP in office supporting the TDP as an al y in Andhra Pradesh). The non-BJP states that cracked he top 10 category included Odisha (ruled by the BJD, ranked 7), Karnataka (Congress, ranked 9) and Uttar Pradesh Samajwadi Party , ranked 10).
The study assessed the sta es on various key parame ers such as ease of setting up business; allotment of land and obtaining construction permit; complying with environment procedures; comply ng with labour regulations; obtaining infra-related utilities; registering and complying with tax procedures; carry ng out inspections and enforcing contracts.
The assessment shows hat none of the states could achieve distinction or cross he 75% mark (dubbed as `leaders category' in the survey) n the overall assessment on business reforms. The top seven states emerged in the aspiring leaders' category and these were Gujarat (71%), AP (70%), Jharkhand (63%), Chhattisgarh (62%), MP 62%), Rajasthan (61%) and Odisha (52%).
“What this report does ve ry well is to provide a roadmap for states serious about improving their business environment and creating jobs,“ Ruhl said. “But it's also important that the civil servants facilitate business, and make it easy for businesses. This requires a change in mindset.“
The report found that except for the top seven states, all the other regions need to speed up reforms. Nine states, including Delhi, Haryana, Karnataka, Maharashtra, Ta mil Nadu, Punjab and West Bengal, were placed in the ca egory where acceleration is required in reforms implementation. A total of 16 states were placed in the bottom ca egory which need to “jump start“ reforms implementa ion and these included Arunachal Pradesh, Assam, Bihar, Kerala, Uttarakhand, Nagaland and Andaman and Nicobar.
“Improving India's regu atory framework for business is a key pre-requisite for ncreasing investment in India and thereby creating obs,“ the report said.
Listing the areas where progress has been made, the report said the states have generally made good progress n terms of tax reforms, which includes mandating eregistration for VAT and cen ral sales tax (CST).
“... online filing and payment of VAT and CST seem to be popular reforms implemented in a vast majority of states. These are joined by clear timelines for building plan approval and construction permits, VAT registration and electricity connection.Finally , a majority of states have established dedicated single windows, backed by legislation or state notifica ions to establish and empower them,“ the report said.
2015> 2017: States with the best and worst growth and deficit

From: February 27, 2018: The Times of India
See graphic:
States with high/low growth and high/low deficit, 2015-16, 2016-17
2018: The best districts
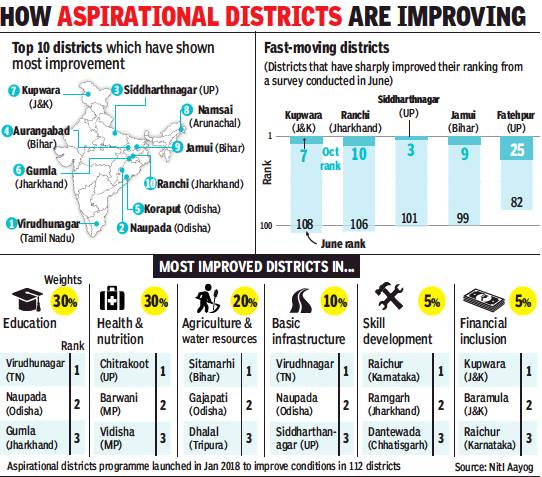
From: Surojit Gupta, Why you need to keep an eye out for Virudhunagar, Naupada dists, December 28, 2018: The Times of India
TN, Odisha Districts Top Niti Survey
Virudhunagar in Tamil Nadu has topped the chart of aspirational districts which have shown the most improvement in the six parameters on which the survey is based.
The government think tank Niti Aayog launched the Aspirational Districts programme in January 2018 with the aim of fast tracking the socio-economic status of 112 districts. West Bengal has opted out of the exercise and three districts which had been selected have been dropped.
In the current survey, 111 districts have been ranked as Wayanad in Kerala could not be assessed due to the floods.
NITI Aayog CEO Amitabh Kant said most of the districts had shown tremendous improvement compared to the June survey and some districts needed to catch up and improve their rankings. Referring to the top two positions bagged by Kupwara and Baramulla in J&K on the financial inclusion criteria, Kant said these two districts had made tremendous strides in digital transactions as well as other financial inclusion instruments.
Niti Aayog and its partners Tata Trusts and BMGF also carried out household surveys in all the aspirational districts on health and education. Under health, the districts are assessed on the percentage of stunted children under six years and percentage of breast-feeding children receiving adequate diet. In education, the survey maps learning outcomes which includes average performance of Class 3,5 and 8 students in mathematics and language. Female literacy is also assessed under the education parameter.
The survey showed that 71 districts reported improvement in mathematics and language in class, 67 in Class 5 and 61 in Class 8. Average marks scored by students in Class 3 has shown significant improvement. At least 50 districts reported improvement in Class 3 marks, nine in Class 5 and five districts in Class 8.
Virudhunagar, Vizianagaram, Asifabad, Kanker and Siddharthanagar reported the sharpest improvement in average mathematics across class 3, 5 and 8, while Virudhunagar, Mamit, Rajnandgaon, Kondgaon and Asifabad displayed the maximum improvement in average language scores in class 3, 5 and 8.
Pakur (Jharkhand), Hailakandi (Assam) and Chatra (Jharkhand) are least-improved districts, according to the second delta ranking released by the Aayog.
The population of states, according to income groups
2020- 21
Dec 1, 2022: The Times of India

From: Dec 1, 2022: The Times of India
The gulf between India’s rich and poor states is yet to be bridged despite the rise of the middle and affluent classes across the country.
The eastern and the central regions, which have almost half the country’s population, together account for only 29% of the national income. In contrast, the South generates 30% of the disposable income with a fifth of the country’s population, an all-India survey by economic think tank People Research on India’s Consumer Economy (PRICE) has revealed.
The East, comprising Bihar, Jharkhand and Odisha, has 14% share in income – the lowest among the six zonal councils. The central zone that consists of Uttar Pradesh, Uttarakhand, Madhya Pradesh and Chhattisgarh, has the lowest per capita income of a shade under Rs 68,000 – which is around 36% of the richest zone and around 58% of the national average. At Rs 72,702, the eastern states fare only marginally better in per capita income.
While the number of ‘destitute’ households – defined as any household with annual income under Rs 1. 25 lakh – has fallen across the high-, middleand low-income states, the decrease is the sharpest in the first category and slowest among the last. The other income groups (see graphic) are aspirer (Rs 1. 25 lakh-Rs 5 lakh); middle class (Rs 5 lakh-Rs 30 lakh); rich (>Rs 30 lakh).
Although better off than earlier, the BIMARU grouping – which includes Jharkhand and Chhattisgarh in addition to Bihar, Madhya Pradesh, Rajasthan and Uttar Pradesh – is still home to the highest ‘destitute’ population. In Bihar, for instance, 30% of the households fall in this category, compared with 8% in Maharashtraand 11% in Tamil Nadu.
In Chhattisgarh and Jharkhand, almost every fourth household is destitute, with Uttar Pradesh faring much better than West Bengal, which is not counted among BIMARU states. But India’s most populous state is second only to Biharwhen it comes to the number of destitute households.
PRICE MD & CEO Rajesh Shukla identified agrarian society, low literacy, lack of investment in basic infrastructure and “lack of perspective planning” for the economic backwardness of eastern and central regions.
Investments, attracting the most
2009-14
The Times of India Jan 02 2016
Tarini Puri
Maharashtra has toppled Gujarat as the most-sought after destination for global and domestic investors.The home state of Prime Minister Narendra Modi registered the least growth of just over 2% in investment among the top 21 states across India in the past five years, revealed a report of the Associated Chambers of Commerce and Industry of India (Assocham) published recently .
According to the report, Maharashtra, Gujarat and Odisha have emerged as the most lucrative investment destinations. They together account for over one-fourth (26.6%) of the total outstanding investments worth over Rs 154 lakh crore attracted by various sectors from both public and private sources across 21 states as of December 2014, which grew from Rs 105 lakh crore as of December 2009.
“With a share of about 10%, Maharashtra has ranked first attracting investments worth over Rs 15 lakh crore as of December 2014, closely followed by Gujarat (9.2% share). Odisha (7.5%), Karnataka (6.8%) and Tamil Nadu (6.5%) are the other states with a significant share in this regard,“ states the report titled ` A Comparative Analysis of Investment Pattern in States', compiled by the Assocham Economic Research Bureau (AERB).
Maharashtra tops in the real estate investment (21.2% of total) too. A senior industry source said on the condition of anonymity, “The value of Maharashtra's real estate definitely ups its value in terms of total outstanding investment. But going by the number of automobile manufacturing companies, considered as hard-core manufacturing, which have chosen to set up business in Gujarat in the last few years, proves that it still has what it takes for in viting industrial investment.To be truly regarded as industry-friendly , Maharashtra still needs to work on aspects like ensuring round-the-clock power supply and providing a stable political environment.“ Anant Sardeshmukh, director general of Mahratta Chamber of Commerce, Industry and Agriculture, said, “With current government working on easing issues rela ted to land availability and acquisition, the industrial scene has definitely picked up.“
Secretary general of Assocham D S Rawat said, “Investment is the key driver of productivity and sustainability that leads to development and growth making most state go vernments to strive to better the investment climate prevailing in their respective states to make them conducive to attract domestic and foreign in vestors.“
Investment potential index: 2018
August 4, 2018: The Times of India
From: August 4, 2018: The Times of India
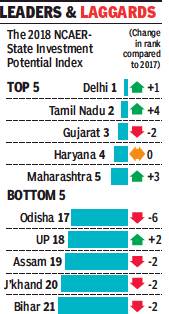
Delhi has topped the state investment potential index list, followed by Tamil Nadu.
The index prepared by economic think tank National Council of Applied Economic Research (NCAER), showed that Delhi topped the rankings on infrastructure and economic conditions of the state. NCAER launched the index in March 2016 to provide metrics of economic governance, competitiveness and growth opportunities at the state and regional levels. The index is designed to provide a systematic and reliable “go-to” reference for policymakers, existing businesses, and potential domestic and overseas investors.
Tamil Nadu was in second place and topped the rankings in labour and governance. Compared to 2017 rankings, West Bengal, Tamil Nadu and Punjab have made the most rapid gains in 2018, moving up by 11, 4 and 4 spots respectively to 10th, 2nd, and 12th positions.
The index ranks competitiveness of states on six pillars: land, labour, infrastructure, economic climate, political stability & governance, and business perceptions.
These six pillars are classified under four broad categories: Factor-driven (land & labour), efficiency-driven (infrastructure), growthdriven (economic climate and political stability & governance), and perceptions-driven (ranking of business climate built on firm surveys).
Although Assam, Jharkhand and Bihar are ranked among the least favourable states for investment, they are ranked higher under individual pillars.
Mobility of people
Sprightly Kerala
Mahesh Vyas
The Financial Express Mar 06 2014
Summary: Kerala state outranks others when it comes to mobility of people
Air travel mobility
Delhi is the most mobile state in the country. Its Indira Gandhi International airport is the busiest in the country with a traffic of 34 million passengers in 2012-13. Mumbai comes next with a traffic of 30 million passengers. The rest don't even have half this traffic. Delhi also has the highest teledensity—91%, according to the Census 2011 data.
An appropriate measure of the air travel mobility of a region would be the number of air passengers per million population. However, the available statistics need to be used with some caveats as the mobility could be of outsiders into the region as tourists rather than the local population being mobile. For example, Andaman & Nicobar has a mobility of 1.3 million per million population and Goa has an even better 1.9 million air passengers per million population. The natives of the island would probably not be amused and the Goans may raise a toast to the business prospects of this traffic. But, both are not as mobile as the data suggests. At least not as mobile as is evident at international airports.
Typically, at a Western international airport, one sees people from West Bengal, Gujarat, Punjab, Tamil Nadu and Andhra Pradesh. Bengalis and Gujaratis are probably the most tourism-oriented people among us.
People from the South are more likely to be found as professionals working overseas, or their families visiting them. But, if you find an Indian gawking at the Colosseum in Rome, tiptoeing along aisles of the Louvre or screaming down those crazy rides in Disney World, she is likely to be a Bengali or a Gujarati.
Our air travel infrastructure seems to be favouring our business interests rather than our outbound tourists. It is possible that the Bengalis and Gujaratis travel from Delhi and Mumbai than from their respective states. Air passengers from West Bengal were 118,000 per million population and those from Gujarat were 85,000 per million population. In comparison, Maharashtra had a traffic of 304,000 per million population and Kerala was 285,000 per million. Even Jammu & Kashmir, Tamil Nadu and Karnataka had higher air passenger traffic compared to those from West Bengal and Gujarat.
If one were to somehow rank all states using a summary measure of the mobility of people, the southern states of Tamil Nadu and Kerala would be close contenders for the top slots. Delhi would be high up, too. But then, Delhi is a small state.
Kerala's rail and road density is among the top-three state-wise figures in the country. Its air passenger traffic, at 285,000 per million population, is more than twice the all-India average of 130,000. It ranks sixth out of 23 states and union territories for which such data is available in this respect, but, the five that rank higher than Kerala include Andaman & Nicobar Islands, the city-states of Goa, Delhi and Chandigarh. The only large state that beats Kerala is therefore Maharashtra, that too because of Mumbai.
Kerala has a teledensity of 96%. This is much higher than the all-India figure of 73%. The state ranks fifth in teledensity. Kerala's high ranks in rail and road density, in air traffic and in teledensity makes it the contender for the most mobile state in the country. This statistical nugget sits well with the image of the hardworking, global Malayali who decides to hang her boots in God's Own Country, but possibly keeps working her phone. Its not an idle connection with the average Malayali in Kerala. The state ranks third among all states in terms of average revenue per user.
Tamil Nadu ranks second in terms of teledensity after Delhi. So, among the large states, Tamil Nadu is the top ranker in terms of teledensity. The good quality of its roads offsets partly its not-so-impressive surface transport density. And, its air traffic is also quite impressive at 227,000 per million population compared to the all-India average of 130,000 per million population.
Both these southern states fare much better on mobility statistics compared to the more famous Gujarat or the more touristy Gujarat and West Bengal. Gujarat's passenger air traffic, at 85,000 per million population, is lower than the all-India average, and it is ranked 14th in the list of 23 big states. West Bengal ranks 12th. Gujarat ranks 8th in a list of 18 states in teledensity, while West Bengal ranks 12th, again.
Inter-state comparisons are often dicey. And, comparing mobility across states is a complicated affair. Different modes of transport compete, terrains differ and mere mobility may also be a reflection of poor spatial planning. Independent of how the states stack up on these rankings, there is no doubt that there has been an all-round improvement in transport facilities and therefore of the mobility of Indians. But, this is far from enough to improve the quality of life.
Perhaps, there is one facility for mobility that greatly reflects the quality of public infrastructure and even the quality of life in a city better than anything else. This is the length of sidewalks in a city. We have a new facility in the urban maze of some cities—the skywalk! I find these to be ugly, clunky structures that only further mar the breathing spaces, adding to the space for screaming hoardings in a city. But, that is a different issue. What is pertinent is that it is difficult to find sidewalks in most cities. It is challenging to cross a street unless you are willing to be a nonchalant jaywalker, ears plugged firmly into your mobile phone, scowling menacingly at any vehicle that dares to cross your path and disturb your musical escapade. Mobility has moved far ahead of civility. Good sidewalks and other facilities for easier pedestrian mobility on streets could help correct that to some extent.
All data sourced from statesofindia.cmie.com
The author is CEO and managing director, Centre for Monitoring Indian Economy P Ltd
Social progress
Social progress index: 2016

i) their social progress in 2005, 2016;
ii) fulfilment of basic human needs,
iii) well-being; and
iv) opportunity.
From November 29, 2017: The Times of India
See graphic:
Indian states ranked according to i)their social progress in 2005, 2016; ii) fulfilment of basic human needs, iii) well-being; and iv) opportunity.
2022
Shiladitya Pandit, January 12, 2023: The Times of India
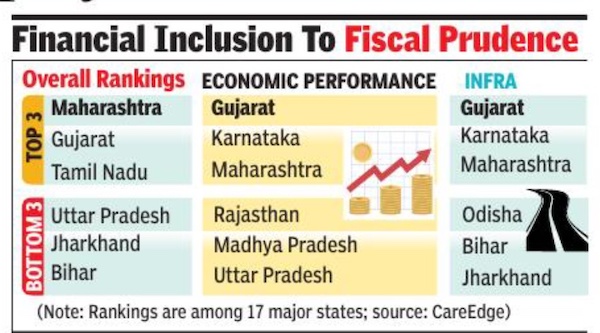
From: Shiladitya Pandit, January 12, 2023: The Times of India
Pune : Maharashtra ranked first among 17 major states, followed by Gujarat and Tamil Nadu, across seven categories in a report released by credit rating agency CareEdge on Wednesday. Uttar Pradesh, Jharkhand, and Bihar ranked the lowest on a composite basis, revealed the report. Maharashtra scored well in the rankings on social factors, such as income equality, poverty alleviation and infant mortality, as well as financial inclusion among citizens and government fiscal prudence, said Rajani Sinha, CareEdge’s chief economist.
Among the 17 major states in the report, Uttar Pradesh ranked first on governance,largely due to its service-delivery and ease-of-doing-business initiatives. Odisha ranked first in the fiscal category. Gujarat was the leading state in terms of economic performance among the major states. The economic performance parameters took into account factors such as GSDP, foreign direct invest-ment (FDI) and share of industry and services in the state’s gross value added. Maharashtra finished third in the category, after Karnataka.
Three southern states — Andhra Pradesh, Telangana and Karnataka — led the way in terms of environmental performance, which includes factors such as air quality, po-table water supply, forest cover and renewable energy.
Goa led overall among the 11 small states surveyed in the report. It scored highly in multiple parameters, such as fiscal prudence, financial inclusion and social factors.
A key nationwide lacuna was, however, identified in the infra category that took into account power availability, roads, railways and airport density, social infrastructure such as publicly funded schools and hospitals, as well as irrigated agricultural areas. Maharashtra, despite leading the country overall, was ninth in the country, according to CareEdge, behind West Bengal. Punjab led the category, largely due to its power availability and density of railways and irrigation.
See also
Central grants to states: India •
Composite Development Index (for backwardness of states)
India: The states and Union Territories
Indian states: developmental indicators
Indian states: social parameters
Indian states: Political indicators
Indian states: education- related indicators
