Inflation: India

ii) The worst cases of hyperinflation in world history.
The Times of India
This is a collection of articles archived for the excellence of their content. |
Measuring inflation: Wholesale Price Index (WPI) and Consumer Price Index (CPI)
The Times of India, Jun 08 2015
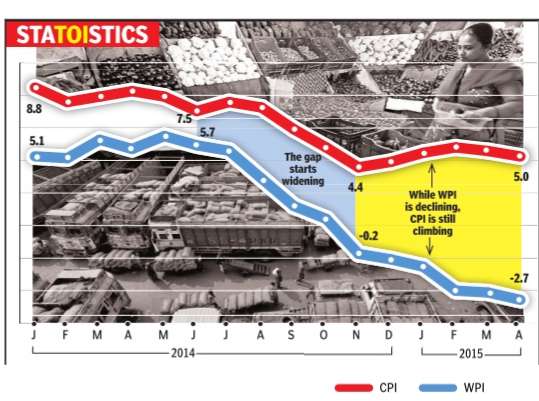
The Wholesale Price Index (WPI) and Consumer Price Index (CPI) are two ways of measuring inflation. Because of different constituents and weights for them, the inflation rates measured by both indices are often different. What is noticeable in recent months is that the two indices are showing divergent trends. The CPI indicates that there has been a rise in prices, while the WPI suggests that prices have fallen.One reason for this could be that food prices, which constitute a much larger part of the CPI, are up significantly over the last year.SOURCE: MOSPI, Office of the Economic Adviser; Research: Atul Thakur; Graphic: Asheeran Punjabi
Why all-India inflation is misleading
The Times of India, Feb 16 2017
See graphic:
Change in consumer prices, 2012-17, rural-urban and state-wise

Every month the government releases national inflation data that is widely publicised and analysed. What goes unnoticed is the data on state-wise inflation, which is far closer to price rise (or fall) families have to live with. As the charts below show, some states have double the rate of inflation than others. Over the past five years, rural consumers had to live with a higher rate of inflation than urban Indians
2001 vis-à-vis 2016

From: November 4, 2020: The Times of India
See graphic:
' Consumer Price Index (CPI) for industrial workers, weightages in 2001 vis-à-vis 2016
2014-19: contradictions between the two

From: Oct 17, 2019: The Times of India
See graphic:
Inflation as measured by the WPI and CPI, 2014-19, and contradictions between the two
Food inflation
1990-2019
Surojit Gupta, Food inflation falls to lowest level since 1991, April 14, 2019: The Times of India
From: Surojit Gupta, Food inflation falls to lowest level since 1991, April 14, 2019: The Times of India
Excess Supply, Low Demand Key Factors: Experts
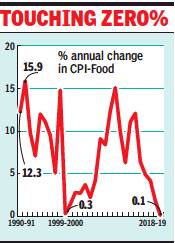
Average food prices in 2018-19 were almost the same as they were in 2017-18 — a phenomenon not seen for at least 27 years. An analysis by credit rating agency Crisil shows food inflation measured by the consumer price index rose only 0.1% in 2018-19. The last time annual food inflation had fallen below 1% was in 1999-2000.
Economists attribute low food prices to a string of factors, including bumper crop, low demand, low global prices, and muted impact of increased minimum support prices (MSP). Low and stable food prices are good for everybody except farmers, unless it is accompanied by increase in productivity.
“I would attribute it to two factors — above the trend growth in farm produce in the last 3-4 years, and favourable global food prices,” says D K Joshi, chief economist with Crisil.
‘Food inflation may move up, depending on status of monsoon’
According to Joshi, impact of increase in minimum support prices has been muted so far, mainly due to low market prices for most crops. “But going forward food inflation will move up and a lot will depend on the status of monsoon,” he said.
“The consistent downward surprise in food inflation has been a recurring feature in the last couple of years. It’s a combination of factors like better supply management, more production, low increase in procurement prices and shift in demand,” said Soumya Kanti Ghosh, group chief economic advisor at State Bank of India. “Demand shift could also be attributed to people spending less on food and more on services,” he said.
What does this mean for farmers who have been agitating all over the country for better return on their produce? Madan Sabnavis, chief economist at Care Ratings says the price levels are unsustainable and will rise in the months ahead. “It is a reflection of the fact that farmer has got lower income for their produce. There has been excess supplies in some segments like pulses, sugar and vegetables which have kept prices down,” he said.
Pronab Sen, former chief statistician of the country, doesn’t think that the low levels of food inflation could be linked to better inflation management and supplies. “It has nothing to do with surplus food supplies or better management. As I see it is likely that post-demonetisation the poor have no money and that is impacting demand which is showing up in the data. The way prices have collapsed cannot be from the supply side only,” said Sen.
To make the old and new data compatible, the Crisil study compared the food component of the consumer price index introduced since 2011-12 with the same component of consumer price index for industrial workers for the years before 2011-12.
To make the old and new data compatible, the Crisil study compared the food component of the consumer price index introduced since 2011-12 with the same component of consumer price index for industrial workers for years before 2011-12.
1991 – 2016: during El Nino years

From: August 4, 2023: The Times of India
See graphic:
Food inflation, 1991 – 2016: during El Nino years
2016 July- 2019 Dec: some periods of high inflation
January 14, 2020: The Times of India
NEW DELHI: Retail inflation rose to a 65-month high in December on the back of soaring vegetable prices as food inflation hit an over six-year high, prompting economists to predict that the Reserve Bank of India (RBI) will continue with its pause on interest rates.
Date released by the National Statistical Office (NSO) on Monday showed retail inflation as measured by the consumer price index rose to an over five year-high of 7.4% in December, higher than the previous month’s 5.5% and way above the 2.1% recorded in December 2018.
This is the highest since 7.4% recorded in July 2014. For the first time since July 2016, the inflation figure shot past the 6% upper band of the central bank’s comfort zone.
The latest numbers comes as a double whammy for the BJP government, which is battling slowing growth that is estimated at an 11-year low of 5%.
The overall inflation rate is the highest since the BJP government took office in May 2014. The Modi administration was so far successful in containing inflation at low levels for a significant period, providing headroom to the central bank to cut rates to accelerate growth.
The key reason for the sharp spike has been prices of vegetables and pulses. Vegetable prices rose an annual 60.5%, largely driven by onions, and prices of pulses by 15.4%. The government expects overall inflation to moderate in the coming months as supplies improve.
The food price index rose 14.1% during December, the highest in the new series, which was introduced in January 2014. It was the highest in nearly six years since November 2013 when it had soared to 15.4% in the old series which had 2010 as the base year, according to official data.
Core inflation, which is minus food and fuel, too rose marginally to 3.7% in December, compared with 3.5% in the previous month. Inflation in rural areas was at a 5-year high of 7.3% during December while in urban centres it was at a 6-year high of 7.5%. The data showed that 12 out of the 22 states and union territories had higher inflation than the overall inflation of 7.4%.
The inflation numbers come ahead of the February 1 budget which is expected to unveil fresh measures to boost growth.
Economists attributed the sharp spike to higher vegetable prices, which are at a six-year high, while pulses shot up to a three-year high.
“While food inflation has ascended to double digits, it is not broad-based. It is specifically in vegetables, followed by pulses, which are behind the surge. If you exclude them, food inflation is still 5%, which is a 33-month high,” said DK Joshi, chief economist at ratings agency Crisil.
Economists also said a sharp spike in the transport and communication segment added to the inflationary pressure. They said they expect inflation to remain at elevated levels although moderation in onion and potato prices may help ease overall inflation.
“Considering the higher than targeted level of inflation and the fiscal challenges with regard to the government surpassing its fiscal deficit target, the RBI is likely to maintain its status quo on the policy rates in the forthcoming policy meeting. Going ahead, RBI’s monetary policy would remain contingent on the inflation trajectory and the government’s fiscal stance,” said Madan Sabnavis, chief economist at CARE Ratings.
Food, and some consumer durables, 2014-22
April 20, 2022: The Times of India

From: April 20, 2022: The Times of India
How To Read CPI: The Consumer Price Index (CPI) measures changes in prices of items over time. The change in prices is calculated with reference to a base year, for which the value of the index is set at 100. The base year for the current CPI is 2012. Say, an item was selling for 10 per kilo in 2012, then 10 is assumed to be 100. If the price in 2022 is 20 per kilo, which is a 100% increase over the 2012 value, the index value of the item will be 100 (the base) +100 (the percentage increase in price over the base), that is 200. If the 2022 price is 15 per kilo, or a 50% increase over 2012 prices, the value of the index will become 100+50 = 150 for 2022. Thus, changes in the index value of a commodity mirror changes in its price. So, the fact that the present index value (March 2022) is 162. 3 for milk and 142. 5 for petrol tells us that between 2012 and March 2022, the price of milk rose 62. 3% (100 is the base price in 2012, remember) and that of petrol by 42. 5%, that is by less. Note: Index data used here is as available from January 2014 onwards.
2007- 2019

From: February 28, 2023: The Times of India
See graphic:
Food inflation during El Nino years, 2007- 2019
2012> 19

From: February 11, 2020: The Times of India
See graphic:
Food (and other) inflation in India, 2012> 19
2019
From: Dec 11, 2019: The Times of India
See graphic:
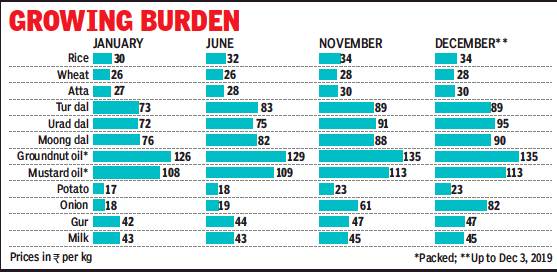
Food Inflation in India in 2019.
Food inflation analysed
Tomato, potato impact: 2015-23
Surojit Gupta, Oct 14, 2024: The Times of India
From: Surojit Gupta, Oct 14, 2024: The Times of India
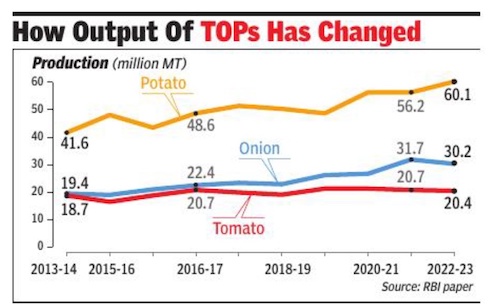
High food inflation has been a challenge for policymakers. Food has a high share of 45.9% in the consumer price index and supply shocks influence the overall retail inflation numbers. The focus in recent months has been on the surge in tomato, onion and potato (TOP) prices. TOP accounts for 4.8% in the retail food and beverages group and 2.2% in the overall CPI but fluctuation in their prices influences overall retail inflation. A recent RBI working paper has tried to examine the price dynamics in these commodities and offers some solutions to tame the high volatility.
Why are tomato, onion and potato prices high?
Short seasonal crop cycles, storage problems due to their perishable nature, regional concentration of production and supply chain issues and extreme weather have a bearing on the price situation. Rising demand and growing preference for these vegetables in specific areas have added to the price surge. Extreme weather conditions such as heat waves and floods add to the supply chain issues.
A patchy supply chain for these vegetables is also a crucial factor in how prices fluctuate. For example, studies have shown that during lean season, consumers are confronted with high prices and short supply and during a bumper season, farmers are forced to dump their produ- ce, resort to distress sales as prices fall below the production costs. Fluctuating demand-supply scenarios also have a bearing on prices.
How has production of these crops risen?
Production has grown rapidly and in 2022-23, tomato, onion and potato production was estimated at 20.4 million metric tonnes (MMT), 30.2 MMT and 60.1 MMT, according to the paper. India now is the second largest producer of tomato and potato in the world. It has also overtaken China as the largest producer of onion in the world and in 2022 contributed 28.6% of global production, the paper said, citing FAO data.
Possible policy interventions to tame price volatility in TOPs…
The RBI paper has suggested several measures such as agriculture marketing reforms, storage solutions, processing and raising productivity of tomato, onion and potato.
Under marketing reforms, the paper has suggested increasing private mandis to increase transparency for these perishable commodities and these entities will provide a wider choice to farmers to sell their crops. Competition is also expected to improve the state of Agricultural Produce Market Committee (APMC). It has suggested re-launching potato futures, which were traded in the country’s commodity exchange but were banned in 2014. Authorities should also consider launching future trading in onions for better price discovery and managing risks. Storage should be expanded across the country as cold storages for potato are largely in UP while those for onions are mostly in Maharashtra.
Impact of Inflation on wealth
1984-2016

See graphic:
How inflation eroded wealth in India, 1984- 2016
Retail inflation
2014-19

From: January 14, 2020: The Times of India
See graphic:
Retail inflation, 2014-19
2016, Sep- 2018, Feb

ii) Manufacturing activity, January 2017-January 2018;
iii) Retail inflation, September 2016-February 2018;
iv) annual % change in prices of pulses, spices and sugar, as in February 2018
From: March 13, 2018: The Times of India
See graphic:
i) Industrial output, October 2016-June 2018;
ii) Manufacturing activity, January 2017-January 2018;
iii) Retail inflation, September 2016-February 2018;
iv) annual % change in prices of pulses, spices and sugar, as in February 2018
2018-2019 Mar
WPI inflation hits 3-month high in March on costlier food, fuel, April 16, 2019: The Times of India

From: WPI inflation hits 3-month high in March on costlier food, fuel, April 16, 2019: The Times of India
Annual wholesale price inflation (WPI) jumped in March to its highest level in three months on the back of a spurt in prices of food and fuel, posing a fresh challenge for policymakers to remain watchful on the price front.
Official data released on Monday showed inflation, as measured by the wholesale price index, rose an annual 3.2% in March, higher than previous month’s 2.9% and above 2.7% posted in the same month a year earlier .
“Like previous month, once again higher food inflation — in combination with fuel and power — provided impetus to the wholesale inflation. As a result, it inched up to 3.2% in March 2019 as compared to 2.9% previous month,” said Sunil Kumar Sinha, principal economist, India Ratings and Research.
“The bigger push, however, came from food articles where several items namely wheat, jowar, bajra, maize, barley have been witnessing double-digit or near double-digit inflation since November 2018. Pulses also recorded second consecutive month of double-digit inflation in March 2019. Within pulses, Arhar and moong have now witnessed four months of consecutive double-digit inflation,” said Sinha.
He said a fresh interest rate cut by the RBI would largely depend on how the monsoon pans out in the months ahead. The WPI data showed food prices rose an annual 5.7% in March, picking up pace from previous month’s 4.3% increase.
Prices of vegetables rose 28% compared to previous month’s 6.8%. Onion prices contracted 31.3% in March.
Fuel and power prices increased 5.4% in March, accelerating from previous month’s 2.2% rise. “We see headline CPI inflation averaging approximately 3.8% for FY20 (3.4% in FY19), but do reckon several uncertainties that cloud the outlook, namely monsoons, crude prices, global volatility, stillhigh core inflation and effective fiscal stance,” said Madhavi Arora, economist at Edelweiss Securities. “We are in consonance with the RBI on nearterm inflation dynamics and see another 25bps cut in first half of FY20, most possibly in June itself, especially amid current global goldilock situation. The bar for further cuts will be a much higher and will be data-dependent. We see upside risks to RBI’s inflation trajectory in latter part of FY20 and will closely watch out for the evolution of inflation amid various domestic and global idiosyncrasies and fiscal fragilities,” Arora added.
Wholesale Price Index (WPI)
1975-2015
The Times of India, Aug 15 2015
Wholesale inflation lowest since '76
Falls for 9th month in a row to -4.1%, longest negative stretch since '75
Wholesale prices plunged for the ninth consecutive month in July on the back of a decline in food and fuel prices, raising prospects of a cut in interest rates to give a push to growth. This was the lowest level of the inflation based on wholesale price index (WPI) since 1976 and, according to economists, is the longest stretch of negative wholesale prices in the country since 1975.WPI inflation was in negative zone for 12 months between July 1975 and June 1976.
Data released by the commerce ministry showed the wholesale inflation fell 4.05% in July compared to a decline of 2.40% for the previous month and 5.41% during the corresponding month of the previous year.
The sharp dip in WPI comes close on the heels of the significant moderation in retail inflation in July and together the two data sets have fuelled expectations of a cut in interest rates.
Food inflation fell 1.16% year-on-year in July , while vegetable prices fell 24.52% during the month. The price of pulses continued to remain a worry as it rose 35.75% in July .
India Inc stepped up its call for a reduction in interest rates, citing sharp decline in both WPI and CPI inflation data.“The distinct downturn in both retail and headline inflation and soft inflationary scenario makes a strong case for RBI to resume its accommodative policy stance,“ CII said.
Oct. 2015- Mar. 2016: steady decline
The Times of India, Apr 19 2016

Wholesale prices contract for 17th month in a row Wholesale prices contracted for the 17th consecutive month in March on the back of sliding crude oil and manufactured product prices, adding to expectations of further interest rate cuts in the months ahead.
Data released by the commerce and industry ministry showed the annual rate of inflation, based on the wholesale price index, stood at -0.85% in March compared to -0.91% for the previous month and -2.33% during the corresponding month of the previous year.
Food inflation rose to 3.7% in March 2016 from 3.4% in February 2016 as prices for cereals, milk, eggs, meat & fish and vegetables firmed up. Price of pulses remained a concern, rising 34.4% in March 2016 but the pace of increase was slower than the previous month. Onion prices fell 17.7% in March compared to 13.2% in February .
“Since the prices of primary articles and manufac turing products are increasing, though marginally , it may pose a threat for WPI inflation in the upcoming months. In recent times, fuel prices have been easing, which may help to keep the inflation rates in the negative territory ,“ said Madan Sabnavis, chief economist at Care Ratings.
“The base effect may also wear off as the year progresses and we do expect WPI inflation to enter the positive zone in the next couple of month. However, this would not be a concern,“ Sabnavis added.
The widely watched reta il inflation slowed in March to a six-month low of 4.83% from a year earlier, stoking expectations of a reduction in interest rates.
RBI reduced interest rates by 25 basis points earlier this month and promised to ease rates in the months ahead if inflation remained within the central bank's comfort zone. Economists said they expect inflation to stay benign for now.
“After easing for several consecutive months, prices of pulses have hardened in the first half of April 2016.Moreover, prices of certain vegetables have risen in the last fortnight in line with seasonal trends during the summer months. However, the recent decline in prices of onions following the harvest is likely to offer some relief.While the trajectory of crude oil prices remains crucial, at present we expect WPI inflation to print in a narrow range of +0.5% in Q1 FY2017,“ said Aditi Nayar, senior economist at ratings agency ICRA.
Base year shifted to 2011-12; food index added
WPI gets revised base year, new food index, May 13, 2017: The Times of India

The government revised the wholesale price index (WPI) by shifting to a new base year of 2011-12 from 2004-05 and added a new WPI food index to capture the rate of inflation in food items. Revision of macroeconomic data is undertaken to reflect changes in the economy . The WPI series had undergone six revisions in the past. Apart from a new base year, the revision also includes change in the basket of commodities and assigning of new weights.
Under the revamped data series, the number of items have gone up to 697 from 676.The data now has 199 new items and 146 items have been deleted and has quotations from 8,331 sources compared with 5.482 in the old series. In the new WPI series, prices used for compilation do not include indirect taxes in order to remove the impact of fiscal policy. This is in line with international practices and moves the WPI closer to the producer price index.
Seasonality of fruits and vegetables has been updated to account for more months as these are now available for longer duration. The government has also set up a technical review committee, which will ensure that the product mix keeps pace with changing structure of the economy.
Under primary articles, new vegetables and fruits such as radish, carrot, cucumber, bitter gourd, mosambi, pomegranate, jack fruit, pear have been added. Around 173 new items have been added under the manufactured products category, while 135 items have been dropped. The new WPI food index will be compi led by combining food articles under primary articles and food products under manufactured products. Retail inflation slowed to its lowest level in five years in April, raising expectations of an interest rate cut by the RBI. Inflation as measured by CPI rose 3% in April, slower than previous month's 3.9%.
2017-18
June 15, 2018: The Times of India
From: June 15, 2018: The Times of India
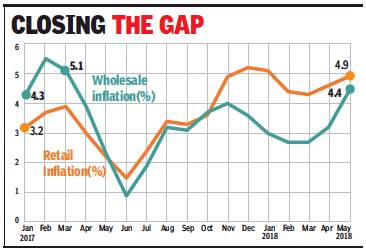
Inflation based on wholesale prices shot up to a 14-month high of 4.4% in May on increasing prices of petrol and diesel, prompting industry to demand action from policymakers to keep fuel prices under check.
The Wholesale Price Index (WPI) based inflation stood at 3.2% in April and 2.3% in May last year. According to government data released on Thursday, inflation in food articles was at 1.6% in May 2018, as against 0.9% in the preceding month.
Inflation in ‘fuel and power’ basket rose sharply to 11.2% in May from 7.9% in April as prices of domestic fuel increased in line with rising global crude oil rates. Inflation in vegetables climbed to 2.5% in May, with potato inflation at a peak of 81.9%. Price rise in fruits was in double digits at 15.4%, while pulses saw a deflation of 21.1%. May inflation at 4.4% was a 14-month peak. The previous high was in March 2017, when WPI inflation stood at 5.1%.
Industry chamber Assocham called for government action to tame fuel price rise, saying increasing prices of petrol and diesel may significantly impact import bills, which may subsequently have an impact on exchange rates. “Besides, it might also negatively impact input prices for the industry which has already started feeling the pressure on its profitability,” Assocham secretary general D S Rawat said.
Icra principal economist Aditi Nayar said core WPI inflation rose sharply to 4.4% in May from 3.6% in the previous month, with a rise in 15 of the sub-indices. This reflects the pass through of higher input costs, and a weaker rupee. “The WPI inflation is expected to harden by up to 0.8% before easing somewhat in the July-September quarter. Key factors that would influence the inflation trajectory include the level at which global crude oil prices stabilise and the extent to which they are transmitted to domestic fuel prices, the trend in the monsoon dispersion and the extent of change in MSPs,” Nayar said. The WPI inflation for March has been revised upwards to 2.7% from the provisional estimate of 2.5%.
In its second monetary policy review for the fiscal, RBI hiked interest rate by 0.25% due to growing concerns about inflation stoked by rising global crude prices and domestic price hikes.
2018, Dec
January 21, 2019: The Times of India
From: January 21, 2019: The Times of India
See graphic:
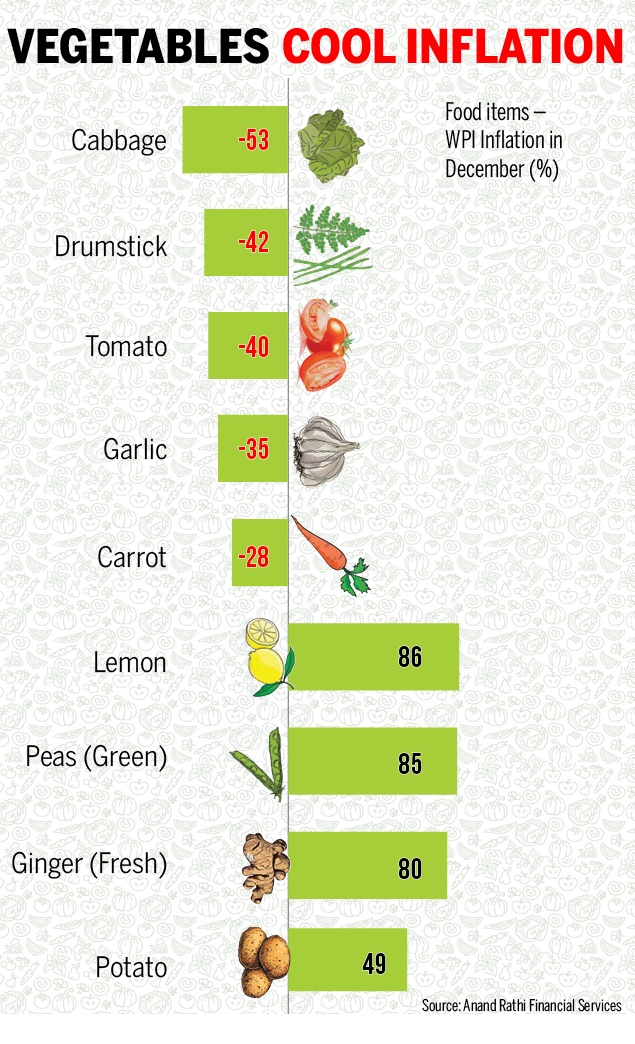
WPI inflation in December 2018
Wholesale price index inflation fell faster than consumer price index inflation in December 2018, edging down to 3.8 per cent on the back of dip in food prices. Within food, vegetable prices registered the lowest inflation. Eight of the top 10 that registered price deflation were in the food category. While cabbage price inflation saw the steepest fall, lemon price recorded the highest increase in inflation.
2018 Oct- 2019 Dec
January 15, 2020: The Times of India

From: January 15, 2020: The Times of India
NEW DELHI: Wholesale price inflation shot up to a seven-month high in December, largely led by a huge spike in onion prices, vegetable and food prices and making it tough for RBI to lower interest rates.
Official data released on Tuesday showed inflation, as measured by the wholesale price index (WPI), rose an annual 2.6% in December from 0.6% in previous month but lower than 3.5% rate in the corresponding month of 2018.
Food inflation soared by 13.2%, driven by a 456% rise in prices of onions. Vegetable prices shot up by an annual 70% during the month, while potato prices rose 45%.
The movement in WPI mirrored retail inflation data released on Monday, which rose to a five-and a half-year high of 7.4% in December led by a sharp spike in food prices. Food inflation under consumer price inflation increased by 14%, highest in nearly six-years.
Sharp rise in inflation has come at a time when growth is estimated to slow to an 11-year low of 5% in the current fiscal year. Economists said the sharp increase in inflation rates will complicate the policy choice for the central bank, which will now continue with its pause on interest rates.
Experts expect prices of vegetables to moderate in the months ahead as supplies improve and all eyes are now on the February 1 Budget for measures to boost overall growth.
“Encouragingly, the sequential contraction in vegetables and protein complex seen in WPI should spill over to retail inflation with a lag. We see WPI inflation remaining range-bound in near-term and moderate to 1.8% in FY20, largely led by significant correction in core WPI inflation. However, with recent CPI inflation at 7.4% and looking to remain above RBI’s tolerance range in near-term, MPC (monetary policy committee) may find it difficult to ignore the inflation outlook even as it may see vegetables price shock transient,” said Madhavi Arora, lead economist, Edelweiss Securities.
“It deepens the policy dilemma, amid overshooting inflation, undershooting growth and fragile fiscal state. We think conventional monetary accommodation still has further steam of another ~50bps in this rate cut cycle, admittedly contingent on evolution of inflation, amid various domestic and global idiosyncrasies. Nonetheless the timing of same is a tad tricky. But for now, February cut seems to be ruled out,” said Arora.
2018 Oct- 2019 Dec
January 15, 2020: The Times of India
NEW DELHI: Retail inflation rose to a 65-month high in December on the back of soaring vegetable prices as food inflation hit an over six-year high, prompting economists to predict that the Reserve Bank of India (RBI) will continue with its pause on interest rates.
Date released by the National Statistical Office (NSO) on Monday showed retail inflation as measured by the consumer price index rose to an over five year-high of 7.4% in December, higher than the previous month’s 5.5% and way above the 2.1% recorded in December 2018.
This is the highest since 7.4% recorded in July 2014. For the first time since July 2016, the inflation figure shot past the 6% upper band of the central bank’s comfort zone.
The latest numbers comes as a double whammy for the BJP government, which is battling slowing growth that is estimated at an 11-year low of 5%.
The overall inflation rate is the highest since the BJP government took office in May 2014. The Modi administration was so far successful in containing inflation at low levels for a significant period, providing headroom to the central bank to cut rates to accelerate growth.
The key reason for the sharp spike has been prices of vegetables and pulses. Vegetable prices rose an annual 60.5%, largely driven by onions, and prices of pulses by 15.4%. The government expects overall inflation to moderate in the coming months as supplies improve.
The food price index rose 14.1% during December, the highest in the new series, which was introduced in January 2014. It was the highest in nearly six years since November 2013 when it had soared to 15.4% in the old series which had 2010 as the base year, according to official data.
Core inflation, which is minus food and fuel, too rose marginally to 3.7% in December, compared with 3.5% in the previous month.
Inflation in rural areas was at a 5-year high of 7.3% during December while in urban centres it was at a 6-year high of 7.5%. The data showed that 12 out of the 22 states and union territories had higher inflation than the overall inflation of 7.4%.
The inflation numbers come ahead of the February 1 budget which is expected to unveil fresh measures to boost growth.
Economists attributed the sharp spike to higher vegetable prices, which are at a six-year high, while pulses shot up to a three-year high.
“While food inflation has ascended to double digits, it is not broad-based. It is specifically in vegetables, followed by pulses, which are behind the surge. If you exclude them, food inflation is still 5%, which is a 33-month high,” said DK Joshi, chief economist at ratings agency Crisil.
Economists also said a sharp spike in the transport and communication segment added to the inflationary pressure. They said they expect inflation to remain at elevated levels although moderation in onion and potato prices may help ease overall inflation.
“Considering the higher than targeted level of inflation and the fiscal challenges with regard to the government surpassing its fiscal deficit target, the RBI is likely to maintain its status quo on the policy rates in the forthcoming policy meeting. Going ahead, RBI’s monetary policy would remain contingent on the inflation trajectory and the government’s fiscal stance,” said Madan Sabnavis, chief economist at CARE Ratings.
2021- 23 Feb
March 15, 2023: The Times of India
From: March 15, 2023: The Times of India
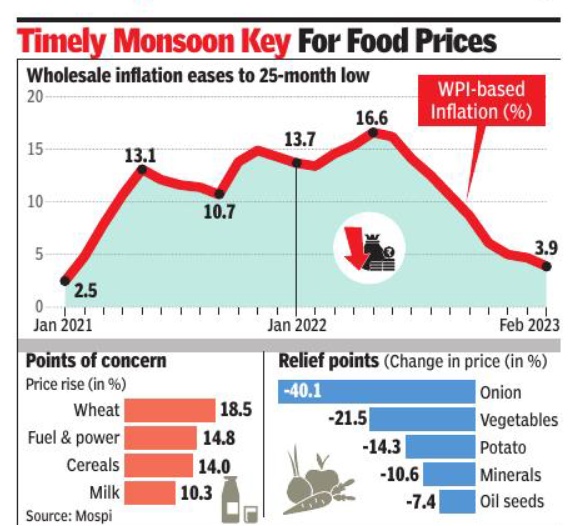
New Delhi : The wholesale price-based inflation declined to a nearly two-year low of 3. 9% in February on easing prices of manufactured items, fuel and power, even though food items remained expensive.
This is the ninth straight month of decline in the rate of wholesale price-index (WPI) -based inflation. WPI inflation was 4. 7% in January and 13. 4% in February, last year.
“Decline in the rate of inflation is primarily contributed by fall in prices of crude petroleum & natural gas, non-food articles, food products, minerals, computer, electronic & optical products, chemicals & chemical products, electrical equipment and motor vehicles, trailers & semi-trailers,” the commerce and industry ministry said. The 3. 9% WPI inflation is the lowest since January 2021, when the rate of price rise on wholesale basis was 2. 5%.
The decline in the rate of price rise was mainly due to a favourable base effect, economists said, adding that going forward, softening commodity prices would help ease WPI inflation further.
However, the future course of food inflation would depend on weather-related conditions and timely monsoon. Although inflation in manufactured items softened, inthe case of food articles it rose to 3. 8% in February, from 2. 4% in January. Inflation in pulses was 2. 6%, while in vegetables was -21. 5%. Inflation in oil seeds was -7. 4% in February 2023 (see graphic).
Fuel and power basket inflation eased to 14. 8%, from 15. 2% in the preceding month. In manufactured products it was 1. 9%, against nearly 3% in January. The deceleration in WPI comes in line with the dip in retail inflation. AGENCIES
The world vis-à-vis India
G20 countries: 2014-23
Sep 15, 2023: The Times of India

From: Sep 15, 2023: The Times of India
High fuel prices after the Ukraine war and resurgent demand at the end of Covid lockdowns have increased inflation around the world. Data for the world’s largest economies – which are part of the G20 group – reveals that prices have risen faster in the developed countries in the past three years. However, analysis by Atul Thakur shows it is the developing world – India included – that bears the brunt of inflation in the long run
Inflation Over 1 Year
With 48% inflation, Turkiye saw the highest price rise among G20 countries between July 2022 and July 2023. This is far higher than India’s 7.5% inflation, which puts it at second place. Three other G20 members – UK, Germany, and Italy – averaged more than the group’s average of 5.8% inflation over a year-long period.
While Argentina, Australia, Japan and Russia aren’t included in this comparison because of patchy data, and the EU is left out as its biggest members are already included, the 10 remaining G20 members had inflation lower than the G20 average of 5.8% (see chart), per the OECD (Organisation for Economic Co-operation and Development), which compiles data for its 38 member countries as well as other groupings like the G20.
Inflation Over 3 Years
Turkiye also had the highest inflation over the three years from July 2020 to July 2023, with prices rising by more than 216%. Brazil and the UK followed with prices up by more than 20% with the G20 average at 20.8%. Mexico, India, Germany, South Africa and the US saw prices increase by 18% or more during the same period. The four G20 members with the lowest inflation were the Asian nations of South Korea, Indonesia, Saudi Arabia and China.
Inflation Over 5 Years
The picture changes when you look at a 5-year period in which Covid and Ukraine have a lesser impact. While Turkiye still tops with over 312% price rise, inflation across the developed members of G20 is less than the group’s average of 28.1%. India and Brazil occupy the second and third places with over 30% inflation while Mexico is fourth with 29%.
Inflation Over 10 Years
With a 566.8% price rise, Turkiye’s chronic inflation problem keeps it at the top of the table even when you look at a 10-year period. Brazil and India trade places but remain in the top three with over 70% inflation. South Africa and Mexico are the other countries with inflation higher than the G20 average of 45.6%. Prices were more stable in the rich West even though Korea, China and Saudi Arabia had the lowest inflation.
Price rise: Jan 2010-July 2014
Pricey Places
The Times of India Aug 30 2014
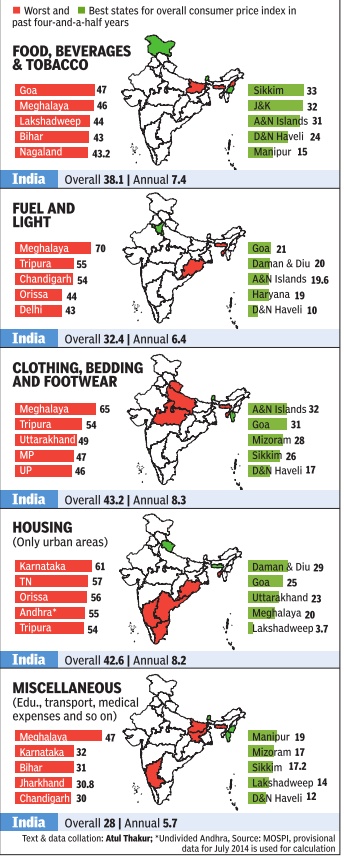
Between Jan 2010-July 2014, India has seen retail prices rise 35.6% on average, equivalent to an annual rate of about 7%. But different states have witnessed varying levels of price rise.
Consumer Price Index (CPI)
Measuring price rise: CPI’s consumption basket
The Times of India, Sep 14 2015
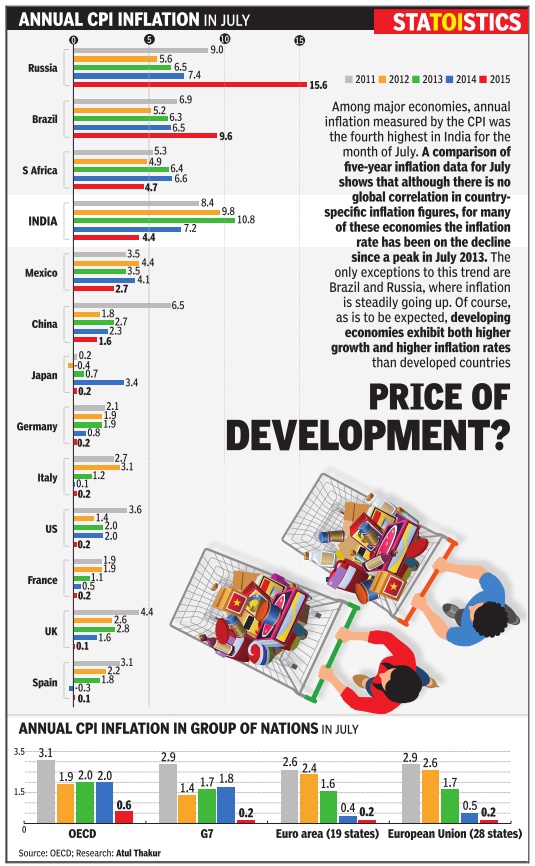
Low weightage to pulses in CPI helped check price rise How is price rise measured?
There are two widely accepted ways of measuring price rise or inflation: the wholesale price index (WPI) and the consumer price index (CPI). The WPI is designed to measure trends of wholesale prices of goods. In short, it tracks the farm and factory gate price of commodities before they reach the retail market. Services are not included in the WPI. The CPI, on the other hand, measures the general level of retail prices of goods and services consumed by households. From a consumer's point of view, it is the CPI that is more meaningful.
What commodities are included in the WPI and what is the base year?
The price index is measured with respect to a particular year called the base year. The base year chosen should be one in which prices were normal and not affected by some unusual natural calamity or international crisis. For the measurement of the current WPI in India, 2004-05 is the base year while for the CPI, 2012 is the base year. The WPI aims to capture all commodity trans actions carried out in the domestic market and hence it includes most of them. Weights are assigned to different commodities on the basis of the proportion of that commodity's transactions to all wholesale transactions in the economy .
How is the CPI's consumption basket made?
The consumption basket of the CPI is meant to represent all households in the country. For instance, the new CPI index includes all items which more than 75% of the country's households have reportedly consumed.Weights are assigned to various CPI commodities on the basis of average monthly consumption expenditure on these items discovered as part of a survey.
Why do the CPI and WPI show divergent inflation trends?
According to the latest data, inflation measured at the wholesale level was -4.05% for July 2015 when compared to July 2014. For the same period, the combined inflation rate for rural and urban consumers was 7.39%. This anomaly is attributed to several reasons. The most important is the weight of various commodities. For instance, the highest weight in CPI is given to food items, which comprise about 54.2%.In the WPI, the corresponding weight is just 14.3% and hence the high food price inflation that is troubling the country affects this index much less. Apart from this there is a tendency to counter the increase in the cost of raw materials by giving below normal wage increases to workers. In that case, the WPI will be low, but not the CPI.
Why are soaring pulse prices not reflected in the CPI?
The CPI is based on the actual consumption pattern of households and its composition is revised from time to time, with weights of various commodities changing according to their consumption. If prices of pulses continue to rise rapidly , their weight in the index will also go up unless the price increase is offset by a decline in their consumption. The present CPI food basket, however, gives a higher weight to milk and milk products, vegetables, prepared meals, meat and fish, sugar and spices than to pulses. The low weight for pulses explains why their price increase has only a minor impact on the CPI as a whole.
November 2016: CPI data
The Hindu’’, December 14, 2016
Retail inflation at 2-year low
Retail inflation, measured by consumer price index (CPI), fell to a two-year low in November 2016 at 3.63 per cent, as depressed consumer demand following demonetisation disrupted daily life.
The CPI print, November 2016 — well below the RBI’s five per cent inflation target for March 2017 — has raised hopes of central bank going in for a repo rate cut at its next monetary policy review meeting.
Note ban effect
The note ban had a telling effect on food articles inflation — 47 per cent weight in CPI —which declined to 2.11 per cent in November from October’s 3.32 per cent.
Food articles inflation in November last year stood at 6.07 per cent.
Overall CPI inflation stood at 5.41 per cent in November in 2015, and at 4.20 per cent in October 2016
Reserve Bank of India targeting and inflation
1981-2017; 2017- 24
Sidhartha, August 20, 2024: The Times of India

Insulation in India VIS-À-VIS Comparable countries
From: Sidhartha, August 20, 2024: The Times of India
New Delhi : The inflation targeting mandate to RBI has helped reduce inflation and made it less volatile, making monetary policy more effective, a new paper by two economists has said.
The paper by Barry Eichengreen, a professor at UC Berkley and NCAER director general Poonam Gupta has suggested that govt should not change RBI’s mandate or tinker with the inflation tolerance band of 2-6%, arguing it would be “risky and counterproductive”.
In recent weeks, especially since the release of the Economic Survey last month, there has been debate over targeting core inflation, excluding food. The paper, however, argued against it. “Our results indicate that food-price inflation feeds through to core inflation as producers mark up the prices of other products. Foodprice inflation, which is captured by headline inflation, has predictive content for future core inflation, in other words, and should not be disregarded. Whereas central banks in advanced economies have been able to look through fluctuations in food and fuel price inflation, without consequences for core inflation and therefore without jeopardising their inflation targets, in India, where food is a much more important component of consumption baskets, this may not be the case.”
Instead, it called for an urgent reworking of the weight assigned to food and beverages in the basket of goods that make up the consumer price index (CPI). Arguing that the per capita income has doubled since 2011-12, when the 45.8% weight was assigned, the paper suggested that a 40% weight should now be assigned now, which is likely to decline to 30% in a decade based on the per capita income projections.
While RBI has a 4% inflation target as against 4.5% in Brazil, 3% in Indonesia and 1.5% in Thailand, the economists said, India has lower income and a faster-growing catch up economy and the current goal is appropriate.
They also concluded that keeping inflation within a narrower band, than the current 2-6%, will require more frequent changes in policy rates. “Such variations might create a less predictable climate for investment and hence challenges for economic growth,” it said adding that the world was entering a period of heightened volatility.
State-wise data on inflation
Dec. 2015: Wide variations across states
The Times of India Feb 02 2016
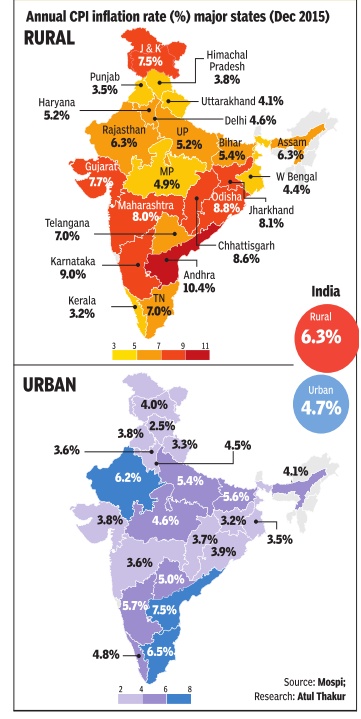
Inflation in December was 4.7% for urban India and 6.3% for rural India. But this all-India average figure is of little use to the common man. We don't really live in India, we live in one of its states.And inflation rate varies hugely across states. As hugely as 7.5% in urban Andhra Pradesh and only 2.5% in urban Himachal Pradesh--that's a gap of 5 percentage point. Difference between highest and lowest rural inflation was even greater: 6.6%
State-wise inflation: 2015-16

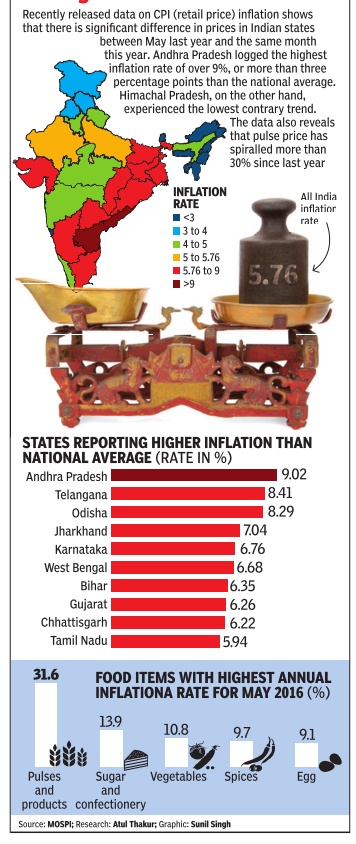
See graphics
Food inflation. Rise in the price of potatoes, 2015-16, and tomatoes, 2014-16
State-wise inflation, 2015-16
2018, Aug: Bengal, Assam, J&K 4 times higher than Rajasthan

From: September 15, 2018: The Times of India

From: September 15, 2018: The Times of India
See graphics:
Most and least expensive states in India, August 2018
High and low inflation states in 2018, August
2018
February 2, 2019: The Times of India
From: February 2, 2019: The Times of India

From: February 2, 2019: The Times of India

From: February 2, 2019: The Times of India
See graphics:
2018- State-wise data on inflation- Overall inflation and vegetables
2018- State-wise data on inflation- Recreation and pulses
2018- State-wise data on inflation- Meat and fish and healthcare
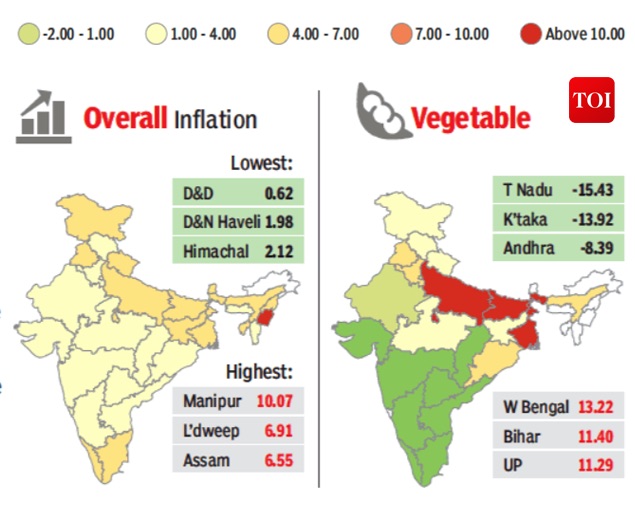
The rate of inflation you read about every month is how the average of thousands of prices moves in that month versus the previous month or past year. But like any average, all-India, all-product inflation hides more than it reveals. This is how widely inflation rates of five product groups of common consumption varied across states in 2018 over 2017
2019, Oct

From: Nov 20, 2019: The Times of India
See graphic:
State-wise inflation in India, 2019 Oct

