Monsoons: India
(→2020) |
(→1929 – 2023) |
||
| (24 intermediate revisions by 2 users not shown) | |||
| Line 222: | Line 222: | ||
“In the last five years, we have had a couple of instances of cyclones affecting monsoon progress. In 2015, cyclone Ashobha arrived between June 8-11, and that year, the monsoon propagated fast. In 2018, there were two cyclones, Sagar and Mekunu, in May,” said S Abhilash, associate professor, Advanced Centre for Atmospheric Radar Research (ACAAR), Cochin university. “Though the monsoon had arrived, further progression was halted for a week. The next year, in 2019, cyclones Vayu from June 10-13 took away the moisture, which affected monsoon progression negatively. All these are Arabian Sea systems. However, most Bay of Bengal systems which formed in May have helped the monsoon for normal onset and further progress.” | “In the last five years, we have had a couple of instances of cyclones affecting monsoon progress. In 2015, cyclone Ashobha arrived between June 8-11, and that year, the monsoon propagated fast. In 2018, there were two cyclones, Sagar and Mekunu, in May,” said S Abhilash, associate professor, Advanced Centre for Atmospheric Radar Research (ACAAR), Cochin university. “Though the monsoon had arrived, further progression was halted for a week. The next year, in 2019, cyclones Vayu from June 10-13 took away the moisture, which affected monsoon progression negatively. All these are Arabian Sea systems. However, most Bay of Bengal systems which formed in May have helped the monsoon for normal onset and further progress.” | ||
| + | |||
| + | |||
| + | |||
[[Category:Climate/Meteorology|MMONSOONS: INDIAMONSOONS: INDIAMONSOONS: INDIAMONSOONS: INDIAMONSOONS: INDIA | [[Category:Climate/Meteorology|MMONSOONS: INDIAMONSOONS: INDIAMONSOONS: INDIAMONSOONS: INDIAMONSOONS: INDIA | ||
| Line 233: | Line 236: | ||
=Factors that influence the monsoons= | =Factors that influence the monsoons= | ||
| + | ==Air pollution== | ||
| + | [https://epaper.timesgroup.com/article-share?article=28_04_2023_020_001_cap_TOI Neha Madaan, April 28, 2023: ''The Times of India''] | ||
| + | |||
| + | |||
| + | Pune: Air pollution and a rise in west Pacific tropical cyclones have played their parts in weakening the Indian monsoon the past few decades, according to a study by researchers from Indian Institute of Tropical Meteorology in Pune. | ||
| + | |||
| + |
The researchers held that greenhouse gas emissions and other human activities can significantly alter the pattern of monsoon flow over the tropical Indo-Pacific Oceans and lead to an increase in tropical cyclones over the west Pacific. Higher frequency of tropical Pacific cyclones can cause a weakening of the monsoon, as it is associated with moisture depletion over India. “Monsoon in India depends on low-level moisture transport from the Indian Ocean towards the Indian landmass. This flow tends to weaken due to human-induced pollution as per our model simulations,” said Dr TP Sabin, a senior IITM scientist. The study was led by Dr R Krishnan, director of the institute. | ||
| + | |||
| + | “Human-induced climate drivers, particularly greenhouse gases and aerosols, can impact precipitation patterns over the Asian monsoon region. While the increase in greenhouse gases can intensify rainfall, aerosol emissions (minute suspended pollutant particles) exert the opposite influence,” Sabin said. The scientist explained that high levels of aerosol in the atmosphere can deflect the sun’s heat back into space rather than warming the earth’s surface. “This leads to a decrease in temperatures on the earth’s surface and reduces rainfall,” he said. The study found that aerosol emissions in the northern hemisphere have contributed to a decline in monsoon rainover India. | ||
| + | |||
| + | |||
==Dust, soot from West Asia affect monsoon in India== | ==Dust, soot from West Asia affect monsoon in India== | ||
===Summary=== | ===Summary=== | ||
| Line 287: | Line 301: | ||
Materials provided by University of Maryland. Note: Content may be edited for style and length. | Materials provided by University of Maryland. Note: Content may be edited for style and length. | ||
| + | |||
| + | [[Category:Climate/Meteorology|MMONSOONS: INDIAMONSOONS: INDIAMONSOONS: INDIAMONSOONS: INDIAMONSOONS: INDIA | ||
| + | MONSOONS: INDIA]] | ||
| + | [[Category:India|MMONSOONS: INDIAMONSOONS: INDIAMONSOONS: INDIAMONSOONS: INDIAMONSOONS: INDIA | ||
| + | MONSOONS: INDIA]] | ||
| + | [[Category:Pages with broken file links|MONSOONS: INDIAMONSOONS: INDIAMONSOONS: INDIAMONSOONS: INDIA | ||
| + | MONSOONS: INDIA]] | ||
| + | [[Category:S&T|MMONSOONS: INDIAMONSOONS: INDIAMONSOONS: INDIAMONSOONS: INDIAMONSOONS: INDIA | ||
| + | MONSOONS: INDIA]] | ||
=Criteria used in deciding whether monsoon has arrived = | =Criteria used in deciding whether monsoon has arrived = | ||
| Line 292: | Line 315: | ||
See graphic, ' i) The criteria that IMD adopts to decide whether monsoon has arrived or not. <br/> ii)The dates on which the monsoon normally reaches various parts of India. ', | See graphic, ' i) The criteria that IMD adopts to decide whether monsoon has arrived or not. <br/> ii)The dates on which the monsoon normally reaches various parts of India. ', | ||
=The amount of rainfall= | =The amount of rainfall= | ||
| − | [[File: | + | ==Average rainfall== |
| + | ===1929 – 2023=== | ||
| + | [[File: Average, mean rainfall in India,1929 – 2023.jpg|Average/ mean rainfall in India, 1929 – 2023 <br/> From: [https://epaper.indiatimes.com/article-share?article=06_09_2024_012_003_cap_TOI Sep 6, 2024: ''The Times of India'']|frame|500px]] | ||
| + | |||
| + | '''See graphic''': | ||
| + | |||
| + | '' Average/ mean rainfall in India. 1929 – 2023 '' | ||
| + | |||
| + | [[Category:Climate/Meteorology|MMONSOONS: INDIAMONSOONS: INDIAMONSOONS: INDIAMONSOONS: INDIAMONSOONS: INDIAMONSOONS: INDIA | ||
| + | MONSOONS: INDIA]] | ||
| + | [[Category:India|MMONSOONS: INDIAMONSOONS: INDIAMONSOONS: INDIAMONSOONS: INDIAMONSOONS: INDIAMONSOONS: INDIA | ||
| + | MONSOONS: INDIA]] | ||
| + | [[Category:Pages with broken file links|MONSOONS: INDIAMONSOONS: INDIAMONSOONS: INDIAMONSOONS: INDIAMONSOONS: INDIA | ||
| + | MONSOONS: INDIA]] | ||
| + | [[Category:S&T|MMONSOONS: INDIAMONSOONS: INDIAMONSOONS: INDIAMONSOONS: INDIAMONSOONS: INDIAMONSOONS: INDIA | ||
| + | MONSOONS: INDIA]] | ||
==1901-2013: Monsoons that crossed the 100% mark== | ==1901-2013: Monsoons that crossed the 100% mark== | ||
| Line 345: | Line 383: | ||
MONSOONS: INDIA]] | MONSOONS: INDIA]] | ||
[[Category:S&T|MMONSOONS: INDIAMONSOONS: INDIAMONSOONS: INDIAMONSOONS: INDIAMONSOONS: INDIA | [[Category:S&T|MMONSOONS: INDIAMONSOONS: INDIAMONSOONS: INDIAMONSOONS: INDIAMONSOONS: INDIA | ||
| + | MONSOONS: INDIA]] | ||
| + | |||
| + | [[Category:Climate/Meteorology|MMONSOONS: INDIAMONSOONS: INDIAMONSOONS: INDIAMONSOONS: INDIAMONSOONS: INDIA | ||
| + | MONSOONS: INDIA]] | ||
| + | [[Category:India|MMONSOONS: INDIAMONSOONS: INDIAMONSOONS: INDIAMONSOONS: INDIAMONSOONS: INDIA | ||
| + | MONSOONS: INDIA]] | ||
| + | [[Category:Pages with broken file links|MONSOONS: INDIAMONSOONS: INDIAMONSOONS: INDIAMONSOONS: INDIA | ||
| + | MONSOONS: INDIA]] | ||
| + | [[Category:S&T|MMONSOONS: INDIAMONSOONS: INDIAMONSOONS: INDIAMONSOONS: INDIAMONSOONS: INDIA | ||
| + | MONSOONS: INDIA]] | ||
| + | |||
| + | [[Category:Climate/Meteorology|MMONSOONS: INDIAMONSOONS: INDIAMONSOONS: INDIAMONSOONS: INDIAMONSOONS: INDIAMONSOONS: INDIA | ||
| + | MONSOONS: INDIA]] | ||
| + | [[Category:India|MMONSOONS: INDIAMONSOONS: INDIAMONSOONS: INDIAMONSOONS: INDIAMONSOONS: INDIAMONSOONS: INDIA | ||
| + | MONSOONS: INDIA]] | ||
| + | [[Category:Pages with broken file links|MONSOONS: INDIAMONSOONS: INDIAMONSOONS: INDIAMONSOONS: INDIAMONSOONS: INDIA | ||
| + | MONSOONS: INDIA]] | ||
| + | [[Category:S&T|MMONSOONS: INDIAMONSOONS: INDIAMONSOONS: INDIAMONSOONS: INDIAMONSOONS: INDIAMONSOONS: INDIA | ||
MONSOONS: INDIA]] | MONSOONS: INDIA]] | ||
| Line 351: | Line 407: | ||
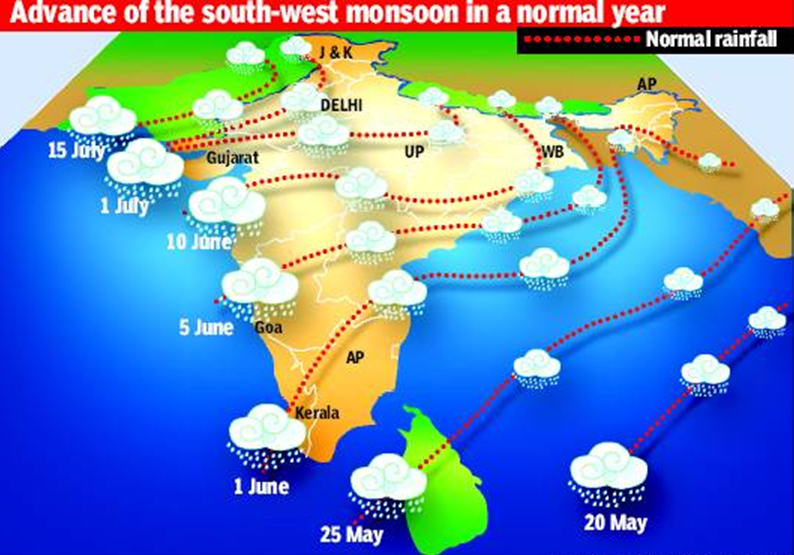
[[File: moonsoon1.png| The dates on which the monsoon normally reaches various parts of India.|frame|500px]] | [[File: moonsoon1.png| The dates on which the monsoon normally reaches various parts of India.|frame|500px]] | ||
See graphic, ' The dates on which the monsoon normally reaches various parts of India. ' | See graphic, ' The dates on which the monsoon normally reaches various parts of India. ' | ||
| − | == Years in which the monsoon arrived early == | + | ==Years in which the monsoon arrived early == |
===2011-2014=== | ===2011-2014=== | ||
[[File: years in which the monsoon arrived early.jpg|Years in which the monsoon arrived early: 2011-2014; Graphic courtesy: [http://epaperbeta.timesofindia.com//Gallery.aspx?id=15_05_2015_009_024_009&type=P&artUrl=Monsoon-may-be-early-but-El-Nino-fear-15052015009024&eid=31808 ''The Times of India'']|frame|500px]] | [[File: years in which the monsoon arrived early.jpg|Years in which the monsoon arrived early: 2011-2014; Graphic courtesy: [http://epaperbeta.timesofindia.com//Gallery.aspx?id=15_05_2015_009_024_009&type=P&artUrl=Monsoon-may-be-early-but-El-Nino-fear-15052015009024&eid=31808 ''The Times of India'']|frame|500px]] | ||
| + | |||
See graphic, ' Years in which the monsoon arrived early: 2011-2014' | See graphic, ' Years in which the monsoon arrived early: 2011-2014' | ||
| + | |||
| + | ==Years in which the monsoon arrived late== | ||
| + | ===2000-23=== | ||
| + | [[File: Years when the monsoon arrived late over the Indian mainland, 2000- 2023.jpg|Years when the monsoon arrived late over the Indian mainland, 2000- 2023 <br/> From: [https://epaper.timesgroup.com/article-share?article=09_06_2023_001_031_cap_TOI June 9, 2023: ''The Times of India'']|frame|500px]] | ||
| + | |||
| + | '''See graphic''': | ||
| + | |||
| + | '' Years when the monsoon arrived late over the Indian mainland, 2000- 2023 '' | ||
[[Category:Climate/Meteorology|MMONSOONS: INDIAMONSOONS: INDIAMONSOONS: INDIAMONSOONS: INDIAMONSOONS: INDIA | [[Category:Climate/Meteorology|MMONSOONS: INDIAMONSOONS: INDIAMONSOONS: INDIAMONSOONS: INDIAMONSOONS: INDIA | ||
| Line 384: | Line 449: | ||
“This was one of the smoothest advances of the monsoon in recent years. Usually the monsoon progresses in fits and starts, but this year it did not stall for long at any stage,” said D Sivananda Pai, IMD’s lead monsoon forecaster. | “This was one of the smoothest advances of the monsoon in recent years. Usually the monsoon progresses in fits and starts, but this year it did not stall for long at any stage,” said D Sivananda Pai, IMD’s lead monsoon forecaster. | ||
| + | |||
| + | |||
| + | ===2013-2022=== | ||
| + | [[File: The date by which the Monsoon covered all of India, 2013-2022.jpg| The date by which the Monsoon covered all of India, 2013-2022 <br/> From: [https://epaper.timesgroup.com/article-share?article=03_07_2022_011_006_cap_TOI Vishwa Mohan, July 3, 2022: ''The Times of India'']|frame|500px]] | ||
| + | |||
| + | '''See graphic''': | ||
| + | |||
| + | '' The date by which the Monsoon covered all of India, 2013-2022 '' | ||
| + | |||
| + | [[Category:Climate/Meteorology|MMONSOONS: INDIAMONSOONS: INDIAMONSOONS: INDIAMONSOONS: INDIAMONSOONS: INDIA | ||
| + | MONSOONS: INDIA]] | ||
| + | [[Category:India|MMONSOONS: INDIAMONSOONS: INDIAMONSOONS: INDIAMONSOONS: INDIAMONSOONS: INDIA | ||
| + | MONSOONS: INDIA]] | ||
| + | [[Category:Pages with broken file links|MONSOONS: INDIAMONSOONS: INDIAMONSOONS: INDIAMONSOONS: INDIA | ||
| + | MONSOONS: INDIA]] | ||
| + | [[Category:S&T|MMONSOONS: INDIAMONSOONS: INDIAMONSOONS: INDIAMONSOONS: INDIAMONSOONS: INDIA | ||
| + | MONSOONS: INDIA]] | ||
== Kerala, 2005-2017: actual dates== | == Kerala, 2005-2017: actual dates== | ||
| Line 398: | Line 480: | ||
MONSOONS: INDIA]] | MONSOONS: INDIA]] | ||
| − | ==Delhi: 2007-12== | + | ==Delhi== |
| + | ===1960-21=== | ||
| + | [[File: Monsoon advancement in Delhi, 1960-21.jpg|Monsoon advancement in Delhi, 1960-21 <br/> From: [https://epaper.timesgroup.com/article-share?article=29_06_2022_002_007_cap_TOI Priyangi.Agarwal, June 29, 2022: ''The Times of India'']|frame|500px]] | ||
| + | |||
| + | '''See graphic''': | ||
| + | |||
| + | '' Monsoon advancement in Delhi, 1960-21 '' | ||
| + | |||
| + | |||
| + | === 2007-12=== | ||
[[File: Delhimonsoon.jpg| The arrival of the monsoon in Delhi: 2007-12|frame|500px]] | [[File: Delhimonsoon.jpg| The arrival of the monsoon in Delhi: 2007-12|frame|500px]] | ||
| − | See accompanying chart for Delhi '' The arrival of the monsoon in Delhi: 2007-12 '' | + | See accompanying chart for Delhi '' The arrival of the monsoon in Delhi: 2007-12 '' |
| − | + | ||
| + | [[Category:Climate/Meteorology|MMONSOONS: INDIAMONSOONS: INDIAMONSOONS: INDIAMONSOONS: INDIAMONSOONS: INDIA | ||
| + | MONSOONS: INDIA]] | ||
| + | [[Category:India|MMONSOONS: INDIAMONSOONS: INDIAMONSOONS: INDIAMONSOONS: INDIAMONSOONS: INDIA | ||
| + | MONSOONS: INDIA]] | ||
| + | [[Category:Pages with broken file links|MONSOONS: INDIAMONSOONS: INDIAMONSOONS: INDIAMONSOONS: INDIA | ||
| + | MONSOONS: INDIA]] | ||
| + | [[Category:S&T|MMONSOONS: INDIAMONSOONS: INDIAMONSOONS: INDIAMONSOONS: INDIAMONSOONS: INDIA | ||
| + | MONSOONS: INDIA]] | ||
| + | |||
==Kerala: 2008-15, onset vs performance == | ==Kerala: 2008-15, onset vs performance == | ||
[[File: Monsoons onset vs performance 2008-15.jpg|Date of onset of Monsoons in Kerala, 2008-15, vis-à-vis its all- India performance. There is no correlation between early or late arrival in Kerala and good or bad all- India performance <br/> Graphic courtesy: [http://epaperbeta.timesofindia.com//Article.aspx?eid=31808&articlexml=Monsoon-hits-Kerala-but-may-lose-its-mojo-06062015021003 ''The Times of India'']|frame|500px]] | [[File: Monsoons onset vs performance 2008-15.jpg|Date of onset of Monsoons in Kerala, 2008-15, vis-à-vis its all- India performance. There is no correlation between early or late arrival in Kerala and good or bad all- India performance <br/> Graphic courtesy: [http://epaperbeta.timesofindia.com//Article.aspx?eid=31808&articlexml=Monsoon-hits-Kerala-but-may-lose-its-mojo-06062015021003 ''The Times of India'']|frame|500px]] | ||
See graphic, ' Date of onset of Monsoons in Kerala, 2008-15, vis-à-vis its all- India performance. There is no correlation between early or late arrival in Kerala and good or bad all- India performance' | See graphic, ' Date of onset of Monsoons in Kerala, 2008-15, vis-à-vis its all- India performance. There is no correlation between early or late arrival in Kerala and good or bad all- India performance' | ||
| + | |||
| + | ==Mumbai== | ||
| + | Dates of arrival | ||
| + | |||
| + | |||
| + | June 9: 2021 | ||
| + | |||
| + | June 11: 2022 [the normal date of arrival] | ||
| + | |||
| + | June 14: 2020 | ||
| + | |||
| + | June 25: 2019. | ||
| + | |||
| + | [[Category:Climate/Meteorology|MMONSOONS: INDIAMONSOONS: INDIAMONSOONS: INDIAMONSOONS: INDIAMONSOONS: INDIA | ||
| + | MONSOONS: INDIA]] | ||
| + | [[Category:India|MMONSOONS: INDIAMONSOONS: INDIAMONSOONS: INDIAMONSOONS: INDIAMONSOONS: INDIA | ||
| + | MONSOONS: INDIA]] | ||
| + | [[Category:Pages with broken file links|MONSOONS: INDIAMONSOONS: INDIAMONSOONS: INDIAMONSOONS: INDIA | ||
| + | MONSOONS: INDIA]] | ||
| + | [[Category:S&T|MMONSOONS: INDIAMONSOONS: INDIAMONSOONS: INDIAMONSOONS: INDIAMONSOONS: INDIA | ||
| + | MONSOONS: INDIA]] | ||
| + | |||
| + | ==Mumbai and Delhi together== | ||
| + | 2023: The monsoon on 23 June advanced over both Delhi and Mumbai together for the first time since June 21, 1961, the IMD said. | ||
==2011-15: actual and forecast dates== | ==2011-15: actual and forecast dates== | ||
| Line 411: | Line 535: | ||
| + | |||
| + | [[Category:Climate/Meteorology|MMONSOONS: INDIAMONSOONS: INDIAMONSOONS: INDIAMONSOONS: INDIAMONSOONS: INDIA | ||
| + | MONSOONS: INDIA]] | ||
| + | [[Category:India|MMONSOONS: INDIAMONSOONS: INDIAMONSOONS: INDIAMONSOONS: INDIAMONSOONS: INDIA | ||
| + | MONSOONS: INDIA]] | ||
| + | [[Category:Pages with broken file links|MONSOONS: INDIAMONSOONS: INDIAMONSOONS: INDIAMONSOONS: INDIA | ||
| + | MONSOONS: INDIA]] | ||
| + | [[Category:S&T|MMONSOONS: INDIAMONSOONS: INDIAMONSOONS: INDIAMONSOONS: INDIAMONSOONS: INDIA | ||
| + | MONSOONS: INDIA]] | ||
[[Category:Climate/Meteorology|MMONSOONS: INDIAMONSOONS: INDIAMONSOONS: INDIAMONSOONS: INDIAMONSOONS: INDIA | [[Category:Climate/Meteorology|MMONSOONS: INDIAMONSOONS: INDIAMONSOONS: INDIAMONSOONS: INDIAMONSOONS: INDIA | ||
| Line 496: | Line 629: | ||
=How the monsoons control our destiny= | =How the monsoons control our destiny= | ||
| + | ==A backgrounder/ 2000-24== | ||
| + | [https://epaper.indiatimes.com/article-share?article=20_04_2024_016_023_cap_TOI Vishwa Mohan & Surojit Gupta, April 20, 2024: ''The Times of India''] | ||
| + | |||
| + | [[File: Region – wise variation in rainfall from June to September- All India averages are meaningless.jpg|Region – wise variation in rainfall from June to September- All India averages are meaningless <br/> From: [https://epaper.indiatimes.com/article-share?article=20_04_2024_016_023_cap_TOI Vishwa Mohan & Surojit Gupta, April 20, 2024: ''The Times of India'']|frame|500px]] | ||
| + | |||
| + | [[File: How rainfall, or its absence, affected inflation, food inflation, and agriculture GDP growth between 200 and 2024.jpg|How rainfall, or its absence, affected inflation, food inflation, and agriculture GDP growth between 200 and 2024 <br/> From: [https://epaper.indiatimes.com/article-share?article=20_04_2024_016_023_cap_TOI Vishwa Mohan & Surojit Gupta, April 20, 2024: ''The Times of India'']|frame|500px]] | ||
| + | |||
| + | |||
| + | Former President Pranab Mukherjee, who was earlier a finance minister, had once remarked that the monsoon season (JuneSept) was India’s true finance minister, indicating the significance of rain during the period for the country. A lot has changed since then – large parts of India’s agriculture have been droughtproofed through irrigation networks, better varieties of seeds are being used — but the importance of summer (southwest) monsoon remains high, for some old and some new reasons. It contributes 70% of the country’s rainfall and still supports farming sector to a large extent, recharges ground water and greens energy supply by making hydro power viable. Changing food consumption pattern, more open trade and increased role of sentiments in the economy have altered the way monsoon impacts our economic life. But first, what exactly is a normal monsoon?
| ||
| + | |||
| + | ''' Normal or above normal? ''' | ||
| + | |||
| + |
The India Meteorological Department (IMD) predicted on Monday that the country is “most likely” to experience ‘above normal’ rainfall. The seasonal rainfall is likely to be 106% of long period average (LPA) with a model error of ± 5%. The LPA of seasonal rainfall over the country as a whole for the period 1971-2020 is 87cm.
| ||
| + | |||
| + | ''' Factors indicating good rainfall ''' | ||
| + | |||
| + |
IMD believes the gradual weakening of El Nino (climate pattern associated with warming of the ocean surface in the central and eastern tropical Pacific Ocean), expected development of La Nina (climate pattern associated with the periodic cooling of ocean surface temperatures in the central and east-central equatorial Pacific), positive Indian Ocean Dipole (IOD) and below normal snow cover over northern hemisphere will ensure good rain this monsoon.
| ||
| + | |||
| + | ''' El Nino ''' | ||
| + | |||
| + |
(means ‘little boy’ in Spanish): It occurs on average every two to seven years, and typically lasts nine to 12 months. It influences weather and storm patterns in different parts of the world. The current El Nino event, which developed in June 2023 and peaked in December, was at its strongest between Nov and Jan this year. | ||
| + |
The Met department says moderate El Nino conditions are currently prevailing over the equatorial Pacific region. The latest climate model forecasts indicate that El Nino conditions are likely to weaken further to neutral El Nino Southern Oscillation (ENSO) condition in the early part of the monsoon season. | ||
| + | |||
| + |
La Nina (means ‘little girl’ in Spanish): La Nina is linked to good monsoon rainfall in the Indian sub-continent. IMD says La Nina conditions are likely to develop during the second half (AugSept) of the monsoon season. Records show that the summer monsoon was either ‘normal’ or ‘above normal’ in most of the last 22 La Nina years since 1954, except 1974 and 2000 when it was below normal. Data from 1951 to 2023 shows that out of nine years when La Nina was preceded by El Nino, the summer monsoon seasonal rainfall was ‘above normal’ in two years, ‘excess’ in five years and on the positive side of ‘normal’ in two years. | ||
| + | |||
| + |
IOD: It is one of the dominant modes of variability of the tropical Indian Ocean. It is an ocean-atmosphere interaction which is very similar to El Nino. It is, therefore, also known as Indian Nino. It’s defined as the difference in sea surface temperatures between the eastern and western regions of Indian Ocean and can significantly impact weather patterns in the Indian sub-continent and elsewhere, including southeast Asia and Australia. IMD says neutral IOD conditions are prevailing over the Indian Ocean and the latest climate model forecasts indicate that positive IOD conditions are likely to develop during the latter part of the southwest monsoon season.
| ||
| + | |||
| + | ''' Normal for country may not be normal for your city ''' | ||
| + | |||
| + |
Instead of quantitative rainfall over the country as a whole, it’s the distribution of fairly good rainfall across states that matters the most. Though IMD’s latest forecast predicted good rainfall in the ‘monsoon core zone’ (rainfed agriculture region of India), its other rounds of forecasts next month and at the end of June, July and August will give a fairly clear indication of spatial distribution of rainfall.
| ||
| + | |||
| + | ''' Impact on farming ''' | ||
| + | |||
| + |
Water-guzzling paddy is the main crop of the monsoon season beginning June. Though states like Punjab, Haryana and western Uttar Pradesh man- age to sow fairly large areas of land even during the ‘below normal’ monsoon season as they have robust irrigation networks and they use substantial amount of groundwater with the help of subsidised fuel, the states in ‘monsoon core zone’ that largely depend on monsoon rain suffer. It also reflects in their output of Rabi (winter sown) crops such as wheat and mustard. Rabi crops benefit from good monsoon rain as it not only fills reservoirs and water bodies for irrigation during winter but also provides enough moisture content in the soil. | ||
| + | |||
| + |
Drought years, when the country gets less than 90% of LPA, on the other hand, affects the entire country. If we look at the past 10 years’ data, the deficient (drought) monsoon years of 2014 and 2015 resulted in a decline in overall food-grain production. Growing efforts to make the country drought-proof through measures such as expanding the irrigation network, water conservation, precision irrigation (drip and sprinkler) and use of drought-resistant seeds, however, have resulted in cushioning the impact of ‘below normal’ monsoon rains.
| ||
| + | |||
| + | ''' How monsoon impacts economy ''' | ||
| + | |||
| + |
The Indian economy, growing at 7% for three consecutive years, is expected to benefit immensely from a good monsoon. A bumper harvest adds to rural prosperity and triggers demand for everything — from motorcycles to mobile phones. It also helps calm prices as supplies improve. Robust rain also helps in reducing the demand for diesel used in the farm sector. It helps in recharging reservoirs and groundwater levels and also leads to greater hydro power generation. | ||
| + | |||
==1950-2010: India’s growth rate in drought years== | ==1950-2010: India’s growth rate in drought years== | ||
[[File: growth rate during droughts in india.jpg|Growth rate in drought years in India and monsoon departure from normal: 1950-2010 <br/> Graphic courtesy: [http://epaperbeta.timesofindia.com//Gallery.aspx?id=04_06_2015_008_009_003&type=P&artUrl=STATOISTICS-ECONOMYS-DRY-RUN-04062015008009&eid=31808 ''The Times of India'']|frame|500px]] | [[File: growth rate during droughts in india.jpg|Growth rate in drought years in India and monsoon departure from normal: 1950-2010 <br/> Graphic courtesy: [http://epaperbeta.timesofindia.com//Gallery.aspx?id=04_06_2015_008_009_003&type=P&artUrl=STATOISTICS-ECONOMYS-DRY-RUN-04062015008009&eid=31808 ''The Times of India'']|frame|500px]] | ||
| Line 604: | Line 778: | ||
[[File: How monsoon affects farming, 2006-16.jpg|How monsoon affects farming, 2006-16; [http://epaperbeta.timesofindia.com/Gallery.aspx?id=19_04_2017_019_026_006&type=P&artUrl=Agriculture-growth-rate-estimated-at-42-in-2016-19042017019026&eid=31808 The Times of India], April 19, 2017|frame|500px]] | [[File: How monsoon affects farming, 2006-16.jpg|How monsoon affects farming, 2006-16; [http://epaperbeta.timesofindia.com/Gallery.aspx?id=19_04_2017_019_026_006&type=P&artUrl=Agriculture-growth-rate-estimated-at-42-in-2016-19042017019026&eid=31808 The Times of India], April 19, 2017|frame|500px]] | ||
| + | |||
| + | [[Category:Climate/Meteorology|MMONSOONS: INDIAMONSOONS: INDIAMONSOONS: INDIAMONSOONS: INDIAMONSOONS: INDIA | ||
| + | MONSOONS: INDIA]] | ||
| + | [[Category:India|MMONSOONS: INDIAMONSOONS: INDIAMONSOONS: INDIAMONSOONS: INDIAMONSOONS: INDIA | ||
| + | MONSOONS: INDIA]] | ||
| + | [[Category:Pages with broken file links|MONSOONS: INDIAMONSOONS: INDIAMONSOONS: INDIAMONSOONS: INDIA | ||
| + | MONSOONS: INDIA]] | ||
| + | [[Category:S&T|MMONSOONS: INDIAMONSOONS: INDIAMONSOONS: INDIAMONSOONS: INDIAMONSOONS: INDIA | ||
| + | MONSOONS: INDIA]] | ||
= Monsoon break= | = Monsoon break= | ||
| Line 632: | Line 815: | ||
Lastly, Pai said a strong Arabian Sea branch of the monsoon first helped accelerate the rain coverage over the country, and also brought good rains over the west coast. | Lastly, Pai said a strong Arabian Sea branch of the monsoon first helped accelerate the rain coverage over the country, and also brought good rains over the west coast. | ||
| + | |||
| + | =REGION-WISE= | ||
| + | =Monsoons in the various cities, regions= | ||
| + | ==1981-2010== | ||
| + | [[File: Monsoons in the various cities, regions of India, 1981-2010.jpg| Monsoons in the various cities, regions of India, 1981-2010 <br/> From: [https://epaper.indiatimes.com/article-share?article=04_09_2024_009_005_cap_TOI Sep 4, 2024: ''The Times of India'']|frame|500px]] | ||
| + | |||
| + | '''See graphic''': | ||
| + | |||
| + | '' Monsoons in the various cities, regions of India, 1981-2010 '' | ||
| + | |||
| + | [[Category:Climate/Meteorology|MMONSOONS: INDIAMONSOONS: INDIAMONSOONS: INDIAMONSOONS: INDIAMONSOONS: INDIAMONSOONS: INDIA | ||
| + | MONSOONS: INDIA]] | ||
| + | [[Category:India|MMONSOONS: INDIAMONSOONS: INDIAMONSOONS: INDIAMONSOONS: INDIAMONSOONS: INDIAMONSOONS: INDIA | ||
| + | MONSOONS: INDIA]] | ||
| + | [[Category:Pages with broken file links|MONSOONS: INDIAMONSOONS: INDIAMONSOONS: INDIAMONSOONS: INDIAMONSOONS: INDIA | ||
| + | MONSOONS: INDIA]] | ||
| + | [[Category:S&T|MMONSOONS: INDIAMONSOONS: INDIAMONSOONS: INDIAMONSOONS: INDIAMONSOONS: INDIAMONSOONS: INDIA | ||
| + | MONSOONS: INDIA]] | ||
=Monsoons in Chennai= | =Monsoons in Chennai= | ||
| Line 641: | Line 842: | ||
''Rain Chennai got from the Southwest monsoon, 2007-2018'' | ''Rain Chennai got from the Southwest monsoon, 2007-2018'' | ||
| + | |||
| + | [[Category:Climate/Meteorology|MMONSOONS: INDIAMONSOONS: INDIAMONSOONS: INDIAMONSOONS: INDIAMONSOONS: INDIA | ||
| + | MONSOONS: INDIA]] | ||
| + | [[Category:India|MMONSOONS: INDIAMONSOONS: INDIAMONSOONS: INDIAMONSOONS: INDIAMONSOONS: INDIA | ||
| + | MONSOONS: INDIA]] | ||
| + | [[Category:Pages with broken file links|MONSOONS: INDIAMONSOONS: INDIAMONSOONS: INDIAMONSOONS: INDIA | ||
| + | MONSOONS: INDIA]] | ||
| + | [[Category:S&T|MMONSOONS: INDIAMONSOONS: INDIAMONSOONS: INDIAMONSOONS: INDIAMONSOONS: INDIA | ||
| + | MONSOONS: INDIA]] | ||
=Monsoons in Delhi= | =Monsoons in Delhi= | ||
| Line 725: | Line 935: | ||
[[Category:S&T|MMONSOONS: INDIAMONSOONS: INDIAMONSOONS: INDIAMONSOONS: INDIA | [[Category:S&T|MMONSOONS: INDIAMONSOONS: INDIAMONSOONS: INDIAMONSOONS: INDIA | ||
| + | MONSOONS: INDIA]] | ||
| + | |||
| + | =Monsoons in Rajasthan= | ||
| + | ''' Average rainfall of the state:''' 450mm, 1975 to 2023 | ||
| + | |||
| + | ''' Some record years ''' | ||
| + | |||
| + | 811mm: in A.D. 1917 | ||
| + | |||
| + | 668mm: 2024, till Sept 14 | ||
| + | |||
| + | 664mm: 1975, June 1 to Sept 15 | ||
| + | |||
| + | [[Category:Climate/Meteorology|MMONSOONS: INDIAMONSOONS: INDIAMONSOONS: INDIAMONSOONS: INDIAMONSOONS: INDIAMONSOONS: INDIA | ||
| + | MONSOONS: INDIA]] | ||
| + | [[Category:India|MMONSOONS: INDIAMONSOONS: INDIAMONSOONS: INDIAMONSOONS: INDIAMONSOONS: INDIAMONSOONS: INDIA | ||
| + | MONSOONS: INDIA]] | ||
| + | [[Category:Pages with broken file links|MONSOONS: INDIAMONSOONS: INDIAMONSOONS: INDIAMONSOONS: INDIAMONSOONS: INDIA | ||
| + | MONSOONS: INDIA]] | ||
| + | [[Category:S&T|MMONSOONS: INDIAMONSOONS: INDIAMONSOONS: INDIAMONSOONS: INDIAMONSOONS: INDIAMONSOONS: INDIA | ||
MONSOONS: INDIA]] | MONSOONS: INDIA]] | ||
| Line 785: | Line 1,015: | ||
In 2009, the monsoon was weak and deficient but it caused floods, deaths and displacement in Orissa, Kerala, Karnataka, Gujarat and the north-eastern states. In 2008, the monsoon was normal, but Bihar faced the worst flood crisis ever as the Kosi breached its embankment, changed course and deluged several districts, leaving hundreds dead and three million homeless. | In 2009, the monsoon was weak and deficient but it caused floods, deaths and displacement in Orissa, Kerala, Karnataka, Gujarat and the north-eastern states. In 2008, the monsoon was normal, but Bihar faced the worst flood crisis ever as the Kosi breached its embankment, changed course and deluged several districts, leaving hundreds dead and three million homeless. | ||
| + | |||
| + | [[Category:Climate/Meteorology|MMONSOONS: INDIAMONSOONS: INDIAMONSOONS: INDIAMONSOONS: INDIAMONSOONS: INDIA | ||
| + | MONSOONS: INDIA]] | ||
| + | [[Category:India|MMONSOONS: INDIAMONSOONS: INDIAMONSOONS: INDIAMONSOONS: INDIAMONSOONS: INDIA | ||
| + | MONSOONS: INDIA]] | ||
| + | [[Category:Pages with broken file links|MONSOONS: INDIAMONSOONS: INDIAMONSOONS: INDIAMONSOONS: INDIA | ||
| + | MONSOONS: INDIA]] | ||
| + | [[Category:S&T|MMONSOONS: INDIAMONSOONS: INDIAMONSOONS: INDIAMONSOONS: INDIAMONSOONS: INDIA | ||
| + | MONSOONS: INDIA]] | ||
= ‘Normal’ monsoons= | = ‘Normal’ monsoons= | ||
| Line 1,050: | Line 1,289: | ||
MONSOONS: INDIA]] | MONSOONS: INDIA]] | ||
| − | = | + | =Retreat/ Withdrawal of monsoons= |
| + | ==North India== | ||
| + | ===2023: September 25=== | ||
| + | [https://timesofindia.indiatimes.com/india/monsoon-starts-retreat-rain-deficit-in-india-down-to-5/articleshow/103944406.cms TNN, Sep 26, 2023: ''The Times of India''] | ||
| + | |||
| + | |||
| + | NEW DELHI: Marking the beginning of its retreat from the country, the monsoon started withdrawing from parts of southwest Rajasthan, against its normal date of departure on September 17, the India Meteorological Department (IMD) said. The withdrawal began on a day when the overall monsoon deficit in the country further reduced to 5%, down from 11% in the first week of September. | ||
| + | |||
| + | The late retreat of the four-month long monsoon is the 13th consecutive delayed withdrawal. | ||
| + | |||
| + | It’s onset over Kerala this year happened on June 8, against the normal date of June 1. The monsoon season technically ends on September 30, but the withdrawal process normally continues till mid-October. | ||
| + | |||
| + | Although the retreat has begun, the monsoon rally continues in other parts. September has so far seen a 16% rainfall surplus in the country. | ||
| + | |||
| + | Announcing the beginning of its delayed withdrawal by eight days this year, the IMD noted that the withdrawal fulfilled all three required meteorological conditions such as no rainfall during the last five days in the region, formation of an anti-cyclonic circulation at lower tropospheric levels and dry weather conditions based on water vapour imagery. | ||
| + | |||
| + | Meanwhile, the Met department predicted sporadic light to moderate and heavy rainfall in different states till September 29 — the situation which may bring the overall monsoon closer to normal. The IMD had initially predicted a ‘normal’ monsoon this year at 96% of the long period average (LPA) with an error margin of +/- 4%. | ||
| + | |||
| + | It had, however, later indicated it to be ‘below normal’ (90-95% of the LPA) based on the huge monthly deficit of August. Monsoon rainfall between 96-104% of the LPA (average rainfall in the 1971-2020 period) is considered ‘normal’. | ||
| + | |||
| + | The monsoon, however, revived spectacularly in September, bringing the overall cumulative deficit from 11% early in the month to 5% on Monday. The revival is attributed to conditions in the Indian Ocean turning favourable (a positive Indian Ocean Dipole) and a favourable phase of Madden-Julian Oscillation (MJO) — an eastward moving pulse of cloud and rainfall near the equator — known for increasing convection in the Bay of Bengal and the Arabian Sea. | ||
| + | |||
==Delhi== | ==Delhi== | ||
===2010-19=== | ===2010-19=== | ||
| Line 1,125: | Line 1,385: | ||
Like this year, the withdrawal date in 2016 was also October 28 while 2000 and 2017 had seen it on October 25. Predicting weather conditions during next few days, the IMD said, “Scattered rainfall with moderate thunderstorm and lightning is very likely over Kerala, Maharashtra, Tamil Nadu and Puducherry during next five days with isolated heavy falls over south Tamil Nadu on October 29.” | Like this year, the withdrawal date in 2016 was also October 28 while 2000 and 2017 had seen it on October 25. Predicting weather conditions during next few days, the IMD said, “Scattered rainfall with moderate thunderstorm and lightning is very likely over Kerala, Maharashtra, Tamil Nadu and Puducherry during next five days with isolated heavy falls over south Tamil Nadu on October 29.” | ||
| − | [[Category:Climate/Meteorology|MMONSOONS: INDIAMONSOONS: INDIAMONSOONS: INDIA | + | ==2023: 4 days late== |
| + | [https://epaper.indiatimes.com/article-share?article=20_10_2023_016_012_cap_TOI Oct 20, 2023: ''The Times of India''] | ||
| + | |||
| + | |||
| + | New Delhi : The southwest (summer) monsoon withdrew completely from the country, four days after the normal date of October 15 and the northeast (winter) monsoon rainfall activity is likely to commence over the southern peninsular region in the next 72 hours, the India Meteorological Department said. | ||
| + | |||
| + |
The initial phase of the winter monsoon in general is, however, likely to be weak, added the Met department, even as it has already predicted overall ‘normal’ rainfall for winter monsoon in Peninsular India during October-December. Onset of summer monsoon over Kerala this year happened on June 8 against the normal date of June 1 whereas it had started withdrawing from northwest India on September 25, eight days after the normal date. | ||
| + | |||
| + |
Due to prevailing El Nino conditions (warming of sea surface temperatures in the central and eastern tropical Pacific Ocean that negatively impacts monsoon), the four-month summer monsoon (June-September) this year reported ‘below normal’ rainfall at 94.4% of the long period average (LPA). It was, however, very close to being categorised as ‘normal’ (which figues between 96-104% of the LPA). | ||
| + | |||
| + |
The summer monsoon hit the ‘below normal’ tag this year after reporting four consecutive years of good rainfall in either ‘normal’ or ‘above normal’ category during 2019-22. | ||
| + | |||
| + | [[Category:Climate/Meteorology|MMONSOONS: INDIAMONSOONS: INDIAMONSOONS: INDIAMONSOONS: INDIAMONSOONS: INDIA | ||
MONSOONS: INDIA]] | MONSOONS: INDIA]] | ||
| − | [[Category:India|MMONSOONS: INDIAMONSOONS: INDIAMONSOONS: INDIA | + | [[Category:India|MMONSOONS: INDIAMONSOONS: INDIAMONSOONS: INDIAMONSOONS: INDIAMONSOONS: INDIA |
MONSOONS: INDIA]] | MONSOONS: INDIA]] | ||
| − | [[Category:S&T|MMONSOONS: INDIAMONSOONS: INDIAMONSOONS: INDIA | + | [[Category:Pages with broken file links|MONSOONS: INDIAMONSOONS: INDIAMONSOONS: INDIAMONSOONS: INDIA |
| + | MONSOONS: INDIA]] | ||
| + | [[Category:S&T|MMONSOONS: INDIAMONSOONS: INDIAMONSOONS: INDIAMONSOONS: INDIAMONSOONS: INDIA | ||
MONSOONS: INDIA]] | MONSOONS: INDIA]] | ||
| Line 1,631: | Line 1,905: | ||
=2020= | =2020= | ||
[[File: Southwest monsoon (June- September 2020).jpg|Southwest monsoon (June- September 2020) <br/> From: [https://timesofindia.indiatimes.com/india/why-a-drier-monsoon-will-be-a-normal-monsoon/articleshow/90874445.cms April 17, 2022: ''The Times of India'']|frame|500px]] | [[File: Southwest monsoon (June- September 2020).jpg|Southwest monsoon (June- September 2020) <br/> From: [https://timesofindia.indiatimes.com/india/why-a-drier-monsoon-will-be-a-normal-monsoon/articleshow/90874445.cms April 17, 2022: ''The Times of India'']|frame|500px]] | ||
| − | |||
==June- Aug== | ==June- Aug== | ||
| Line 1,696: | Line 1,969: | ||
The 75 medium dams in the region were showing 31 TMC live storage (92%), whereas 752 minor dams were holding 47 TMC water (80%). A total of 38 barrages on different major rivers from Marathwada were showing 11 TMC water in total (94%). | The 75 medium dams in the region were showing 31 TMC live storage (92%), whereas 752 minor dams were holding 47 TMC water (80%). A total of 38 barrages on different major rivers from Marathwada were showing 11 TMC water in total (94%). | ||
| − | |||
| − | |||
| − | |||
| − | |||
| − | |||
| − | |||
| − | [[Category:Climate/Meteorology|MMONSOONS: INDIAMONSOONS: INDIAMONSOONS: INDIAMONSOONS: INDIAMONSOONS: INDIA | + | |
| + | [[Category:Climate/Meteorology|MMONSOONS: INDIAMONSOONS: INDIAMONSOONS: INDIAMONSOONS: INDIAMONSOONS: INDIAMONSOONS: INDIA | ||
MONSOONS: INDIA]] | MONSOONS: INDIA]] | ||
| − | [[Category:India|MMONSOONS: INDIAMONSOONS: INDIAMONSOONS: INDIAMONSOONS: INDIAMONSOONS: INDIA | + | [[Category:India|MMONSOONS: INDIAMONSOONS: INDIAMONSOONS: INDIAMONSOONS: INDIAMONSOONS: INDIAMONSOONS: INDIA |
MONSOONS: INDIA]] | MONSOONS: INDIA]] | ||
| − | [[Category:Pages with broken file links|MONSOONS: INDIAMONSOONS: INDIAMONSOONS: INDIAMONSOONS: INDIA | + | [[Category:Pages with broken file links|MONSOONS: INDIAMONSOONS: INDIAMONSOONS: INDIAMONSOONS: INDIAMONSOONS: INDIA |
MONSOONS: INDIA]] | MONSOONS: INDIA]] | ||
| − | [[Category:S&T|MMONSOONS: INDIAMONSOONS: INDIAMONSOONS: INDIAMONSOONS: INDIAMONSOONS: INDIA | + | [[Category:S&T|MMONSOONS: INDIAMONSOONS: INDIAMONSOONS: INDIAMONSOONS: INDIAMONSOONS: INDIAMONSOONS: INDIA |
MONSOONS: INDIA]] | MONSOONS: INDIA]] | ||
| − | [[Category:Climate/Meteorology|MMONSOONS: INDIAMONSOONS: INDIAMONSOONS: INDIAMONSOONS: INDIAMONSOONS: INDIA | + | =2023= |
| + | ==Overall performance== | ||
| + | ===In India=== | ||
| + | [https://timesofindia.indiatimes.com/india/breaking-4-year-trend-monsoon-ends-with-below-normal-rainfall/articleshow/104077297.cms Vishwa Mohan, Oct 1, 2023: ''The Times of India''] | ||
| + | |||
| + | [[File: The overall performance of the monsoon in 2023.jpg|The overall performance of the monsoon in 2023 <br/> From: [https://timesofindia.indiatimes.com/india/breaking-4-year-trend-monsoon-ends-with-below-normal-rainfall/articleshow/104077297.cms Vishwa Mohan, Oct 1, 2023: ''The Times of India'']|frame|500px]] | ||
| + | |||
| + | NEW DELHI: Breaking the four-year trend of good rainfall in either 'normal' or 'above normal' category during 2019-2022, India recorded ‘below normal’ monsoon rainfall at 94.4% of the long-period average, according to data for the June-September period released by the India Meteorological Department (IMD) on Saturday. The Met department, however, forecast 'normal' rainfall for winter monsoon in Peninsular India during October-December. | ||
| + | Rainfall in the range of 96-104 per cent of the long-period average (LPA) is considered normal. | ||
| + | |||
| + | |||
| + | Despite prevailingEl Nino conditions (warming of sea surface temperatures in the central and eastern tropical Pacific Ocean that impact monsoon negatively), the monsoon season ended with ‘close to normal’ rainfall."Effect of other meteorological factors reduced the impact of El Nino to an extent and it helped in taking the overall monsoon very close to normal, the way we had predicted it," said IMD Director General M Mohapatra. | ||
| + | |||
| + | The Met department had predicted a 'normal' monsoon this year at 96% of LPA with an error margin of +/- 4%. But huge deficit (36%) of August dragged the overall monsoon rainfall to 94.4% of LPA of 87 cm (based on data of 1971-2020). Around 73% of the total area in the country, however, received 'normal' rainfall and 9% got 'excess' rainfall. "We have been analysing what went wrong in August and sensitised all academic and research institutions to study it," said Mohapatra. | ||
| + | |||
| + | The IMD data show that not all El Nino years were bad monsoon years and that 40% of such years in the past received normal to above-normal monsoon rainfall. Out of 15 El Nino years during 1951-2022, there were six years with normal to above normal rainfall. El Nino years normally report higher than normal temperatures -- an indication that the winter this year may not be severe. | ||
| + | |||
| + | "It would, however, be premature to predict anything at this juncture. We will come out with the winter temperature outlook for December-February later," said Mohapatra. | ||
| + | |||
| + | Though June also reported a deficit of 9%, it was almost on the predicted lines. July and September were, on the other hand, good in terms of monsoon with 13% higher rainfall in both months. Good rainfall in July (main sowing season of Kharif crops) and overall normal rainfall in the monsoon core zone (rainfed areas) helped the Kharif sowing operations which finally ended with higher than normal (average of last five years) acreage and also higher than the sown area of last year. | ||
| + | |||
| + | The IMD's season-end report shows that out of the total 36 meteorological subdivisions, three constituting 9% of the total area of the country received excess rainfall , 26 subdivisions (73% of the total area) received normal and seven subdivisions (18% of the total area) received deficient rainfall during the season. | ||
| + | |||
| + | Kerala was the worst hit among those seven meteorological subdivisions which got deficient rainfall. Others were Nagaland, Manipur, Mizoram & Tripura (NMMT); Gangetic West Bengal, Jharkhand, Bihar, East Uttar Pradesh and South interior Karnataka. | ||
| + | |||
| + | Besides extreme variability, the monsoon this year was also marked by two major intense heavy rainfall spells over Himachal Pradesh -- July 6-15 and August 10-15 -- that caused extreme flooding during the period due to occurrence of mini cloudburts over the state. Some other parts of the country -- Chandigarh, Saurashtra, Konkan and Telangana -- too witnessed exceptionally heavy rainfall, mostly in July. | ||
| + | |||
| + | ===In Delhi=== | ||
| + | [https://timesofindia.indiatimes.com/city/delhi/for-10th-year-monsoon-decides-to-leave-delhi-after-staying-extra-days/articleshow/104074370.cms Priyangi Agarwal, Oct 1, 2023: ''The Times of India''] | ||
| + | |||
| + | [[File: Rainfall recorded in the monsoon season, 2010-23; Monsoon withdrawal date for Delhi, 2010- 23.jpg|Rainfall recorded in the monsoon season, 2010-23; Monsoon withdrawal date for Delhi, 2010- 23 <br/> From: [https://timesofindia.indiatimes.com/city/delhi/for-10th-year-monsoon-decides-to-leave-delhi-after-staying-extra-days/articleshow/104074370.cms Priyangi Agarwal, Oct 1, 2023: ''The Times of India'']|frame|500px]] | ||
| + | |||
| + | NEW DELHI: The southwest monsoon retreated from Delhi on Saturday after a delay of five days from the normal withdrawal date of September 25. For a decade now, the rain-bearing winds have withdrawn from Delhi late, according to India Meteorological Department’s data. Safdarjung, which is the city’s base weather station, logged 660.8mm of rainfall in the monsoon season from June to September against the normal average of 640.4mm. | ||
| + | |||
| + | “The southwest monsoon has withdrawn from some parts of Jammu-Kashmir, Himachal Pradesh and Uttarakhand, entire Punjab and Haryana-Chandigarh-Delhi, some parts of west Uttar Pradesh, west Madhya Pradesh and east Rajasthan and some more parts of west Rajasthan on Sunday,” said IMD in its bulletin on Saturday. | ||
| + | |||
| + | IMD’s data shows that of the total rainfall reported during the monsoon season, more than half the precipitation was recorded in July at 384.6mm with a monthly excess of 83%. June also had excess rain of 37% with Safdarjung logging 101.7mm rainfall against the normal of 74.1mm. | ||
| + | |||
| + | In contrast, August received 91.8mm of rainfall against the month’s normal of 233.1mm, thus bing the second driest in 14years with a rain deficit of 61%. September received 82.7mm rainfall, a deficit of 33%. It is the lowest rainfall recorded in September at Safdarjung in the past three years. | ||
| + | |||
| + | Met officials said that since the monsoon trough had moved away from Delhi in the past two months, the city received scanty rainfall. “In August and September, the monsoon trough shifted from its normal position. On most days, it skirted Delhi and the city was unable to meet its normal precipitation mark,” said a Met official. | ||
| + | |||
| + | However, the total rainfall logged in this monsoon season was higher than last year. Safdarjung recorded 516.9mm rainfall during the monsoon in 2022. However, 2021 was the wettest monsoon since 1964 as Safdarjung logged 1,176.4mm of rainfall. | ||
| + | |||
| + | Met department’s data shows that the rains withdrew on September 29 in 2022 and October 8 in 2021. The earlier normal withdrawal date for monsoon for the city was September 22, but it was revised to September 25 from 2021 onwards. The normal date of monsoon withdrawal was revised based on long period average data based on 1971-2019. | ||
| + | |||
| + | While the rains withdrew from the city after a delay of five days, the monsoon arrived early this year in Delhi on June 25, two days before its normal onset date. | ||
| + | |||
| + | IMD’s forecast says that the day temperature is likely to hover at 35-36 degrees Celsius for the next seven days. | ||
| + | |||
| + | =2024= | ||
| + | ==Overall performance== | ||
| + | ===In India, July August=== | ||
| + | [[File: Monsoon 2024, Overall performance In India, July Aug.jpg|Monsoon 2024: Overall performance In India, July Aug <br/> From: [https://epaper.indiatimes.com/article-share?article=31_08_2024_012_003_cap_TOI August 31, 2024: ''The Times of India'']|frame|500px]] | ||
| + | |||
| + | '''See graphic''': | ||
| + | |||
| + | '' Monsoon 2024: Overall performance In India, July August '' | ||
| + | |||
| + | ===Districts, the driest and Wettest=== | ||
| + | [[File: Monsoon 2024, the driest and Wettest districts In India, July Aug.jpg|Monsoon 2024: the driest and Wettest districts In India, July Aug <br/> From: [https://epaper.indiatimes.com/article-share?article=01_09_2024_015_006_cap_TOI Sep 1, 2024: ''The Times of India'']|frame|500px]] | ||
| + | |||
| + | |||
| + | '''See graphic''': | ||
| + | |||
| + | '' Monsoon 2024: the driest and Wettest districts In India, July August '' | ||
| + | |||
| + | ==State-wise== | ||
| + | [[File: Monsoon 2024, India, July August, rainfall in some states.jpg| Monsoon 2024, India, July Aug: rainfall in some states <br/> From: [https://epaper.indiatimes.com/article-share?article=02_09_2024_011_005_cap_TOI Sep 2, 2024: ''The Times of India'']|frame|500px]] | ||
| + | |||
| + | '''See graphic''': | ||
| + | |||
| + | '' Monsoon 2024, India, July Aug: rainfall in some states '' | ||
| + | |||
| + | ===State-wise II=== | ||
| + | [[File: Monsoon 2024, India, July August, Deficit and excess rainfall in some states.jpg| Monsoon 2024, India, July Aug: Deficit and excess rainfall in some states <br/> From: [https://epaper.indiatimes.com/article-share?article=03_09_2024_009_013_cap_TOI Sep 3, 2024: ''The Times of India'']|frame|500px]] | ||
| + | |||
| + | '''See graphic''': | ||
| + | |||
| + | '' Monsoon 2024, India, July Aug: Deficit and excess rainfall in some states '' | ||
| + | |||
| + | [[Category:Climate/Meteorology|MMONSOONS: INDIAMONSOONS: INDIAMONSOONS: INDIAMONSOONS: INDIAMONSOONS: INDIAMONSOONS: INDIA | ||
MONSOONS: INDIA]] | MONSOONS: INDIA]] | ||
| − | [[Category:India|MMONSOONS: INDIAMONSOONS: INDIAMONSOONS: INDIAMONSOONS: INDIAMONSOONS: INDIA | + | [[Category:India|MMONSOONS: INDIAMONSOONS: INDIAMONSOONS: INDIAMONSOONS: INDIAMONSOONS: INDIAMONSOONS: INDIA |
MONSOONS: INDIA]] | MONSOONS: INDIA]] | ||
| − | [[Category:Pages with broken file links|MONSOONS: INDIAMONSOONS: INDIAMONSOONS: INDIAMONSOONS: INDIA | + | [[Category:Pages with broken file links|MONSOONS: INDIAMONSOONS: INDIAMONSOONS: INDIAMONSOONS: INDIAMONSOONS: INDIA |
MONSOONS: INDIA]] | MONSOONS: INDIA]] | ||
| − | [[Category:S&T|MMONSOONS: INDIAMONSOONS: INDIAMONSOONS: INDIAMONSOONS: INDIAMONSOONS: INDIA | + | [[Category:S&T|MMONSOONS: INDIAMONSOONS: INDIAMONSOONS: INDIAMONSOONS: INDIAMONSOONS: INDIAMONSOONS: INDIA |
MONSOONS: INDIA]] | MONSOONS: INDIA]] | ||
| Line 1,752: | Line 2,101: | ||
MONSOONS: INDIA]] | MONSOONS: INDIA]] | ||
[[Category:S&T|MMONSOONS: INDIAMONSOONS: INDIAMONSOONS: INDIAMONSOONS: INDIA | [[Category:S&T|MMONSOONS: INDIAMONSOONS: INDIAMONSOONS: INDIAMONSOONS: INDIA | ||
| + | MONSOONS: INDIA]] | ||
| + | |||
| + | [[Category:Climate/Meteorology|MMONSOONS: INDIAMONSOONS: INDIAMONSOONS: INDIAMONSOONS: INDIAMONSOONS: INDIA | ||
| + | MONSOONS: INDIA]] | ||
| + | [[Category:India|MMONSOONS: INDIAMONSOONS: INDIAMONSOONS: INDIAMONSOONS: INDIAMONSOONS: INDIA | ||
| + | MONSOONS: INDIA]] | ||
| + | [[Category:Pages with broken file links|MONSOONS: INDIAMONSOONS: INDIAMONSOONS: INDIAMONSOONS: INDIA | ||
| + | MONSOONS: INDIA]] | ||
| + | [[Category:S&T|MMONSOONS: INDIAMONSOONS: INDIAMONSOONS: INDIAMONSOONS: INDIAMONSOONS: INDIA | ||
MONSOONS: INDIA]] | MONSOONS: INDIA]] | ||
Revision as of 20:09, 26 October 2024
This is a collection of articles archived for the excellence of their content. the Facebook community, Indpaedia.com. All information used will be acknowledged in your name. |
In three sentences
The four-month monsoon [rainy] season normally begins from June 1 and ends on September 30. The Southwest Monsoon gives 70 per cent (of the entire year's) rains to the country, where agriculture still remains a major contributor to the GDP. June contributes 17% of the total rainfall, July 32%, August 28% and September 23%. (From PTI)
And three more sentences:
How long was the monsoon break in June, during the period 2010 to 2018?
2010: It was a 13-day break, the longest in June in the years 2010-18
2018: The monsoon did not move for 9 days after June 13.
And one more important fact:
India's Long Period Average rainfall is 880mm (1961- 2010).
A backgrounder

From: April 17, 2022: The Times of India
The overall picture
Monsoon usually reaches India's mainland by first week of June, May 29 2017: The Times of India
What causes monsoon?
Monsoon, which is the seasonal reversal in the wind direction, causes most of the rainfall received in India and some other parts of the world. The primary cause of monsoons is the difference between annual temperature trends over land and sea. The apparent position of Sun with reference to earth is not fixed -it oscillates from tropic of cancer to Capricorn through the equator. The heating leads to the creation of a low pressure region. The northeast and southeast trade winds converge in this low pressure zone which is also known as the Intertropical Convergence Zone (ITCZ). This low pressure region witnesses continuous rise of the moist wind from the sea surface to the upper layers of atmosphere, where the cooling causes the loss of moisture resulting into precipitation. It is observed that the rainy season of east Asia, Sub Saharan Africa, Australia and southern parts of North America coincides with the shift of the ITCZ towards these regions.
What causes Indian monsoon?
Thar Desert and adjoining areas of the northern and central Indian Subcontinent heats up during the hot seasons of sum mer. Because of the rapid solar heating mainly between April and May a lowpressure cell is created over the Indian subcontinent. To fill up this void, the moisture-laden winds from the Indian Ocean rush in to the subcontinent. The ITCZ, which is sometimes also referred as monsoon trough also shifts northwards towards the subcontinent causing monsoon rains which typically reaches subcontinent's mainland in the last week of May or the first week of June. The metdepartment declares the onset of monsoon over Kerala if 60% of the 14 enlisted stations falling in the states report a rainfall of 2.5mm or more for any two consec ll of 2.5mm or more for any two consec utive days falling after 10 May.
What are the ways to forecast monsoon?
Generally there are three main approaches used for long range forecast of the southwest monsoon in India. The first is the statistical method which uses the historical relationships between southwest monsoon and various global weath er parameters. The historical data is then used to forecast the onset of the monsoon.The second approach is the empirical method which uses time series analysis of past rainfall data. The third is the dynamical method which uses general circula tion models of atmosphere and oceans to predict the southwest monsoons. It is observed that the prediction models based on statistical approach have so far yielded most accurate results for the Indian monsoon. However none of the models can claim 100% accuracy because there are several factors like the correlations between the parameters, changing predictability of the model over a period of time.
Which method is used by our met-department to forecast monsoon?
Prior to 2002 IMD used to issue annual forecast using a model based on 16 parameter but it failed in 2002. Since 2003 two new models were introduced which instead of 16 used 8 and 10 parameters to forecast the southwest monsoon in India. Apart from this a two stage forecast system was also introduced--the first stage forecast was issued in mid April and an update or second stage by the end of June. This model also gave false predictions for 2004. Since 2007 a new forecast system using ensemble technique is being used to forecast monsoon. At present monsoon is predicted on the basis of five predictors including the sea surface temperature (SST) gradient between north Atlantic and north Pacific, Equatorial South Indian Ocean SST, East Asia Mean Sea Level Pressure, Northwest Europe Land Surface Air Temperature and Equatorial Pacific Warm Water Volume at designated times of the year. Instead of relying on one model with best possible forecast, the ensemble method uses inputs from the forecast of all models to calculate the final result.
Steven Clemens’ research
June 19, 2021: The Times of India

From: June 19, 2021: The Times of India
Steven Clemens teaches earth, environmental and planetary sciences at Brown University. Speaking to Srijana Mitra Das at Times Evoke, Clemens discusses how a monsoon is made, the impacts of global warming on the rain — and why India’s monsoon is special:
What is the core of your research?
We look at ocean sediments that build up on the seafloor over time and examine their chemical, physical, isotopic and biological properties. Through these, we reconstruct changes in monsoon winds and rainfall across time.
Studying the monsoon is important because it’s one of the largest expressions of the movement of water and energy in the atmosphere on Earth. It is responsible for much of the rainfall that tropical and subtropical continental interiors receive and it’s shaped by very powerful meteorological, environmental and climatic drivers.
How is a monsoon actually made?
The location or the latitude and longitude of Africa, India and parts of Asia conspire such that when summer begins, these continental interiors start to heat up quite strongly. That creates low density air along the surface of these continents. This moves upwards into the atmosphere and creates a vacuum. This draws air masses inwards from the ocean into India.
Surface air masses are one reason why the South Asian monsoon is so strong — the unique geography of the Indo-Asian landmass confines and intensifies the circulation of these air masses, which further power the monsoon. With the Indian monsoon, the air masses originate in the southern hemisphere of the ocean and then, the vacuum pulls these up across the equator, into the Arabian Sea, where these air masses curve to the right into India. It thus draws a tremendous amount of moisture and energy from the southern hemisphere into Asia — that’s a unique component of monsoonal circulation in India, not shared by any other monsoon in the world.
What is the role of the Indian Ocean?
The Indian Ocean is absolutely central — most of the monsoon’s energy that’s released over India comes from the ocean. It’s extracted out of the waters and hidden in the atmosphere as latent heat. It’s expressed only when that moisture condenses and causes rainfall.
Are rising Co2 levels impacting this?
Numerous models find that increased Co2 levels will result in a warmer planet — this means more moisture in the atmosphere, which will cause increased rainfall in the South Asian monsoon. We have tested these predictions using sediment records off the coast of India and we’ve verified that indeed, with future Co2 increases caused by anthropogenic or human action, there will be more intense monsoon rain.
Importantly, there are two opposing forces at play here. Anthropogenic aerosols in the atmosphere over India decrease moisture and reduce the Indian monsoon’s strength. But alongside, rising Co2 is intensifying the monsoon. So, we have two forces pulling at opposite climatic ends. But I would predict increases in monsoonal rain in terms of mean annual rainfall levels.
Does solar radiation affect the monsoon?
Yes but in a different timescale. We examine changes in rainfall from 20,000 to 1,00,000-year cycles. In these timescales, there is a lot of variability associated with changes in Earth’s orbit and how much solar radiation comes into the system. Earth has three components of orbital-scale variants — the circularity of Earth’s orbit, the spin axis or tilt of the planet and the precision of that spin axis with respect to the sun, stars and the equatorial plane. All three change over time and alter the amount of solar radiation coming to a specific latitude by upto 12% even, which is a lot.
Such orbital scale variability becomes a huge driver of change in monsoon patterns over long timescales. In the short term, changes in solar exposure play a role in warming up the landmass — that’s how monsoon circulation is initiated. But other factors drive how strong or weak the monsoon is each year.
What are some of these factors?
Most weakened monsoons in India are associated with El Nino events or condensation being drawn away to the equatorial Pacific Ocean, with consequent effects on the Indian monsoon. Another factor is the Indian Ocean dipole or a difference in sea surface temperatures between opposite poles or parts of the ocean. A positive dipole phase means warmer sea temperatures in the western Indian Ocean, and cooler temperatures in the east. This has been causing high rainfall and floods in east Africa and droughts and heatwaves in Australia. With increased Co2 levels, temperature and circulation in the equatorial Pacific and Indian Ocean will have an even stronger impact on monsoons everywhere.
Can you tell us about monsoons in other places?
I’ll share a story. Some years ago, several scientists were at a seminar discussing the American monsoon. An Indian academic suddenly remarked, ‘You know, I work on the North American monsoon but I’m from India — now that really is a monsoon!’ This observation stayed with me. If you define a monsoon as the seasonal change in wind direction and rainfall, then there are monsoons all over tropical and subtropical areas. Even the south-west United States has a monsoon in this context, as do South America and Australia.
The monsoons are global but India’s monsoon is truly incredible — it is one of the most unique systems on Earth in terms of its energy, its intricate natural systems and its interrelationship with human society.
Kaustubh Thirumalai’s study
June 20, 2021: The Times of India
Million-year study shows warming will make Indian monsoons more extreme
Climate models have predicted that global warming will make monsoons in India wetter and more unpredictable. Now, a major new study has literally dug up evidence of South Asian monsoon’s behaviour over the last million years (during the Pleistocene, or ice age), using mud samples drilled from the Bay of Bengal bed to show that periods of rise in greenhouse gases and ice-sheet melts had indeed coincided with increased rainfall over the subcontinent in the past. Kaustubh Thirumalai, a 33-year-old geoscientist at the University of Arizona who co-authored the study, talks to Amit Bhattacharya about the study’s implications for India’s rainy seasons in a warming world and his personal journey
What does this study of a million monsoon years tell us about the southwest monsoon system and its drivers during the Ice Age, which spanned over a million years?
Our study reconstructs Indian monsoon variability over the past million years using marine sediments from the northwest Bay of Bengal. Across this period of Earth’s history, global climate fluctuated between cold glacial states with extensive northern hemisphere ice-sheets, and warm interglacial states, such as the last 11,000 years, which coincided with the advent of agriculture. Linked to oscillations in Earth’s orbit, these ice age cycles were amplified by greenhouse gases and provide a clear testbed to understand how regional variability, including weather systems, respond to climate forcing and to changes in global temperatures over long timescales (multiple decades to centuries). Contrary to previous assertions that the southwest monsoon was only sensitive to summer solar radiation across this period, our results point to a dominant role for greenhouse gases and ice-sheet melt in shaping Pleistocene monsoon dynamics.
As a sedimentologist in the group, you helped analyse “tens of kilometres” of sediments brought up from the sea bed. How do core samples drilled from the bed of the Bay of Bengal reveal the story of the monsoons in the distant past? How were the samples collected?
Bay of Bengal seafloor sediments preserve a rich history of deposits of sediments from the Indian landmass via runoff from the world’s most powerful river systems, and also serve as an archive for microfossil shells and biomarkers of organisms that once lived at the surface of the ocean. These long-dead organisms carry within them the imprint of the monsoon in their lifespans, as an intense monsoon year leads to more freshwater flowing into the Bay of Bengal, which reduces salinity at the sea surface. The sediment cores were drilled in the Mahanadi Basin, northwest Bay of Bengal, from November 2014 to January 2015 by the JOIDES Resolution drilling vessel of the International Ocean Discovery Program — an intergovernmental organisation of which India is a key member as well. The ministry of earth sciences and IODP supported and collaborated in obtaining these samples of exceedingly high scientific value. The lead author, Steve Clemens, was also chief scientist on our expedition and has been working towards these scientific objectives for more than a decade.
Kerala and the monsoon
Sudha Nambudiri, May 18, 2021: The Times of India
Infographics and lead: Sajeev Kumarapuram
As the rest of the country reels from the blistering heat, the southern state of Kerala is transitioning from a summer month to a pre-monsoon one, when the skies cloud up and the air smells of impending rain.
Most Keralites know that if it’s hot and sultry outside, even for a week, the clouds will soon give way to showers, bringing down the mercury levels. While the southwest monsoon is still far-off for the rest of the country, the Indian meteorological department (IMD), the country’s official weather agency, indicates a near normal or above normal rainfall this time around, news that has been greeted with much enthusiasm by the local fishermen and farming community.
For Kerala, which is the entry point to the Indian summer monsoon, the indications usually begin by May and June 1 is almost always the declared date of its arrival.
This, of course, varies depending on the ocean-atmospheric conditions in May. Interestingly, even though IMD has announced varying dates this year for when the monsoon will hit most states – which depends on 70 per cent of its rainfall from it – it is still June 1 for Kerala. Till 2005, the IMD would calculate the daily rainfall from seven monitoring stations in Kerala to declare the onset of monsoon. From 2006, however, a new criterion was devised, based on the daily rainfall in 14 stations across Kerala and neighbouring areas, along with measuring the wind field and the outgoing long-wave radiation (OLR) over southeast Arabian Sea.
The first alert comes almost ten days before, when the clouds swelled with rain make their presence felt in the Andaman sea. This is when the IMD issues an approximate date for its arrival. The monsoon winds then continue to cover the rest of the country, from south to north, and from east to west, by July 15, and by September 1, it slowly starts withdrawing.
In the earlier decades, the monsoon would hit Thiruvananthapuram and Kollam waters first, accompanied by strong winds and heavy rainfall for three-four days, before June 1. Coasts would be cleared and beaches would be closed in those regions as the state would prepare for the monsoon. But today records show it has moved upwards to Kochi and central Kerala.
In its report, “Observed rainfall variability and changes over Kerala state”, the IMD climate research centre has found changes in the monsoon patterns in the 30 years from 1989-2018. It also notes that Kerala receives its highest rainfall in July (32.9 per cent) followed by June.
“The most notable change in the behaviour of the Indian summer monsoon is that there is a significant rise in heavy rains along with a steady decline in total monsoon rainfall. Basically, rainfall patterns have changed, and we are having longer dry spells with intermittent heavy rainfall events,” said Roxy Mathew Koll, senior scientist, centre for climate change research (CCCR), Indian Institute of Tropical Meteorology, Pune. “We find that this is due to rapid ocean warming that makes the monsoon circulation erratic.”
In recent years, monsoon trackers have been noting that the beginning of the monsoon is generally weak, but gradually picks up. Also, cyclonic systems forming in the Arabian Sea or the Bay of Bengal late May or early June are considerably affecting the monsoon circulation as well as the rainfall pattern.
“Arabian Sea has been witnessing the formation of cyclones along with the monsoon onset in Kerala,” said S Abhilash, associate professor, Advanced Centre for Atmospheric Radar Research (ACARR), Cochin University. “They disturb the basic monsoon state and, depending on the region of its formation, it can adversely affect the further northward progression of monsoon. Alternatively, when the cyclones form very close to the west coast and move parallel to it, they also help in the fast propagation of monsoon current Northwards.”
While scientists refuse to pin down the reason behind the change in the rainfall patterns, they admit to recording changes annually and seasonally too. “The variability has increased in the recent years,” added Abhilash. “For example, Kerala has witnessed occurrences of intense droughts (2015 and 2016) and floods (2018 and 2019) in the last 10 years. Even in intensity, extreme rain events have increased. Heavy rain days are increasing and light to moderate rainy days are decreasing. For example, a large rainfall deficit of 30 per cent is compensated in one or two intense heavy spells.”
While climate change is being pointed to as an indicator of these trends, scientists have been saying that changes in land use have contributed to the disruptions in natural systems. These land use changes become catastrophic in areas that are susceptible to natural hazards like landslides and floods.
“Kerala, which sees tropical monsoonal climate, and is sandwiched between the towering Western Ghats and the Arabian Sea, has three physiographic stretches viz, the coastal plains, the midlands and the highlands. Midlands, being a huge potential area for cash crops like rubber, population pressure, increased toward mountainous regions and coastal plains,” said Sajin Kumar K.S, adjunct assistant professor, department of Geological & Mining Engineering & Sciences, Michigan technological university. “These two physiographic regions are susceptible to landslides and floods, respectively. Hence any shifts in the natural vegetation in these regions will see catastrophic natural hazards similar to what occurred in 2018.”
The first alert comes almost ten days before the actual onset, when the clouds swelled with rain makes its presence felt in the Andaman sea According to him, a correlation of the land use of the Western Ghats part of Kerala, between 1973 and 2020, reveals that there is a shift in land use patterns, showing mainly a decrease in dense forest whereas increase in built-up areas. “Built-up area have shown a steep growth of approximately 300 per cent, and this could be at the expense of mixed vegetation, a common type of land use pattern seen in and around the households of Kerala,” he said.
Research also shows a threefold rise in heavy rains over the west coast and central/north India. “Climate change projections indicate that the number and intensity of heavy rains will continue to increase as manmade emissions continue unabated,” said Roxy Mathew Koll. “We need to utilise our monitoring and early warning systems efficiently so that we can take advance precautions and mitigate their impacts.”
History
‘Indian monsoon system 27 million years old’
Rohan Dua, February 20, 2021: The Times of India
For decades, the evolution of the Indian monsoon has not been entirely understood. Nor have scientists decoded how it intensified and how it has varied with time. By analysing sediment from the Bay of Bengal, researchers have found that the present Indian monsoon system goes back at least 27 million years.
“Previous studies only went as far back as 12 million years. They used wind and vegetation data, but that would not paint a clear picture of monsoon intensity,” corresponding author Sajid Ali from the Birbal Sahni Institute of Palaeontology in Lucknow told TOI. “We analysed sediment from the Bay of Bengal. Change in sediment is directly linked to change in monsoon … The presence of minerals depends on the intensity of monsoon. Different minerals are formed when the monsoon is strong and others when it is weak.”
For the study, to be published in Wiley journal ‘Paleoceanography and Paleoclimatology’, they collected 38 sediment samples under Japan’s International Ocean Discovery Program.
When they studied nano fossils (plankton which are one thousand millionth of a metre) from the bottom of the sediment deposits, “those were found to be 27 million years old,” Ali explained.
Storms and monsoons
1955-2014
Sudha Nambudiri, May 17, 2021: The Times of India

From: Sudha Nambudiri, May 17, 2021: The Times of India

From: Sudha Nambudiri, May 17, 2021: The Times of India
Infographics and lead by Sajeev Kumarapuram
“Cyclones draw their energy from the warm ocean waters below. Now with rapid ocean warming, the Arabian Sea has also become fertile like the Bay of Bengal, supporting intense cyclone formation,” said Roxy Mathew Koll, senior scientist, centre for climate change research (CCCR), Indian institute of tropical meteorology-Pune. “These cyclones interact with the monsoon system, based on where they form and what track they follow. In 2020, Cyclone Amphan formed prior to the onset of monsoon and moved towards the north Bay of Bengal. This took away the moisture and rains that should have reached peninsular India, delaying the progress of the monsoon. Cyclone Amphan was followed by Cyclone Nisarga, which moved towards the Maharashtra coast. This pulled the monsoon also inland, and most of the regions north of peninsular India got an early monsoon onset.”
A study by researchers of the Cochin university of science and technology (CUSAT), covering 60 years from 1955 to 2014, shows that the number of cyclones in the Bay of Bengal has been decreasing every 20 years. The team divided the entire study period into three sets, or “epochs” as they like to call it – the early (1955−74), middle (1975−94) and recent (1995−2014) epochs. Over the Arabian Sea, however, there is a decrease in the early epoch, before then reaching a minimum in the middle epoch, followed by an increase in the recent epoch, indicating a clear variation in the pattern.
“In the last five years, we have had a couple of instances of cyclones affecting monsoon progress. In 2015, cyclone Ashobha arrived between June 8-11, and that year, the monsoon propagated fast. In 2018, there were two cyclones, Sagar and Mekunu, in May,” said S Abhilash, associate professor, Advanced Centre for Atmospheric Radar Research (ACAAR), Cochin university. “Though the monsoon had arrived, further progression was halted for a week. The next year, in 2019, cyclones Vayu from June 10-13 took away the moisture, which affected monsoon progression negatively. All these are Arabian Sea systems. However, most Bay of Bengal systems which formed in May have helped the monsoon for normal onset and further progress.”
Factors that influence the monsoons
Air pollution
Neha Madaan, April 28, 2023: The Times of India
Pune: Air pollution and a rise in west Pacific tropical cyclones have played their parts in weakening the Indian monsoon the past few decades, according to a study by researchers from Indian Institute of Tropical Meteorology in Pune.
The researchers held that greenhouse gas emissions and other human activities can significantly alter the pattern of monsoon flow over the tropical Indo-Pacific Oceans and lead to an increase in tropical cyclones over the west Pacific. Higher frequency of tropical Pacific cyclones can cause a weakening of the monsoon, as it is associated with moisture depletion over India. “Monsoon in India depends on low-level moisture transport from the Indian Ocean towards the Indian landmass. This flow tends to weaken due to human-induced pollution as per our model simulations,” said Dr TP Sabin, a senior IITM scientist. The study was led by Dr R Krishnan, director of the institute.
“Human-induced climate drivers, particularly greenhouse gases and aerosols, can impact precipitation patterns over the Asian monsoon region. While the increase in greenhouse gases can intensify rainfall, aerosol emissions (minute suspended pollutant particles) exert the opposite influence,” Sabin said. The scientist explained that high levels of aerosol in the atmosphere can deflect the sun’s heat back into space rather than warming the earth’s surface. “This leads to a decrease in temperatures on the earth’s surface and reduces rainfall,” he said. The study found that aerosol emissions in the northern hemisphere have contributed to a decline in monsoon rainover India.
Dust, soot from West Asia affect monsoon in India
Summary
Dust & soot from West Asia affect monsoon in India, November 16, 2018: The Times of India
Dust and soot transported from the deserts of the Middle East settle on the snow cover of the Himalaya mountain range and affect the intensity of the summer monsoon in India, a study has found.
Using a powerful Nasadeveloped atmospheric model, researchers from University of Maryland in the US found that large quantities of dark aerosols — airborne particles such as dust and soot that absorb sunlight — settle on top of the Tibetan Plateau’s snowpack in spring before the monsoons begin.
These dark aerosols cause the snow to absorb more sunlight and melt more quickly. The findings suggest that, among these dark aerosols, windblown dust from the Middle East has the most powerful snow-darkening effect.
In years with heavy springtime dust deposition, the end result is reduced snow cover across the Tibetan Plateau, which leads to warmer temperatures on the ground and in the air above it.
Hundreds of studies have supported this relationship since British meteorologist Henry Blanford noted a connection between springtime Himalaya snow cover and the intensity of Indian monsoons. However, they have struggled to explain the reason for the same.
Researchers used the Goddard Earth Observing System Model to simulate 100 years’ worth of springtime snow cover and its influence on the yearly summer monsoon cycle. To test the effect of dust blown in from the Middle East, the researchers ran the same simulations again, with an added software package that incorporates the snowdarkening effects of dark aerosols deposited atop the Tibetan Plateau.
Adding dark aerosol deposition to the model substantially increased the amount of sunlight absorbed by the snow, accelerating the rate of melting. This is because when snow melts, it begins to expose the darker ground underneath, which absorbs even more sunlight and intensifies the rate of melting.
Researchers also found that the strongest effect in cycles when a large amount of dust settled on the snowpack in April, May and June.
Details
November 14, 2018: Science Daily
Source: University of Maryland
Middle Eastern desert dust on the Tibetan plateau could affect the Indian summer monsoon: New atmospheric modeling study could explain the mechanism behind a century-old hypothesis
New research led by William Lau, a research scientist at the University of Maryland's Earth System Science Interdisciplinary Center (ESSIC), provides a plausible mechanism to explain Blanford's observations. Surprisingly, the explanation involves dust transported from the deserts of the Middle East, more than a thousand miles away.
Using a powerful NASA-developed atmospheric model, Lau found that large quantities of dark aerosols -- airborne particles such as dust and soot that absorb sunlight -- settle on top of the Tibetan Plateau's snowpack in spring before the monsoons begin. These dark aerosols cause the snow to absorb more sunlight and melt more quickly. The model findings suggest that, among these dark aerosols, windblown dust from the Middle East has the most powerful snow-darkening effect.
In years with heavy springtime dust deposition, the end result is reduced snow cover across the Tibetan Plateau, which leads to warmer temperatures on the ground and in the air above it. This in turn sets off a series of interconnected feedback loops that intensify India's summer monsoon. A paper describing the research, co-authored by Kyu-Myung Kim of NASA's Goddard Space Flight Center, was published online November 12, 2018 in the journal Atmosphere.
"Blanford knew that snow cover on the Tibetan Plateau wasn't the only phenomenon that influenced the monsoon, but he knew it was important," Lau said. "The relationship between snow cover and the monsoon is useful enough that the India Meteorological Department still uses it to develop its annual summer monsoon forecast. By adding knowledge of the physical mechanism responsible for this relationship, our study may help to develop more accurate monsoon forecasts."
Lau and Kim used the Goddard Earth Observing System Model, Version 5 (GEOS-5) to simulate 100 years' worth of springtime snow cover and its influence on the yearly summer monsoon cycle. To test the effect of dust blown in from the Middle East, the researchers ran the same simulations again, with an added software package that incorporates the snow-darkening effects of dust, soot and other dark aerosols deposited atop the Tibetan Plateau.
Adding dark aerosol deposition to the model substantially increased the amount of sunlight absorbed by the snow, accelerating the rate of melting. This is because when snow melts, it begins to expose the darker ground underneath, which absorbs even more sunlight and intensifies the rate of melting.
In addition to darkening the snow early in the season, the dust also strongly enhanced atmospheric warming of the Tibetan Plateau, leading to changes in wind patterns that intensify the peak monsoon. Notably, this series of feedbacks also strengthened the same winds that transport dust from the Middle Eastern deserts, bringing more dust and further enhancing the feedback loop.
According to Lau, many researchers contend that heavy monsoon rains should wash any airborne dust particles from the air, canceling out the dust's atmospheric heating effects and shutting down the feedback loop. But Lau and Kim's results suggest that enhanced winds transport enough dust to overwhelm this washout effect, leading to a net accumulation of dust on the Tibetan Plateau.
The timing of the dust's arrival was also important. Lau and Kim found the strongest effect in cycles when a large amount of dust settled on the snowpack in April, May and June.
"Every year was different in the model results. When dust arrived early in the season, it set up the initial conditions needed to change the monsoon dynamics," Lau said. "But in some years, late-season snowstorms at high altitudes covered the dust and shut down the feedback loop. It's very clear that there is a relationship between snow darkening by aerosols -- particularly Middle Eastern desert dust -- and the Indian monsoon season."
Lau and Kim acknowledge the need to move beyond modeling and investigate the connections between dark aerosols, heating and the monsoon cycle using other methods and new observations. But they are confident that their results -- which used real-world data to seed the GEOS-5 model -- could help inform monsoon prediction efforts now.
"This could be extremely important for agriculture. Farmers have to plan around the monsoon season to decide when to plant and when to harvest," Lau said. "In order to understand how human influences like climate change and land use affect the monsoon, we have to understand the basics -- including the effects of light-absorbing aerosols in darkening the snow on the Tibetan Plateau and in modulating the Asian summer monsoon. Such effects are so important that in the end, we may have to rewrite the curriculum for 'Monsoon 101.'"
Materials provided by University of Maryland. Note: Content may be edited for style and length.
Criteria used in deciding whether monsoon has arrived
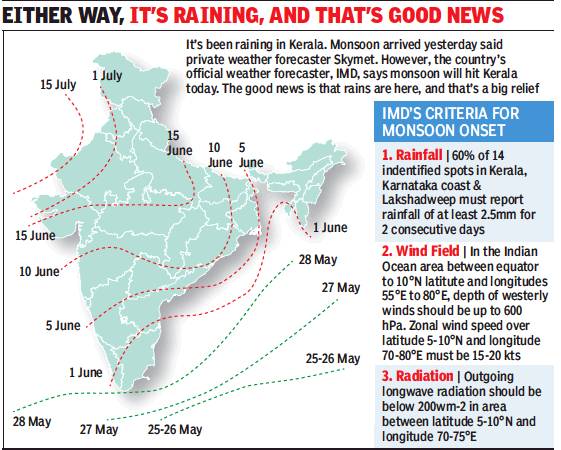
i) The criteria that IMD adopts to decide whether monsoon has arrived or not.
ii)The dates on which the monsoon normally reaches various parts of India. From The Times of India
See graphic, ' i) The criteria that IMD adopts to decide whether monsoon has arrived or not.
ii)The dates on which the monsoon normally reaches various parts of India. ',
The amount of rainfall
Average rainfall
1929 – 2023
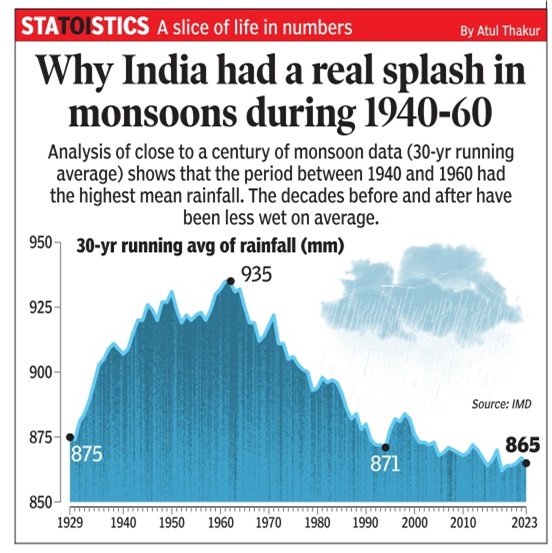
From: Sep 6, 2024: The Times of India
See graphic:
Average/ mean rainfall in India. 1929 – 2023
1901-2013: Monsoons that crossed the 100% mark
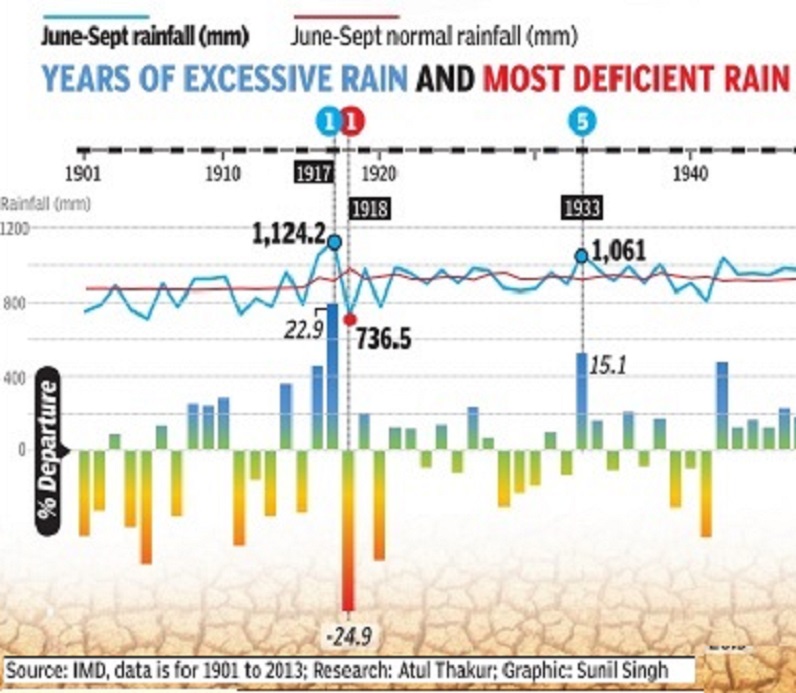
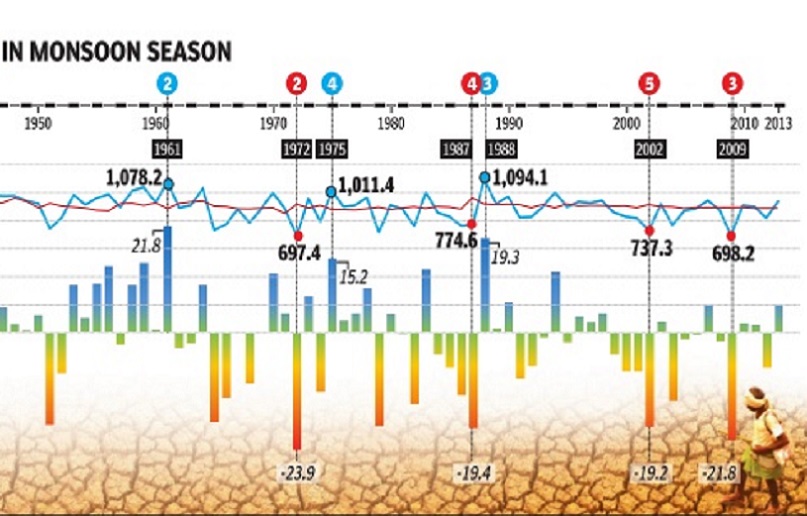
See graphics, '| Years of excessive rain and most deficient rain in monsoon season, 1901-2013 '
Since 1901, there have been 59 years when the monsoon has crossed 100% of the LPA. Since 2000, there have been only four years when monsoon crossed the 100% mark. These are 2003, 2007, 2010 and 2011. The projection is welcome news for the government as a stuttering monsoon can cast a long shadow on its political fortunes with growth slipping below 5% and high food inflation — prices for consumers rose 11.84% in June — proving a sizeable thorn in the side for UPA-2.
The government hopes the farm sector significantly improves on 2012’s 1.8% growth with R Rangarajan, chairman of the PM’s economic advisory council, saying a normal monsoon could even yield a 3.4% growth.
India: Back-to-back, ‘above normal’ monsoon after 1958-59
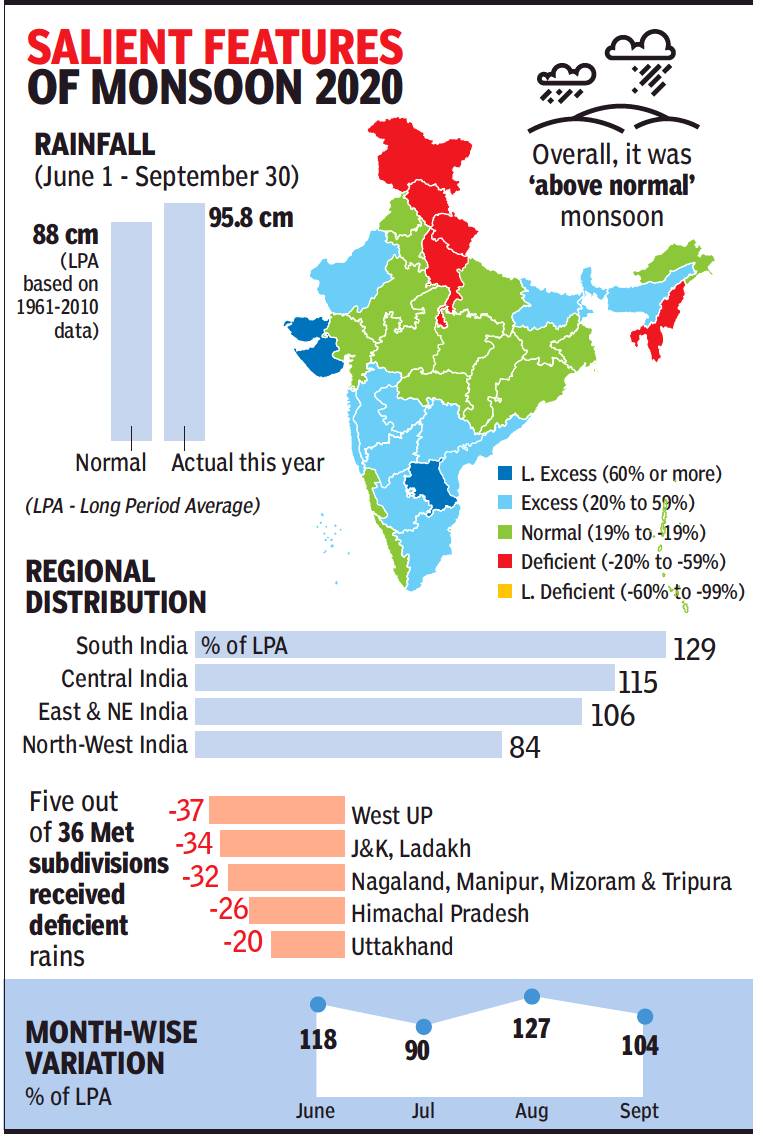
From: After 61 yrs, India gets back-to-back ‘above normal’ monsoon seasons, October 2, 2020: The Times of India
For the first time in 61 years, India recorded back-to-back “above normal” monsoon years, with this year’s season ending with countrywide rainfall at 9% above the long period average (LPA). Monsoon rains this year were also the second highest in 26 years after 2019, when rainfall across the country was 10% above the LPA.
The last time India had two consecutive years of above normal monsoon was in 1958 (110% of LPA) and 1959 (114% of LPA). This year, an average of 95.8cm of rain was recorded in the country as against the LPA of 88cm.
Surplus rains in June, Aug & Sept
However, the distribution of seasonal rainfall during the June-September period was not uniform. The country recorded the highest 127% of LPA rainfall in August while July was a deficit month with 90% of LPA. The monsoon rainfall has to be between 96%-104% of LPA to be considered “normal” and between 104-110% of the LPA to be described as “above normal”. Anything more is termed “excess” rainfall.
In its first stage forecast for the seasonal rainfall issued in April, the IMD had predicted rains to be 100% of LPA (normal) with a model error of ± 5%. The forecast was upgraded to 102% of LPA, with a model error of ± 4%, in IMD’s update in May end. IMD also predicted a probability of 65% of monsoon rainfall to be “normal” to “above normal”. The actual seasonal rainfall for the country as a whole was 109% of LPA, which is more than the predicted value and thus turned out to be positive for the kharif (summer) crops.
Though India had recorded deficit rainfall in July, the surplus rains in June, August and September helped in the country recording an all-time high acreage. Based on it, the agriculture ministry has set a record target of 301 million tonnes of foodgrains for the 2020-21 crop year. The monsoon started retreating from western parts of north-west India on September 28 against the normal withdrawal date of September 17. As on Thursday, the south-west monsoon had withdrawn from Punjab, western Himalayan region, Haryana, Chandigarh, Delhi and parts of Rajasthan and some parts of Uttar Pradesh.
Driest, wettest cities of India: Jun-Aug
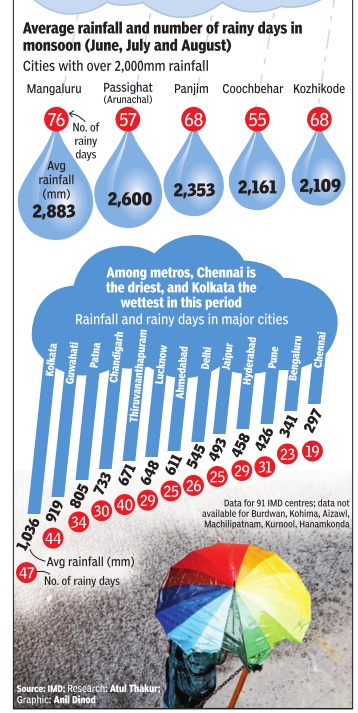
See graphic, ' The driest and wettest cities of India during the monsoons '
Dates when monsoons reach different regions
In typical years
See graphic, ' The dates on which the monsoon normally reaches various parts of India. '
Years in which the monsoon arrived early
2011-2014
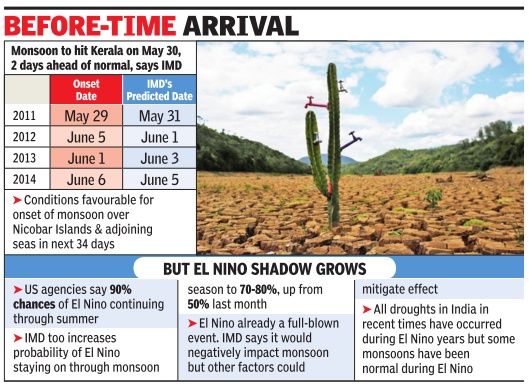
See graphic, ' Years in which the monsoon arrived early: 2011-2014'
Years in which the monsoon arrived late
2000-23

From: June 9, 2023: The Times of India
See graphic:
Years when the monsoon arrived late over the Indian mainland, 2000- 2023
All of India: Date of Monsoon covering entire country
2012-21
Monsoon covers India 12 days in advance, fastest since 2013, June 27, 2020: The Times of India
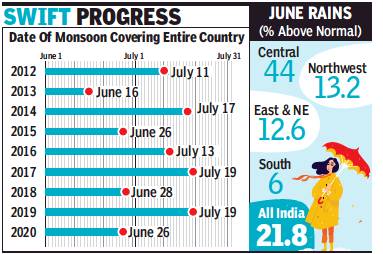
From: Monsoon covers India 12 days in advance, fastest since 2013, June 27, 2020: The Times of IndiaIn 2021 the date was 13 July
22% Rain Surplus In June, Good Sign For Sowing
Pune/New Delhi:
In a swift and smooth advance through the country, the monsoon covered the whole of India, 12 days before the normal date of July 8, the India Meteorological Department (IMD) said.
Along with 2015, when the monsoon had raced through the country on the same date, this was the fastest progression of the rain-bearing system since 2013.
In the past 13 years, the monsoon has covered the entire country before June 26 only once — in 2013, when a freak convergence of several weather systems had caused the catastrophic Kedarnath deluge while advancing the monsoon by an all-time record date of June 16.
IMD said the monsoon marched into the remaining parts of Punjab, Haryana and Rajasthan to cover the entire country, 26 days after hitting the Kerala coast. This sets the stage for timely sowing of kharif crops across the country.
“This was one of the smoothest advances of the monsoon in recent years. Usually the monsoon progresses in fits and starts, but this year it did not stall for long at any stage,” said D Sivananda Pai, IMD’s lead monsoon forecaster.
2013-2022

From: Vishwa Mohan, July 3, 2022: The Times of India
See graphic:
The date by which the Monsoon covered all of India, 2013-2022
Kerala, 2005-2017: actual dates
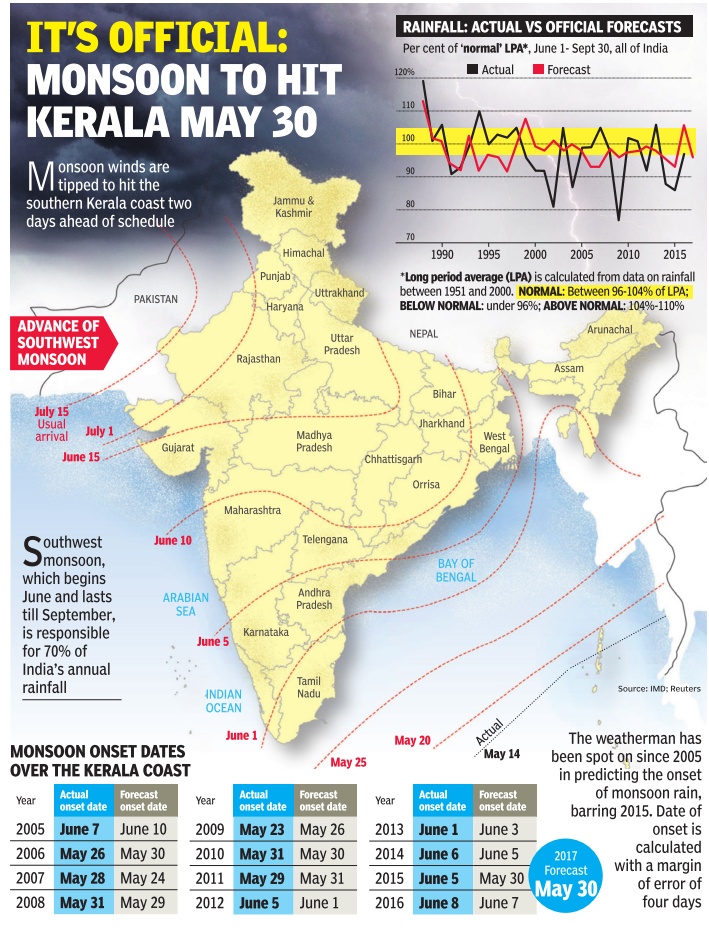
ii) Actual rainfall vis-à-vis official forecasts, 1990-2015;
iii) The dates on which the monsoon normally reaches various parts of India. The Times of India, May 17, 2017
Delhi
1960-21

From: Priyangi.Agarwal, June 29, 2022: The Times of India
See graphic:
Monsoon advancement in Delhi, 1960-21
2007-12
See accompanying chart for Delhi The arrival of the monsoon in Delhi: 2007-12
Kerala: 2008-15, onset vs performance
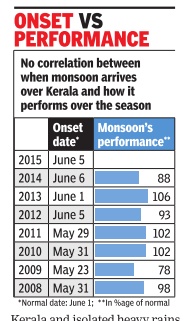
Graphic courtesy: The Times of India
See graphic, ' Date of onset of Monsoons in Kerala, 2008-15, vis-à-vis its all- India performance. There is no correlation between early or late arrival in Kerala and good or bad all- India performance'
Mumbai
Dates of arrival
June 9: 2021
June 11: 2022 [the normal date of arrival]
June 14: 2020
June 25: 2019.
Mumbai and Delhi together
2023: The monsoon on 23 June advanced over both Delhi and Mumbai together for the first time since June 21, 1961, the IMD said.
2011-15: actual and forecast dates
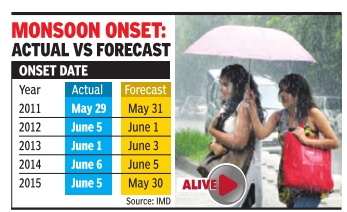
See graphic, ' Onset date for Monsoons, actual and forecast, 2011-15, year-wise '
2020: 2 weeks early
Monsoon covers entire country nearly two weeks early: IMD, June 26, 2020: The Times of India
NEW DELHI: The Southwest Monsoon has covered the entire country nearly two weeks ahead of its schedule, the India Meteorological Department said.
The monsoon usually sets over Kerala on June 1 and it takes 45 days to reach Sriganganagar in west Rajasthan, its last outpost in the country.
From this year however, the IMD has advanced the onset date over Sriganganagar by a week and the new normal date for monsoon to cover the entire country is July 8.
"The Southwest Monsoon has further advanced into the remaining parts of Rajasthan, Haryana and Punjab and thus it has covered the entire country today, June 26," the IMD said.
A low-pressure area over the Bay of Bengal, which moved west-northwestwards, and another cyclonic circulation over central India helped in advance of the monsoon.
In 2013, the monsoon had covered the entire country on June 16. This had also coincided with the deadly Uttarakhand flash floods.
"After 2013, monsoon has covered the country so rapidly this year," IMD Director General Mrutunjay Mohapatra said.
2020: progress across India

From: Sudha Nambudiri, May 18, 2021: The Times of India
See graphic:
Progress of Southwest Monsoon 2020- Advance (See above) and Withdrawal (See below)
Monsoon cycle
The Times of India , Jun 02 2015
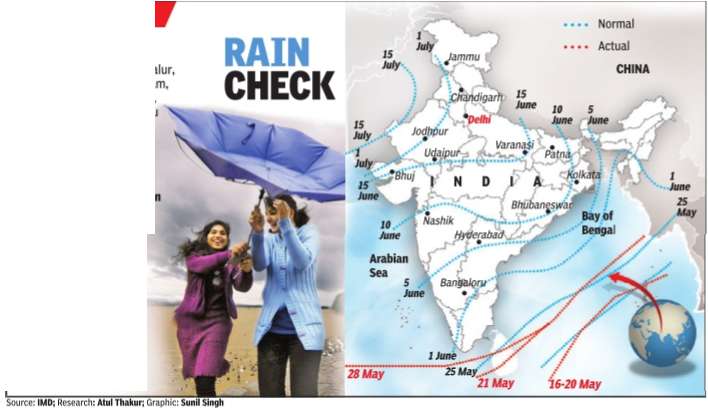
If after May 10, 60% of 14 stations -Minicoy, Amini, Thiruvananthapuram, Punalur, Kollam, Allapuzha, Kottayam, Kochi, Thrissur, Kozhikode, Thalassery, Kannur, Kudulu and Mangalore -report rainfall of 2.5 mm or more for two consecutive days, the onset of the monsoon is declared on the second day. Normally, the monsoon sets in over Kerala around June 1 and then advances northwards. By June 5, it goes past half of Karnataka and Andhra Pradesh and crosses Maharashtra by the 10th.It covers significant portions of Gujarat, Madhya Pradesh and Uttar Pradesh by June 15 and the entire country by June-end.
The El Niño effect
1951-2017: El Niño Vs. IOD
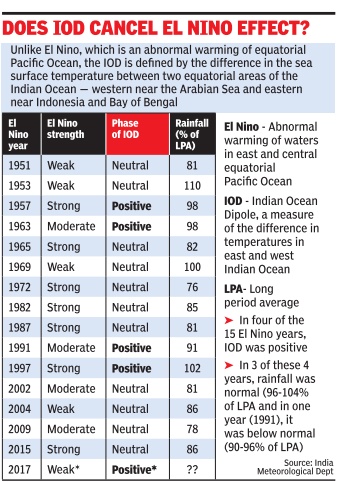
See graphic:
Impact of the El-Nino on Indian monsoons, 1951-2017
1970-2015
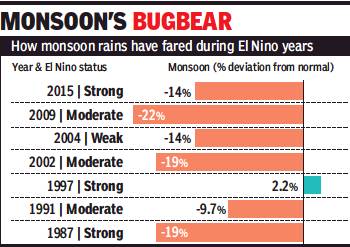
From: Amit Bhattacharya, Does IMD forecast signal monsoon acing El Nino in ’19?, April 17, 2019: The Times of India
IMD has forecast a “near normal” monsoon this year while also indicating that a weak El Nino is likely to persist through the rainy season. If both forecasts hold true, it would be only the second time in nearly 50 years that India will have a normal monsoon in an El Nino year.
There have been nine El Nino years since 1970, and only once has the Indian summer monsoon remained unscathed from its influence. That was in 1997, when despite one of the strongest El Ninos, the monsoon ended 2% above normal.
In the other eight instances, the June-September rains in India were hit irrespective of El Nino’s strength — weak, moderate or strong — indicating a strong link between the weather anomaly in the Pacific and monsoon’s performance in India.
El Nino is an abnormal warming of ocean waters in east and central equatorial Pacific that drives changes in wind currents which, in turn, have weather impact around the world.
Apart from 1997, other instances of good monsoons during El Nino years are all from the 1950s and 60s. “There are two years when the monsoon was normal or above normal during a weak El Nino, 1953 and 1969. This year’s El Nino is also predicted to be weak,” said D Sivananda Pai, IMD’s lead monsoon forcaster. The monsoon also defied El Nino in 1957 and 1963, IMD records show.
However, the link between El Nino and poor monsoon appears to have strengthened in recent decades. All four El Ninos since year 2000 have adversely impacted rainfall in India. This includes a weak episode in 2004, which led to a drought year with the monsoon ending at 14% below normal.
In recent years, just a warming in the Pacific, which didn’t result in an El Nino, is believed to have impacted the monsoon in 2012 and 2014. However, every El Nino is unique with its own peculiarities. How it plays out, and whether large-scale features that depress the monsoon actually develop, remains to be seen.
How the monsoons control our destiny
A backgrounder/ 2000-24
Vishwa Mohan & Surojit Gupta, April 20, 2024: The Times of India

From: Vishwa Mohan & Surojit Gupta, April 20, 2024: The Times of India
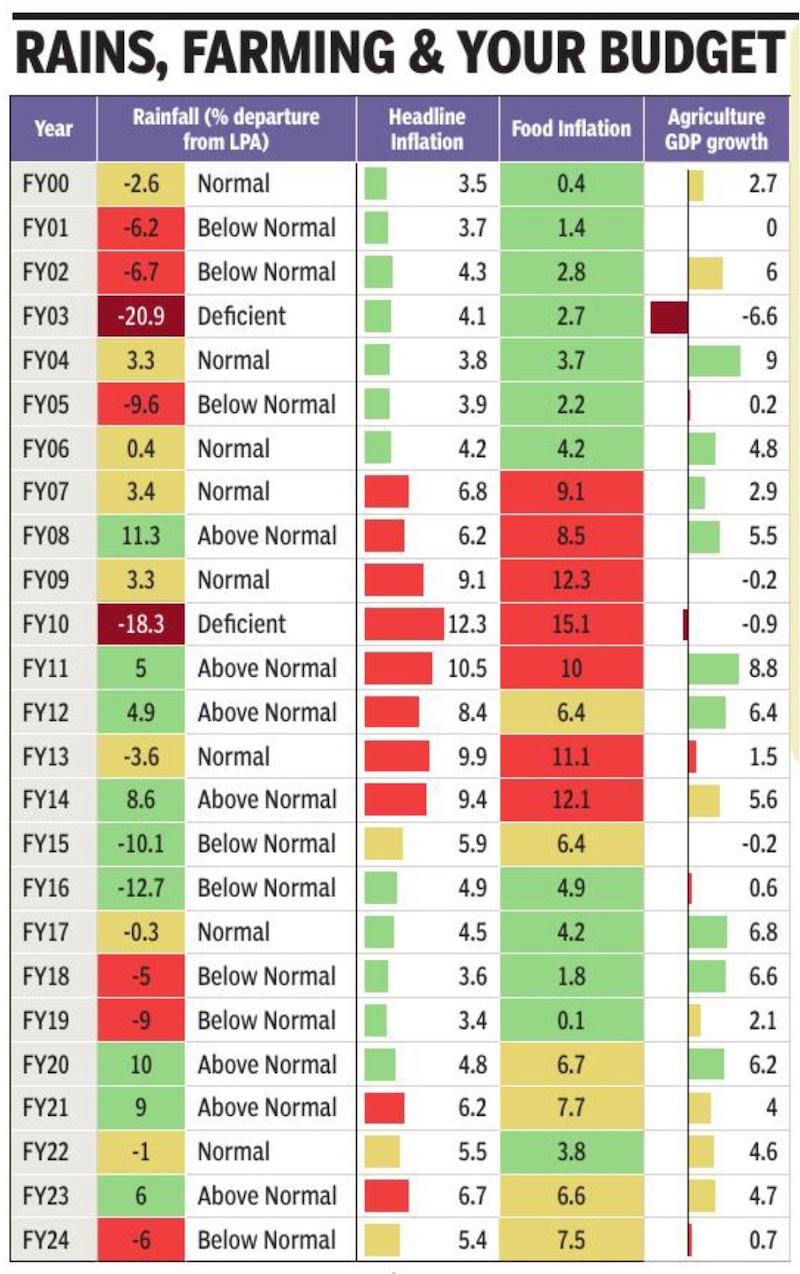
From: Vishwa Mohan & Surojit Gupta, April 20, 2024: The Times of India
Former President Pranab Mukherjee, who was earlier a finance minister, had once remarked that the monsoon season (JuneSept) was India’s true finance minister, indicating the significance of rain during the period for the country. A lot has changed since then – large parts of India’s agriculture have been droughtproofed through irrigation networks, better varieties of seeds are being used — but the importance of summer (southwest) monsoon remains high, for some old and some new reasons. It contributes 70% of the country’s rainfall and still supports farming sector to a large extent, recharges ground water and greens energy supply by making hydro power viable. Changing food consumption pattern, more open trade and increased role of sentiments in the economy have altered the way monsoon impacts our economic life. But first, what exactly is a normal monsoon?
Normal or above normal?
The India Meteorological Department (IMD) predicted on Monday that the country is “most likely” to experience ‘above normal’ rainfall. The seasonal rainfall is likely to be 106% of long period average (LPA) with a model error of ± 5%. The LPA of seasonal rainfall over the country as a whole for the period 1971-2020 is 87cm.
Factors indicating good rainfall
IMD believes the gradual weakening of El Nino (climate pattern associated with warming of the ocean surface in the central and eastern tropical Pacific Ocean), expected development of La Nina (climate pattern associated with the periodic cooling of ocean surface temperatures in the central and east-central equatorial Pacific), positive Indian Ocean Dipole (IOD) and below normal snow cover over northern hemisphere will ensure good rain this monsoon.
El Nino
(means ‘little boy’ in Spanish): It occurs on average every two to seven years, and typically lasts nine to 12 months. It influences weather and storm patterns in different parts of the world. The current El Nino event, which developed in June 2023 and peaked in December, was at its strongest between Nov and Jan this year. The Met department says moderate El Nino conditions are currently prevailing over the equatorial Pacific region. The latest climate model forecasts indicate that El Nino conditions are likely to weaken further to neutral El Nino Southern Oscillation (ENSO) condition in the early part of the monsoon season.
La Nina (means ‘little girl’ in Spanish): La Nina is linked to good monsoon rainfall in the Indian sub-continent. IMD says La Nina conditions are likely to develop during the second half (AugSept) of the monsoon season. Records show that the summer monsoon was either ‘normal’ or ‘above normal’ in most of the last 22 La Nina years since 1954, except 1974 and 2000 when it was below normal. Data from 1951 to 2023 shows that out of nine years when La Nina was preceded by El Nino, the summer monsoon seasonal rainfall was ‘above normal’ in two years, ‘excess’ in five years and on the positive side of ‘normal’ in two years.
IOD: It is one of the dominant modes of variability of the tropical Indian Ocean. It is an ocean-atmosphere interaction which is very similar to El Nino. It is, therefore, also known as Indian Nino. It’s defined as the difference in sea surface temperatures between the eastern and western regions of Indian Ocean and can significantly impact weather patterns in the Indian sub-continent and elsewhere, including southeast Asia and Australia. IMD says neutral IOD conditions are prevailing over the Indian Ocean and the latest climate model forecasts indicate that positive IOD conditions are likely to develop during the latter part of the southwest monsoon season.
Normal for country may not be normal for your city
Instead of quantitative rainfall over the country as a whole, it’s the distribution of fairly good rainfall across states that matters the most. Though IMD’s latest forecast predicted good rainfall in the ‘monsoon core zone’ (rainfed agriculture region of India), its other rounds of forecasts next month and at the end of June, July and August will give a fairly clear indication of spatial distribution of rainfall.
Impact on farming
Water-guzzling paddy is the main crop of the monsoon season beginning June. Though states like Punjab, Haryana and western Uttar Pradesh man- age to sow fairly large areas of land even during the ‘below normal’ monsoon season as they have robust irrigation networks and they use substantial amount of groundwater with the help of subsidised fuel, the states in ‘monsoon core zone’ that largely depend on monsoon rain suffer. It also reflects in their output of Rabi (winter sown) crops such as wheat and mustard. Rabi crops benefit from good monsoon rain as it not only fills reservoirs and water bodies for irrigation during winter but also provides enough moisture content in the soil.
Drought years, when the country gets less than 90% of LPA, on the other hand, affects the entire country. If we look at the past 10 years’ data, the deficient (drought) monsoon years of 2014 and 2015 resulted in a decline in overall food-grain production. Growing efforts to make the country drought-proof through measures such as expanding the irrigation network, water conservation, precision irrigation (drip and sprinkler) and use of drought-resistant seeds, however, have resulted in cushioning the impact of ‘below normal’ monsoon rains.
How monsoon impacts economy
The Indian economy, growing at 7% for three consecutive years, is expected to benefit immensely from a good monsoon. A bumper harvest adds to rural prosperity and triggers demand for everything — from motorcycles to mobile phones. It also helps calm prices as supplies improve. Robust rain also helps in reducing the demand for diesel used in the farm sector. It helps in recharging reservoirs and groundwater levels and also leads to greater hydro power generation.
1950-2010: India’s growth rate in drought years
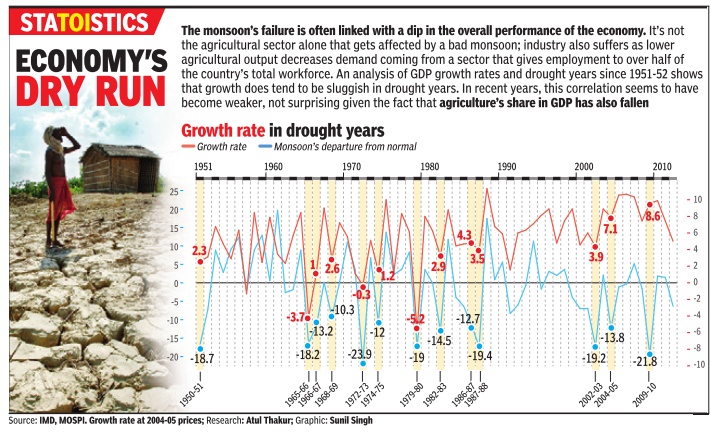
Graphic courtesy: The Times of India
See graphic ‘Growth rate in drought years in India and monsoon departure from normal’
Why Monsoon Matters Beyond The Farm
1965-2010
June 11, 2018: The Times of India
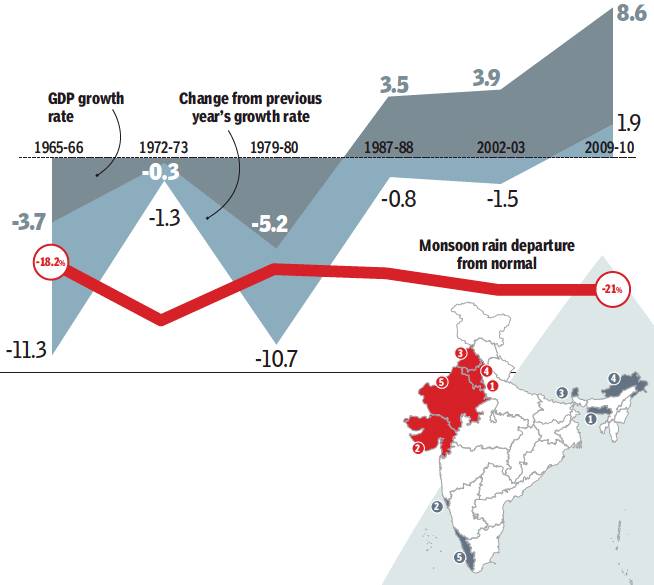
GDP growth rate;
Change from previous year's growth rate'
1965-2010
From: June 11, 2018: The Times of India
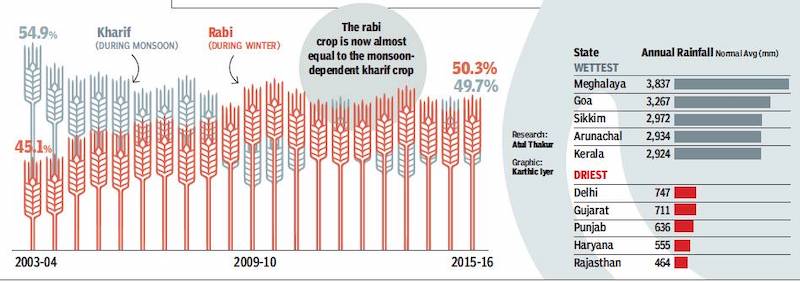
annual rainfall, state-wise
From: June 11, 2018: The Times of India
Amid hopes that the projected 97% monsoon will fuel growth, here’s a look at monsoon’s role in India’s economy
How does the monsoon affect India’s economy?
The monsoon’s failure is often linked to the economy’s overall performance. It is not the agricultural sector alone that is affected by a bad monsoon — industry too suffers as lower farm output decreases demand from this sector, which employs half the country’s workforce. Contrasting GDP growth rates with drought years since 1951-52 reveals growth is sluggish in drought years. In recent years this correlation has become weaker, which may be linked to the fact that agriculture’s share in GDP has also fallen. But it continues to employ half of India’s workforce.
Is there a major difference between agricultural output in Kharif and Rabi seasons?
Over the past decade, the share of Kharif (monsoon) crops in the national output have fallen, while Rabi (winter) crops are on the rise. Crops like rice and maize, which grow in monsoon and winter, have seen a marked decline in Kharif output, while the share of their Rabi output has risen. Exclusively Rabi crops, such as wheat, remain unaffected by monsoons.
What is the Indian monsoon?
The southwest monsoon is a summertime reversal in wind direction that provides nearly 70% of the Indian subcontinent’s annual rainfall. Monsoon winds originate from the southern Indian Ocean. They get deflected southwestwards towards India after crossing the equator. These winds are driven by air pressure differences caused by the more rapid heating up of the land in summers compared to the ocean. The land heats up the air over it, causing it to rise and create a low-pressure zone, which attracts winds from the highpressure regions over the ocean. In south Asia, the effect is enhanced by the Tibetan plateau, which heats up more than the atmosphere would at its height. Monsoon has a set pattern of advance and withdrawal. It arrives in southern India in May or June, and advances northwards and westwards, reaching Pakistan by July. It retreats from Pakistan by September, finally withdrawing from southern India by December. The season doesn’t see a continuous deluge, but has alternate wet and dry phases, the timing and duration of which account for much of the year-to-year variation in monsoon rains.
What are the country’s wettest and driest states?
Mawsynram, a village in Meghalaya is the world’s wettest place. Meghalaya receives the country’s highest rainfall followed by Goa and Sikkim. The national capital on the other hand was among the driest states in 2016.
2008-19
April 6, 2019: The Times of India
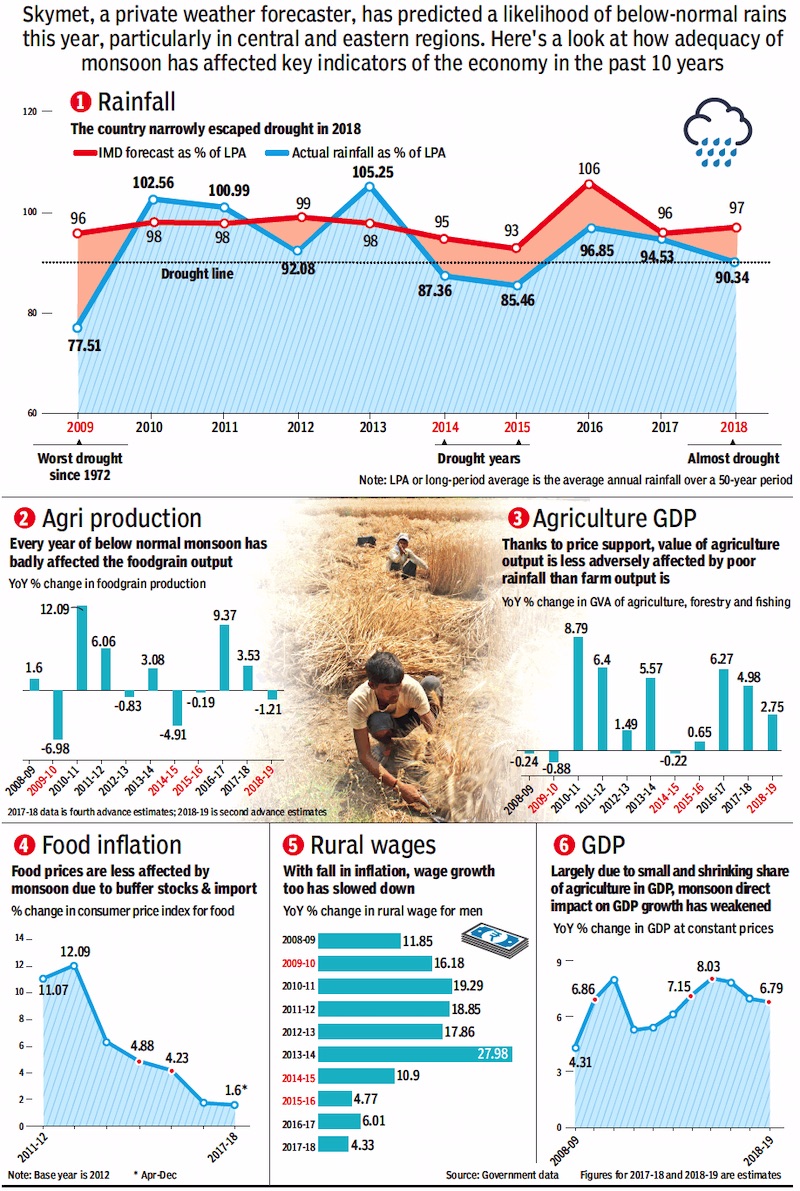
From: April 5, 2019: The Times of India
See graphic:
How monsoon affects our lives in India, 2008-19
Skymet, a private weather forecaster, has predicted the likelihood of below-normal rains this year, particularly in the central and eastern regions. The forecaster pegged rainfall in the country during the 2019 monsoon (June-September) at 93% of the long-period average (LPA) of 887 mm. LPA is defined as the average annual rainfall over a 50-year period. There is a a 55% probability that the total rainfall will be below normal and a 15% probability of drought.
What is a normal monsoon
India defines average, or normal rainfall as between 96-104% of a 50-year average of 89 cm for the entire four-month season beginning June until September. Anything less than 90% is a 'deficient' monsoon, while 90-96% is considered 'below normal'. An average between 104-110% is 'above normal' and anything above 110% is 'excess'. Indian Meteorological Department (IMD), the country's official weather forecaster, will issue its monsoon outlook later this month. A good monsoon which waters more than half of the country's farmland is essential to boost consumption and economy. Even though farming output makes up just less than 14% of India's economy, the sector employs more than half of the country's 1.3 billion population. Here's a look at how the adequacy of monsoons has affected key indicators of the economy in the past 10 years.
1. RAINFALL
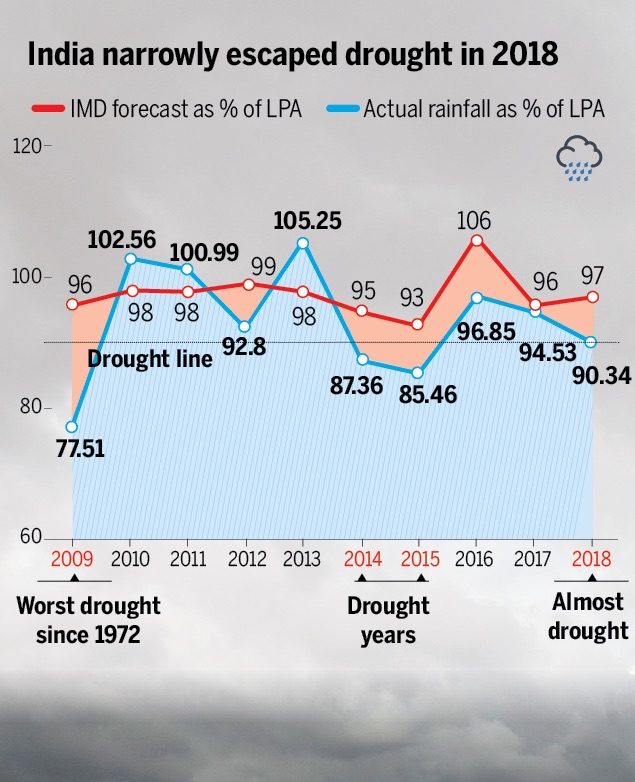
From: April 6, 2019: The Times of India
The country narrowly escaped a drought in 2018, following two successive years of normal rains. Skymet's forecast of a below normal monsoon in 2019 is on account of a developing El Nino phenomenon, when warm waters in the Pacific Ocean impact summer rains in India. "The Pacific Ocean has become strongly warmer than average. This means, it is going to be a devolving El Nino year," said Jatin Singh, Skymet's managing director. "But even if it is a mild El Nino, it will have its impact on rainfall," added GP Sharma, Skymet's president of meteorology.
2. AGRICULTURE PRODUCTION
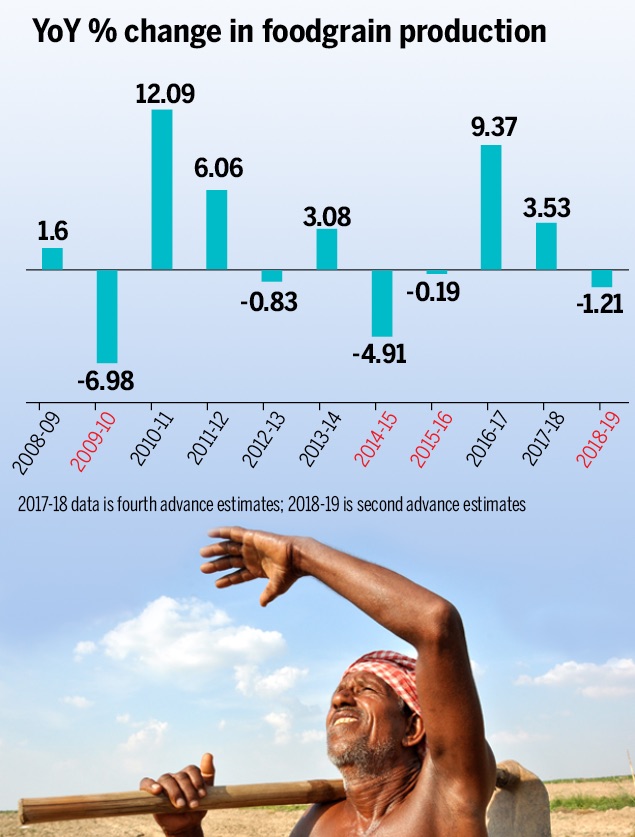
From: April 6, 2019: The Times of India
The monsoon delivers about 70% of India's annual rainfall and is key to the success of the agriculture sector, There is a 75% probability of below normal rainfall this June, which could decrease to 55% in July, the two months when rains are critical for the sowing of kharif (summer) crops. The monsoon is then likely to pick up pace in August and September, during which El Nino will begin to decay. Every year of below-normal monsoon badly affects foodgrain output. Farm output suffers majorly in a drought year, when rainfall is more than 10% below normal, like in 2014-15 and 2015-16. Both years -- the first two of PM Narendra Modi's tenure -- saw negative growth in farm production, but recovered substantially in the 2016-17.
3. AGRICULTURE GDP
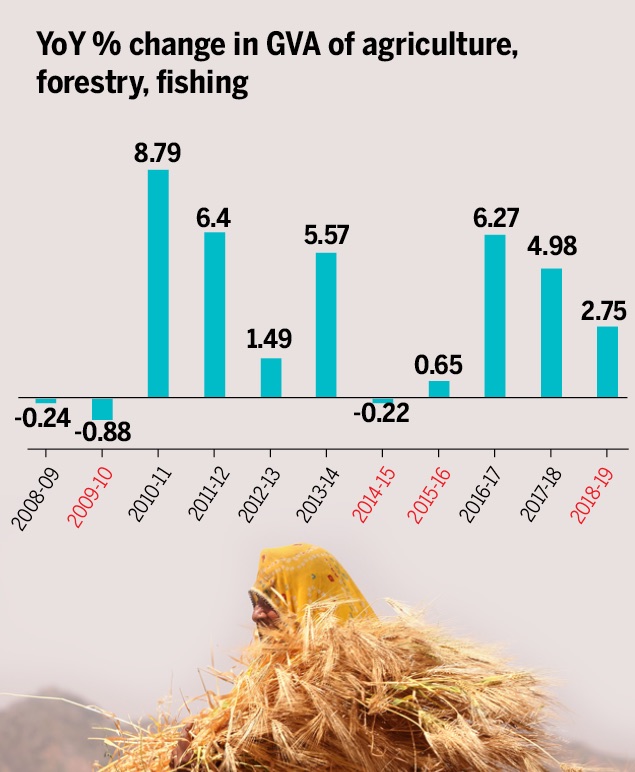
From: April 6, 2019: The Times of India
Thanks to price support, the Gross Value Added (GVA) of agriculture output is less adversely affected by poor rainfall than farm output is.
4. FOOD INFLATION
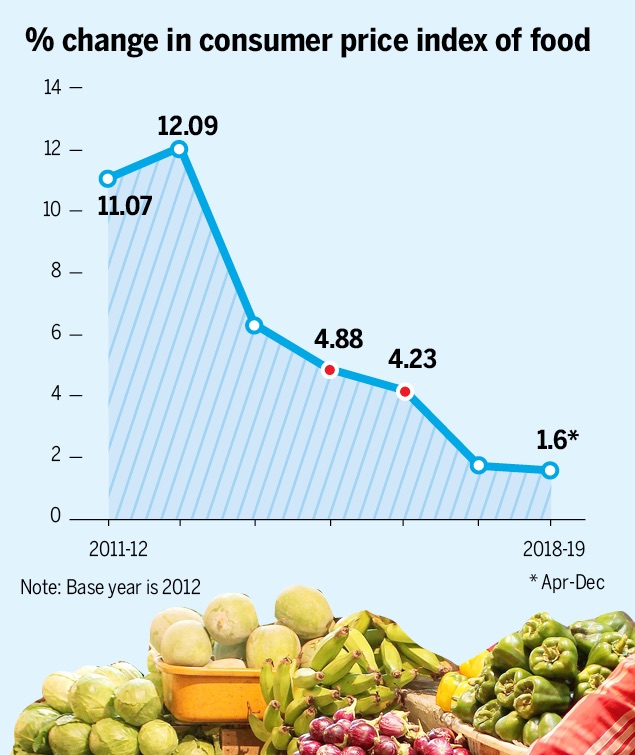
From: April 6, 2019: The Times of India
Food prices are less affected by monsoon due to buffer stocks and import. Other factors that drive food inflation in India -- rural wages, minimum support prices (MSP), agriculture input costs and global food prices.
First, rural wages are important because human labour accounts for 25-20% of the total cost of cultivation of crops such as rice and wheat. Second, MSP directly feeds into food inflation by forming a floor for wholesale food prices. Third, agriculture input costs such as electricity, diesel, pesticides and machinery also impact food inflation. Fourth, global food prices are important because of their influence on products that India imports and because international prices are one of the factors used to determine the MSPs of crops.
5. RURAL WAGES
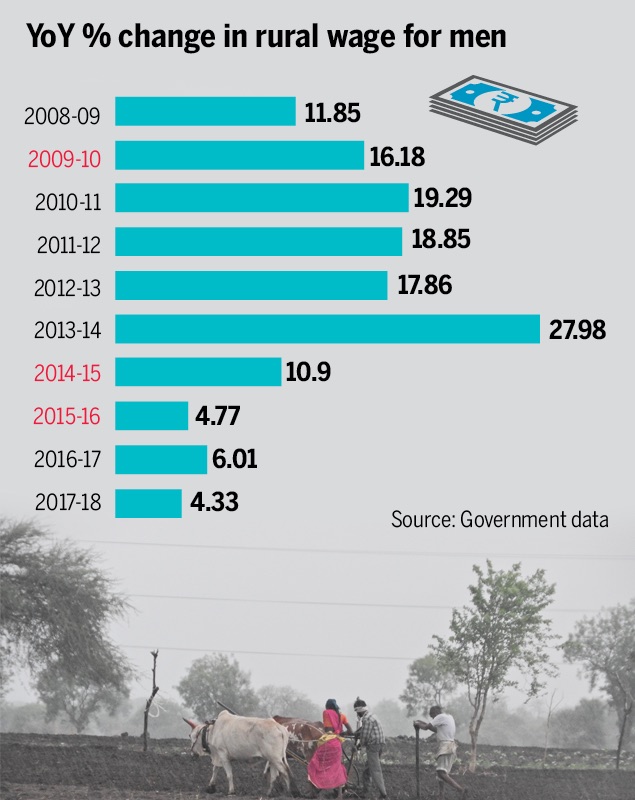
From: April 6, 2019: The Times of India
Since food inflation and rural wages are correlated, with a fall in inflation, rural wage growth too has slowed down.
6. GDP
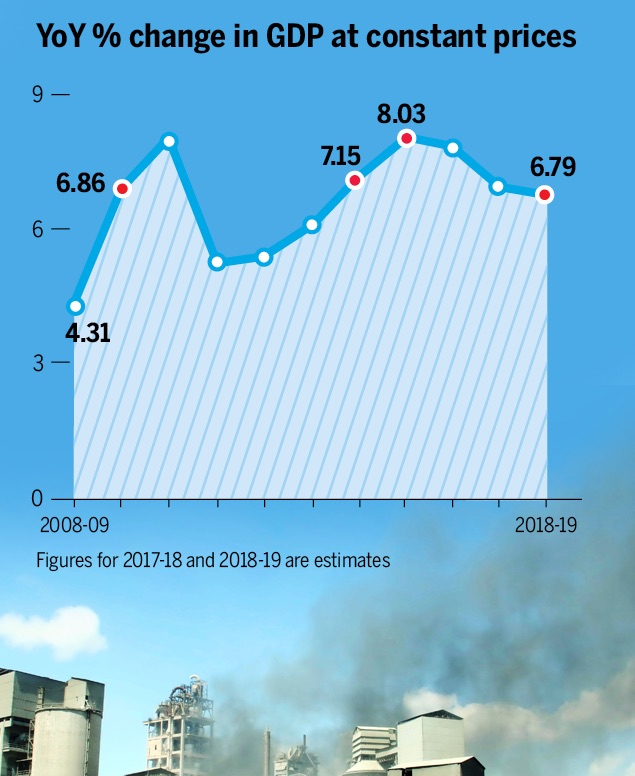
From: April 6, 2019: The Times of India
Largely due to the shrinking share (about 17-18%) of agriculture in India's GDP, the monsoon's direct impact on the GDP has weakened over the years.
Monsoon and agriculture
1986-2015
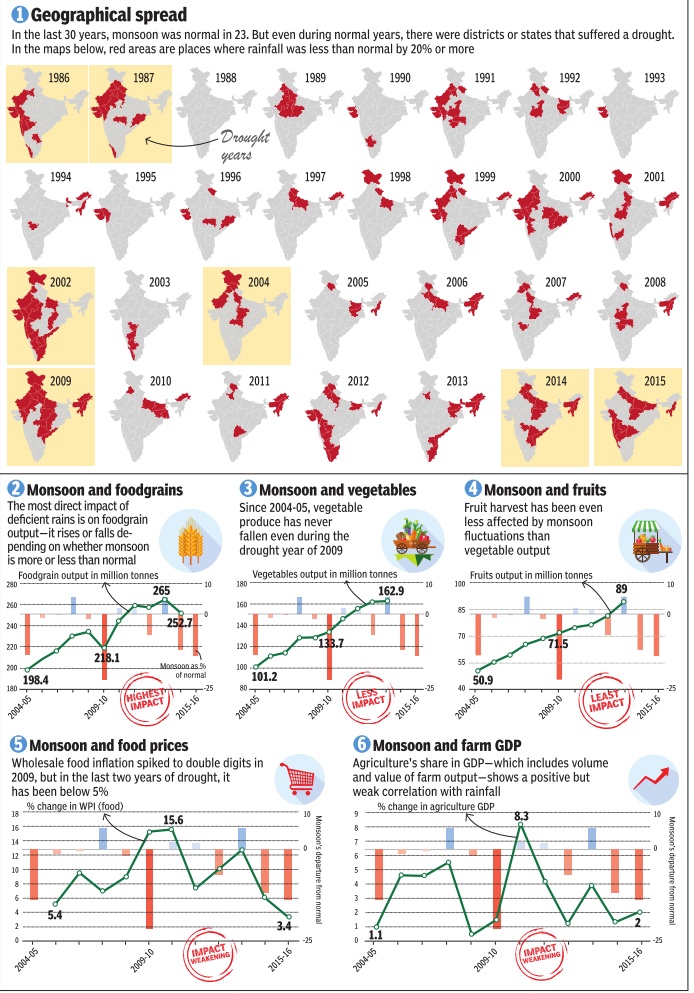
Graphic courtesy: The Times of India, April 18, 2016
See graphic, ' Monsoons in India: Geographical spread, monsoon and foodgrains, monsoon and vegetables, monsoon and fruits, monsoon and food prices and monsoon and farm GDP: 1986-2015'
2004-09
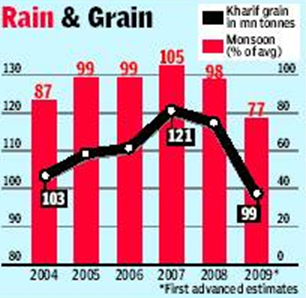
See graphic, ' Rain and grain: 2004-09 '
2006-16
See the graphic 'How monsoon affects farming, 2006-16'
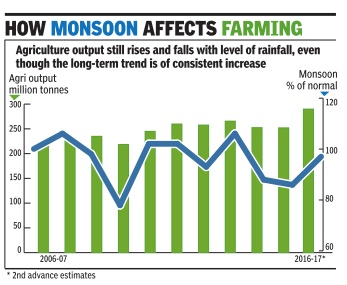
Monsoon break
Definition
A monsoon break — a period when rain activity comes to a stop in most of central India, the region where the monsoon trough is formed — is a common occurrence during the season. “The monsoon has been active without a break since mid-June. This does not happen often and is a reason why the rains were higher than the predicted 101% of LPA for July,” said D Sivananda Pai, IMD’s lead monsoon forecaster. (By Amit Bhattacharya)
Monsoons without a break
2003-2010
Non-stop monsoon marches on
Amit Bhattacharya TNN
The Times of India 2013/08/16
One or two periods of a break in monsoon — defined as three straight days of very low rain activity across central India — are common during the rainy season. Since 2000, there have only been three years when there was no monsoon break. And all three years coincided with plentiful rains.
“Two months of monsoon activity without a break is rather rare. It’s an indication of agood monsoon,” said M Rajeevan, senior weather scientist at the earth sciences ministry.
At least four factors have worked in favour of the monsoon in 2013. The first good sign was an absence of El Nino — an anomalous rise in ocean surface temperatures in the east Pacific that is linked to monsoon failure in India.
Currently, weak La Nina conditions exist in the Pacific, which is the opposite of El Nino and is known to help the monsoon here.
“Then, typhoons breaking out over the south Pacific this season have also helped because these have generally moved in a direction that reinforces the Indian monsoon. This is consistent with the weak La Nina conditions,” said Rajeevan.
More importantly, what has helped sustain the rains — and distribute it more or less evenly across the region — has been a series of low pressure formations over the Bay of Bengal that have travelled westwards at regular intervals.
“There have been an unusually high number of low pressure systems, along with cyclonic circulation over land. These have nurtured the monsoon this year, especially in the interior regions of south and central India,” said Pai.
Lastly, Pai said a strong Arabian Sea branch of the monsoon first helped accelerate the rain coverage over the country, and also brought good rains over the west coast.
REGION-WISE
Monsoons in the various cities, regions
1981-2010
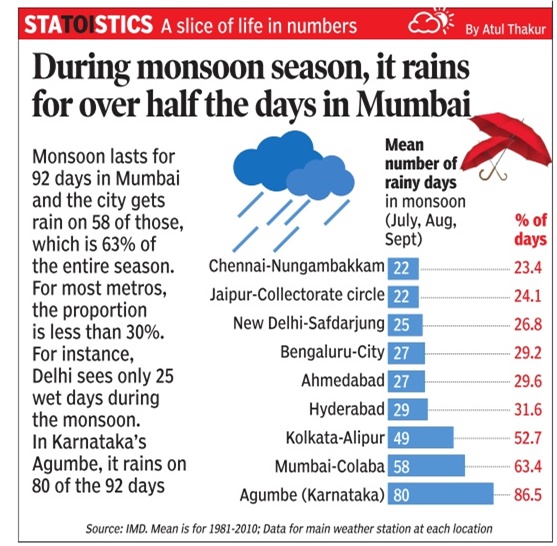
From: Sep 4, 2024: The Times of India
See graphic:
Monsoons in the various cities, regions of India, 1981-2010
Monsoons in Chennai
2007-2018

From: U Tejonmayam, July 27, 2019: The Times of India
See graphic:
Rain Chennai got from the Southwest monsoon, 2007-2018
Monsoons in Delhi
2010-20: a backgrounder
Jasjeev Gandhiok, June 4, 2021: The Times of India
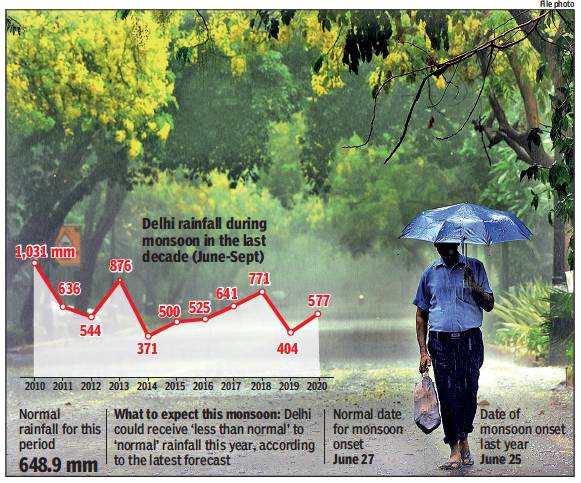
From: Jasjeev Gandhiok, June 4, 2021: The Times of India
Above normal’ monsoon in Delhi only thrice since 2010
Predicted To Be Slightly Below Normal To Normal This Year
Jasjeev.Gandhiok@timesgroup.com
Delhi has received above normal rainfall in the monsoons only three times in the last 11 years, according to data from 2010 till 2020. This year, too
While the normal mark for the June-September period is 648.9mm of rain, the city received 576.6mm in 2020 and only 404.3mm in 2019.
In 2020, the monsoon arrived two days early on June 25.
June 29 had historically been the normal monsoon onset date for Delhi, but this was revised in 2020 to June 27.
In the decade between 2010 and 2020, Delhi recorded the highest seasonal rainfall in 2010, 1031.5mm of rain poured over the city. The lowest during this period was 370.8mm in 2014. On average, Delhi receives only around 65.5mm of rainfall in June, largely because of premonsoon showers. In July, the normal average for precipitation is 210.6mm and in August, 247.7mm.
Monsoons in Punjab, Haryana
1980- 2010
See graphic, ' Monsoons in Punjab, Haryana: 1980- 2010 '
1999-2014
See graphic, ' Monsoons in Punjab, Haryana: 1999-2014 '
16-year trend of poor monsoon in Punjab, Haryana
Amit Bhattacharya New Delhi The Times of India Sep 22 2014
India's bread basket states of Punjab and Haryana received just around half the normal rainfall this monsoon season. But more worryingly , this year's rain deficit is not an isolated event. The two key agricultural states have been getting below par rainfall for the past 16 years.
Met department figures reveal Punjab has seen above normal monsoon rainfall in just two years since 1999. The last time that happened was seven monsoons ago, in 2008.The stats are similar for Haryana, where rains have been above normal in just four of the last 16 monsoons.
Experts are divided over why rains have been consistently failing in the region but the trend has dire implications for agriculture, which relies heavily on groundwater. The two states are among the most exploited regions in the world for groundwater.
Deficient rains add another dimension to the crisis.Groundwater mainly de pends on rainfall for recharge. So, less rain means less groundwater availability .A failed monsoon also means farmers draw more ground water to irrigate their crops, particularly paddy , accelerating the fall of the water table.
At TOI's request, Prof Krishna AchutaRao from IIT Delhi's Centre for Atmospheric Sciences plotted the annual and seasonal rainfall in the two states since 1980.The rain stats were obtained from the India Meteorological Department. A linear graph reveals a disturbing trend of decreasing rains in the bread basket of India. It shows average annual rainfall in Punjab falling during this period from just over 800mm in 1980 to less than 600mm in 2014 — a drop of roughly 200mm. Haryana’s annual average shows a similar drop, from around 780mm in 1980 to less than 580mm at present.
For monsoon season rainfall, Punjab has seen a drop of nearly 120mm, from an average of around 600mm in 1980 to roughly 480mm this year.
In Haryana, it’s down from more than 600mm to around 470mm during the same 35year period.
“The long term decrease in rainfall is apparent from the graph,” says AchutaRao, “although the rain statistics for the 1980s show very high variation.” But what’s not so apparent is the cause of the decline.
D Sivananda Pai, head of long range forecasting at IMD Pune, believes the drop is part of natural variability which will get reversed in time.
“Indian monsoon is passing through a low rainfall epoch since the 1990s. The drop in rainfall in this region could be part of that phenom enon,“ says Pai.
The story may not be that straightforward, says AchutaRao, who is coordinating multi-agency research into the Indian monsoon.
Monsoons in Rajasthan
Average rainfall of the state: 450mm, 1975 to 2023
Some record years
811mm: in A.D. 1917
668mm: 2024, till Sept 14
664mm: 1975, June 1 to Sept 15
Monsoon/ water cycle
Let’s respect the water cycle
Amit Bhattacharya | TNN 2010
Think of water and chances are you wouldn’t picture a farmer digging a tubewell. Most urban Indians can’t think beyond their own water woes — dry taps; waking up at odd hours to tank up for the day. Yet, 80% of all the water India uses goes into agriculture. But even so, 60% of our farmlands remain dependent on the rains. Just as water evaporates, it seems, so do the resources that go into water management in the countryside.
The scale of this ‘evaporation’ is so massive it is surprising the issue hasn’t generated more public debate. Nothing illustrates this better than the money spent on canals. In the 15 year-period from 1991-92 to 2006-07, the government spent Rs 1.3 lakh crore on major and medium irrigation projects without achieving any net increase in the irrigated area!
If anything, India’s total canalirrigated area has decreased from 17,791,000 hectares in 1991-91, to 16,531,000 hectares in 2007-08, according to provisional figures released by the agriculture ministry. The story behind this dubious feat encapsulates almost everything that’s wrong with water planning and use in agriculture.
Himanshu Thakkar, coordinator for South Asia Network on Dams, Rivers and People, should know. Last year, he co-authored a paper that contained exactly those startling statistics. He says it’s not about too few new canals but about “many old ones have stopped functioning, at least partially, due to siltation, lack of maintenance and faulty assumptions of water use. Then there are water management and sharing issues. Often there’s intensive water use in upstream areas which leaves no water at the tail-ends.”
Thakkar says it boils down to bad investment decisions. “The government keeps pushing for big irrigation projects without taking care of the existing ones, which in itself is a huge task. According to a 2005 World Bank report, the annual maintenance bill for India’s canal network comes to around Rs 17,000 crore. Less than 10% of that money is available,” he says.
Experts lament that new irrigation projects often fail to take into account the larger hydrological processes they would affect. They also pay little attention to water-use patterns. This has led to river basins such as the Krishna becoming over-irrigated.
Planning Commission member Mihir Shah calls such policy practices “hydroschizophrenia (or) a schizophrenic view of an indivisible resource like water, failing to recognize the unity and integrity of the hydrologic cycle.”
Shah elaborates: “It’s a strange situation. Water management in villages comes under two ministries — rural development ministry and ministry of water resources. Often the left hand doesn’t know what the right hand is doing.”
Both Shah and Thakkar say the first step in dealing with the crisis is accepting ground realities. “While huge amounts are spent on canal systems, groundwater has emerged as the dominant method of irrigation,” says Thakkar. The latest official figures show that more than 60% of India’s 62 million irrigated hectares is fed by groundwater.
With no regulation, this has obvious perils. In August, two independent studies used satellite data from GRACE or the Gravity Recovery and Climate Experiment to show that northern India was losing more groundwater than anywhere else in the world except for the Arctic ice sheets. One of the studies put the annual net groundwater loss in Punjab, Haryana and Rajasthan at 109 cubic km, which is roughly equivalent to 109 billion tonnes. The water table has dropped dramatically in many areas and this is one of main problems Indian agriculture faces today.
Thakkar identifies four urgent policy measures: “Ensure that our old water recharge systems are sustained and enhanced, develop new recharge systems and harvest water where it falls, regulate groundwater use and, lastly, massively promote conservation methods like drip irrigation and rice intensification.”
Shah, who has been asked by the Prime Minister to write a paper for the National Development Council on a holistic water policy, says it's possible for agriculture to grow even as water use falls. “In Australia, water consumption in agriculture has reduced by 30% in the past 20 years. If they can do it, so can we,” he says.
But for that to happen, water policy has to become participatory. “The irrigation department, which is managed by civil engineers, needs to recruit people managers who understand local needs and sentiments,” concludes Shah.
It will make all the difference to a thirsty nation and parched fields.
TOTAL AREA IRRIGATED BY CANALS 1991-92: 17.8 mn hectares 2006-07: 16.8 mn hectares Amount spent on irrigation projects from 1991-92 to 2006-07: Rs 1.3 lakh crore
INFLATION IN IRRIGATION Nagarjunasagar project (AP) Original cost (pre-fifth Plan):
Rs 91.12cr Latest estimates*: Rs 1,184cr Increase: 1299%
Western Kosi canal (Bihar) Original cost: Rs 13.49cr Latest estimates: Rs 904cr Increase: 6701%
Barnar (Bihar) Original cost (in seventh Plan): Rs 8.03cr Latest estimates*: Rs 216.23cr Increase: 2689%
- All ‘latest estimates’ as on 2003, according to Planning Commission document
Monsoon: floods
Every monsoon means flood of bad news
Shobhan Saxena | TNN 2010
In the great plains of India, there is nothing romantic about the monsoon. People’s fate depends on the monsoon’s mood swings. If it fails to keep its date with the country, there is drought. If it’s over generous, the floods cause death and destruction. Even when it’s “normal”, some river somewhere exceeds the danger mark and kills a few hundred people. After the skies clear and the water recedes, armies of mosquitoes and bugs launch attacks. Millions fall prey with chills, cramps, fever. In this part of the world, drought, deluge and death are as much an annual phenomenon as the monsoon.
Bangladesh may be famous for its notorious floods, but India is not far behind. Every year, the monsoon floods leave a trail of destruction in India. Roughly 20% of deaths caused by flooding worldwide occur here; some 30 million people are evacuated every year. Every year witnesses an “unprecedented flood”. Every other year the “worst flood in living memory” leaves scores dead. Is India becoming ever more vulnerable to monsoon fury?
No, say Vinod K Sharma and A D Kaushik of the National Centre for Disaster Management in a recent paper on floods in India. They argue that states did not appear quite as vulnerable as before because there was less developmental activity and population pressure. “However, in the present time, unabated population and high rate of developmental activities forced on the occupation of flood plains has made the society highly vulnerable to flood losses,” they wrote.
In 2009, the monsoon was weak and deficient but it caused floods, deaths and displacement in Orissa, Kerala, Karnataka, Gujarat and the north-eastern states. In 2008, the monsoon was normal, but Bihar faced the worst flood crisis ever as the Kosi breached its embankment, changed course and deluged several districts, leaving hundreds dead and three million homeless.
‘Normal’ monsoons
2009-18: normalcy is a myth
February 12, 2020: The Times of India
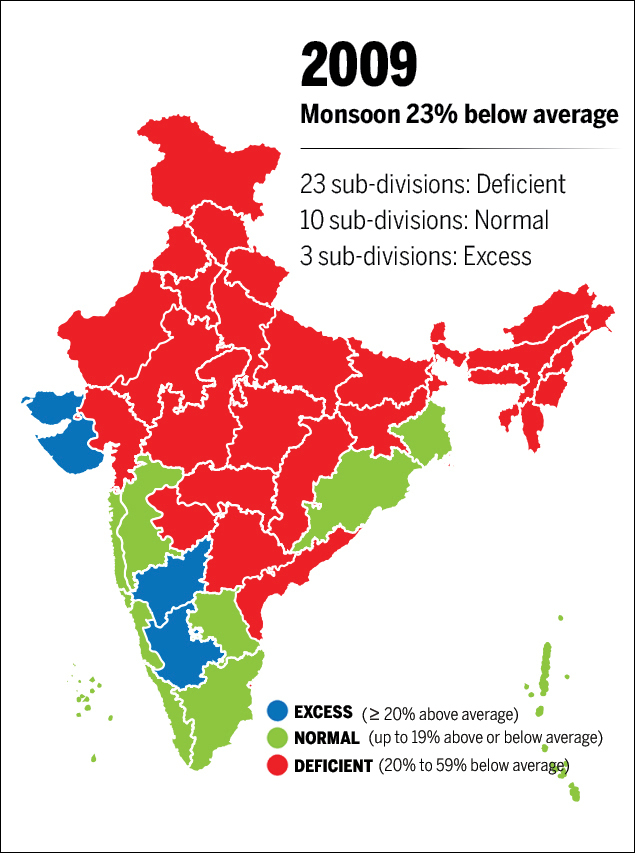
From: February 12, 2020: The Times of India
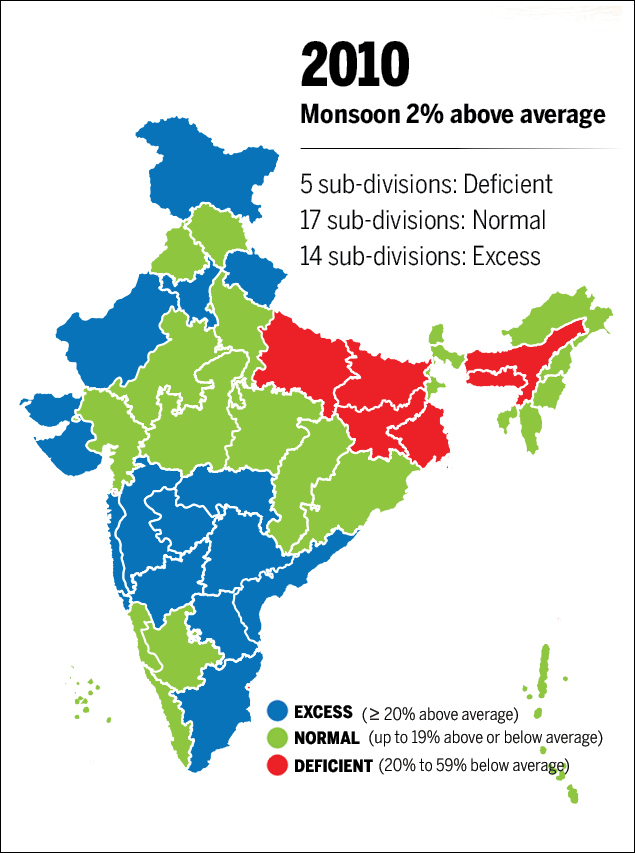
From: February 12, 2020: The Times of India
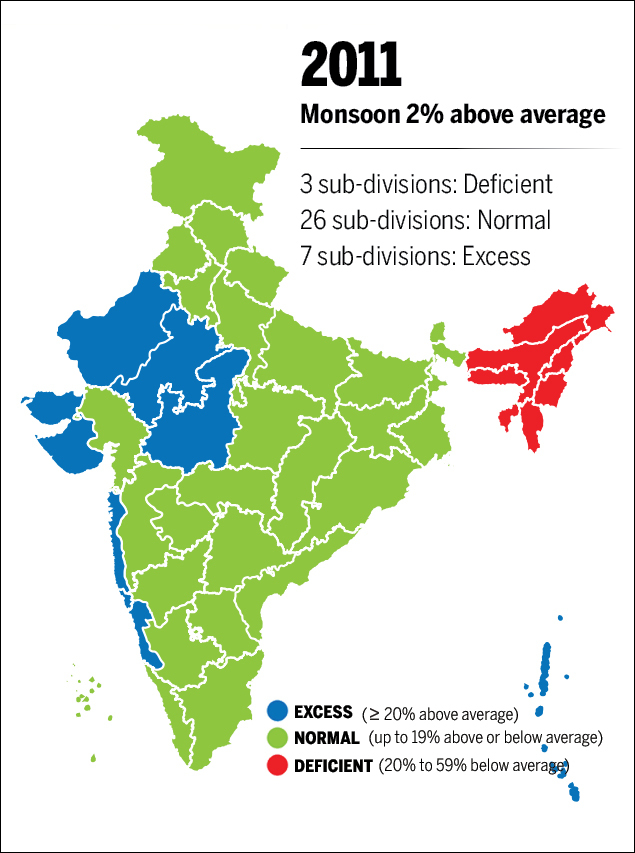
From: February 12, 2020: The Times of India
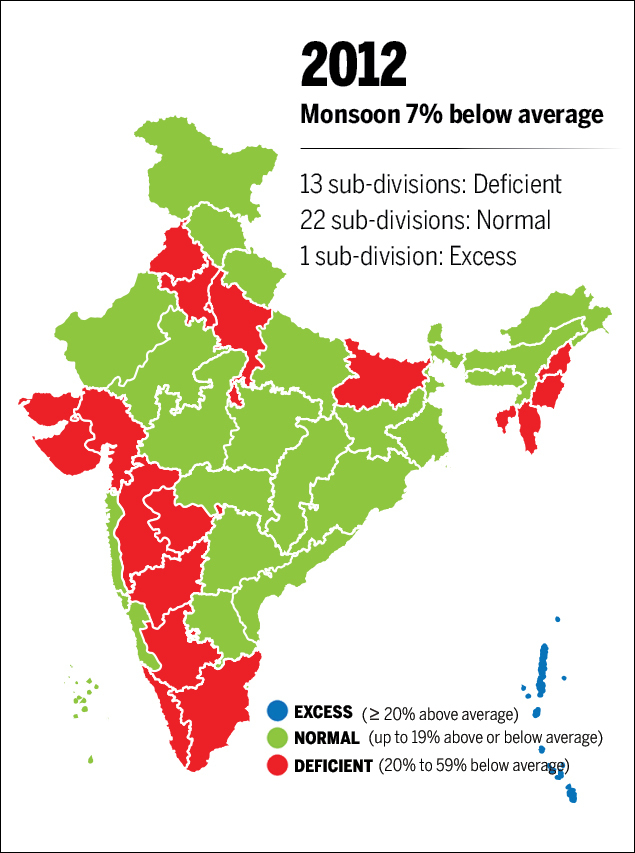
From: February 12, 2020: The Times of India
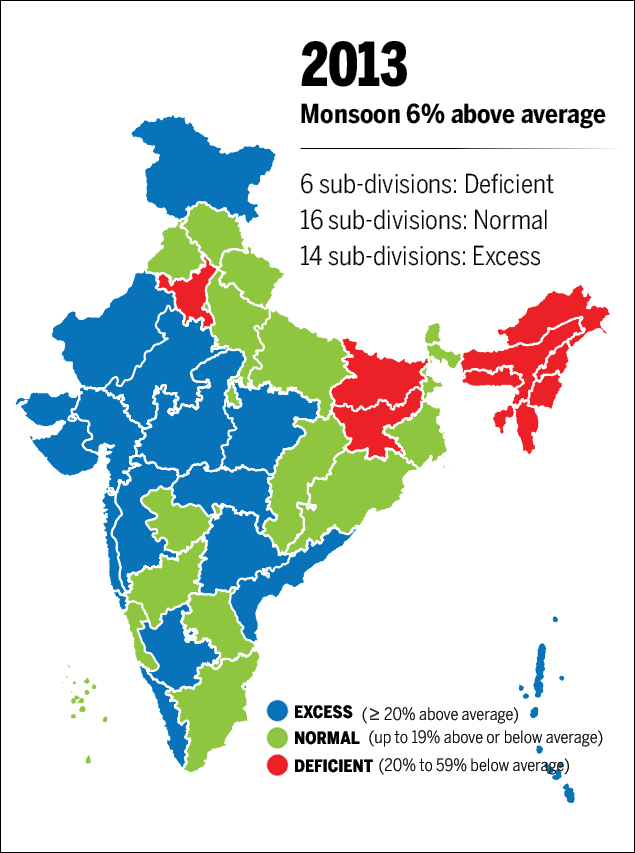
From: February 12, 2020: The Times of India
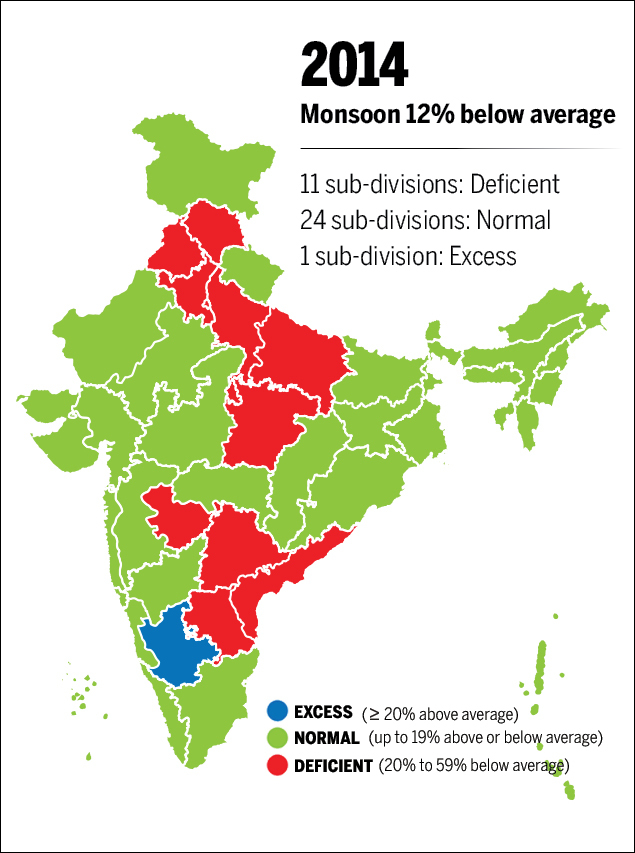
From: February 12, 2020: The Times of India
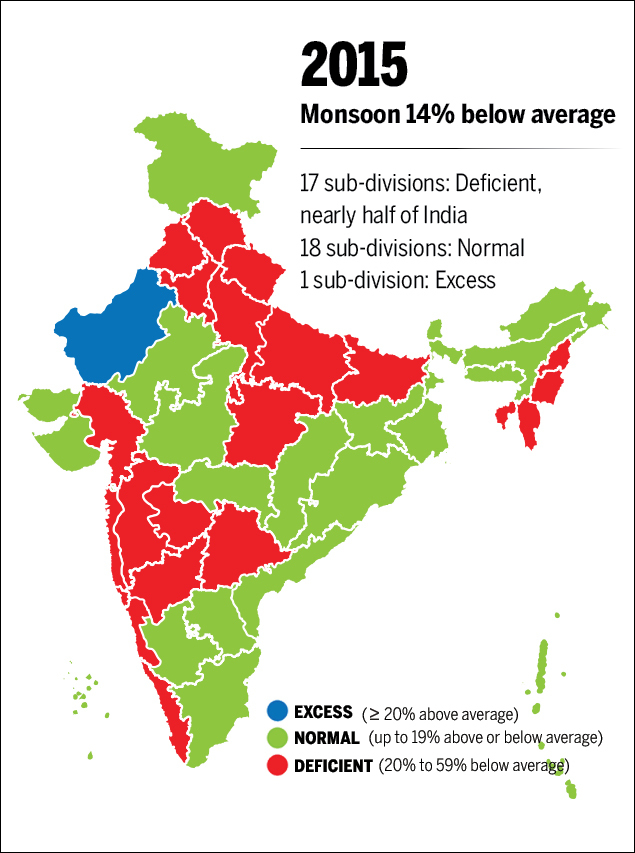
From: February 12, 2020: The Times of India
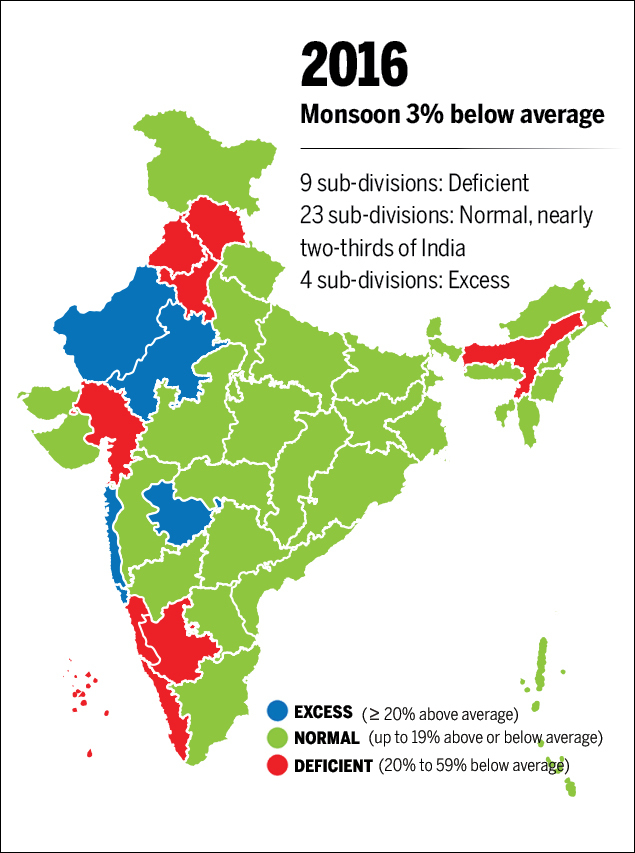
From: February 12, 2020: The Times of India
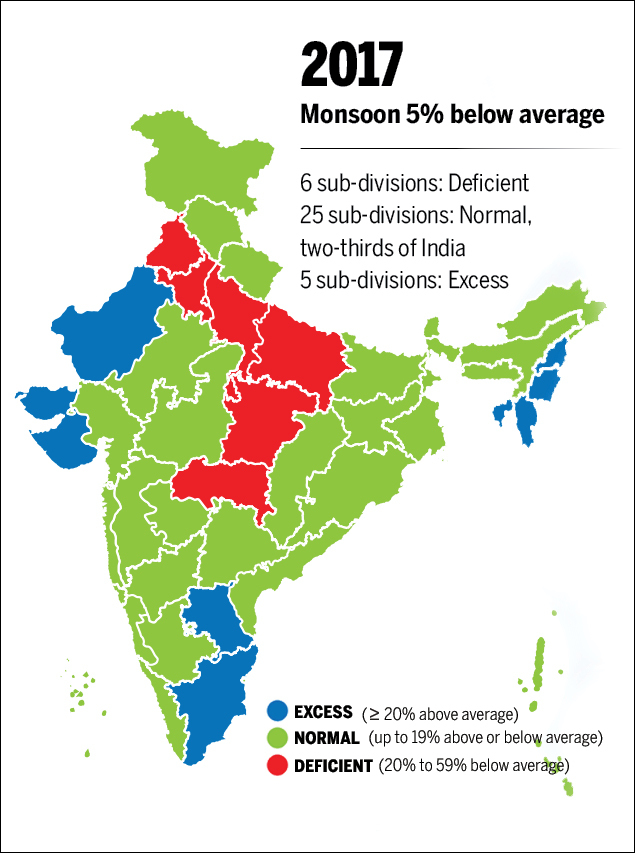
From: February 12, 2020: The Times of India
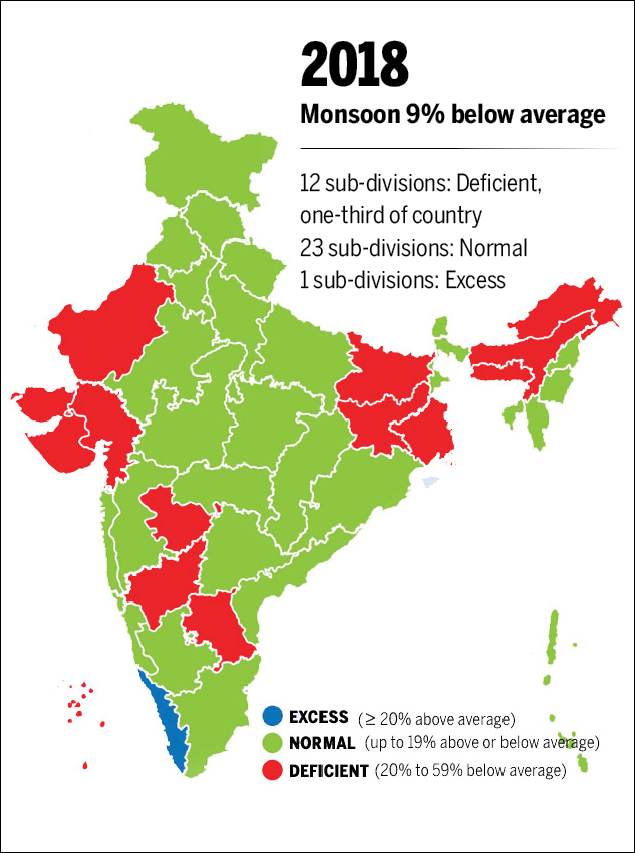
From: February 12, 2020: The Times of India
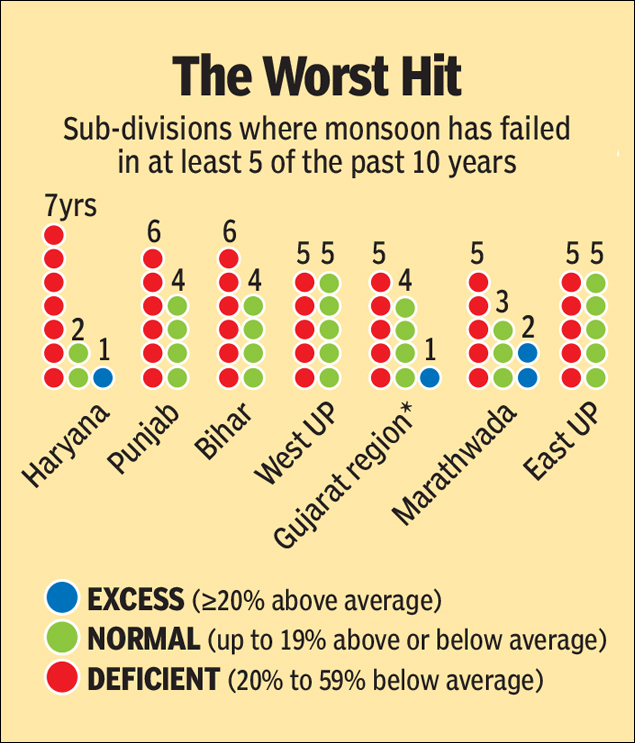
From: February 12, 2020: The Times of India
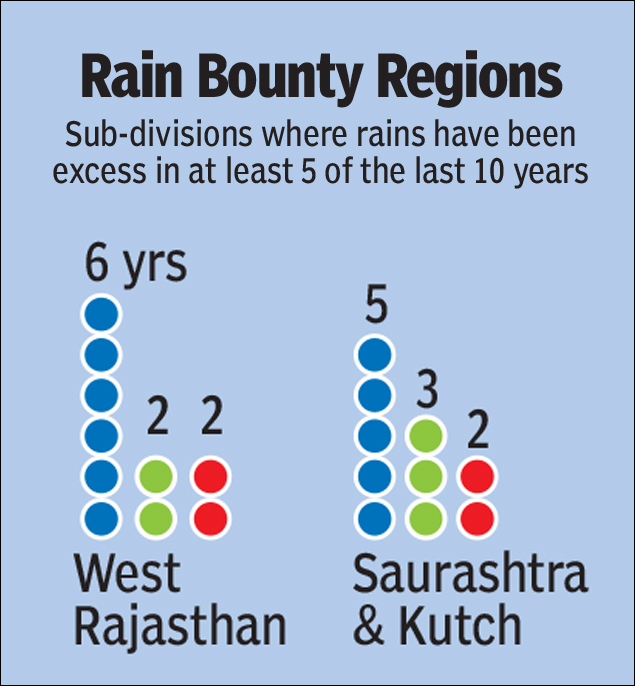
From: February 12, 2020: The Times of India
The Indian Meteorological Department (IMD) said the country is likely to have a ‘near normal’ monsoon this year at 96% of the Long Period Average (LPA) -- an encouraging signal for farmers and the overall economy.
A normal monsoon is considered to be 96-104% of the LPA of 89 cm for the entire four-month season beginning June to September. Above-normal is 104-110%, below-normal is 90-96% and deficient (drought) is below 90%. LPA is defined as the average annual rainfall over a 50-year period between 1951 and 2000.
Of the past 10 years, India's crucial monsoon rain has been below normal in six years. IMD divides the country into 36 meteorological sub-divisions, mostly corresponding with state boundaries, with bigger states being divided into 2 or 3 sub-divisions, based on climatological uniformity. In poor monsoon years, some 6-7 sub-divisions suffer more than others, the data shows. On the brighter side, two of India’s driest regions have received relatively good rains during this period.
A look at the monsoon pattern from 2009-2018:
2009
An El Nino year that saw the weakest monsoon and the worst drought in 37 years, in which 23 sub-divisions received deficient rains.
2010
2010 was a vast improvement from the previous year; 14 subdivisions (in blue) had excess rainfall.
2011
Probably the best monsoon year of this period with the most well-distributed rainfall. No subdivision apart from the northeast (in red) had deficient rains.
2012
Monsoon came under the shadow of a warming Pacific although El Nino did not develop. Thirteen sub-divisions received deficient rains in 2012 and only Andaman & Nicobar Islands saw a surplus. 2013
The strongest monsoon of the period, with the earliest onset in decades over north India. Cloudbursts caused the deluge in Kedarnath, Uttarakhand. Swathes of blue across the country meant 14 regions received more rain than initially expected.
2014
A drought year with monsoon hit by evolving El Nino conditions that didn't eventually form. After several years of poor monsoon, the northeast received normal rains, but 11 regions saw a deficit.
2015
An El Nino year that lead to the second straight drought year. Agriculture output dipped and water shortages abounded. Poor rains struck 17 sub-divisions, this included the west coast. Rajasthan, in blue, was the only area that got excess rains. 2016 First normal monsoon in three years saw good rains in central India. Agriculture output grew after a two-year lows . Four regions saw excess rainfall. 2017
It was a below-normal monsoon year with most of the north and parts of central India in rain shadow. Five sub-divisions saw excess rains, while more than two-thirds of India, or 25 sub-divisions, had normal rains.
2018
2018 was the second below-normal monsoon year in a row. However, rains were better distributed than in 2017, with north India, for once, getting satisfactory rainfall. Twelve regions saw deficits. Kerala, however, saw excess rainfall which led to devastating floods.
Haryana, Punjab among worst-hit regions
Vidarbha makes news for farmer suicides but rains have failed in the sub-division in just 2 years over the past decade. The story is much bleaker in neighbouring Marathwada.
Most subdivisions in the above list are invariably the hardest hit during weak monsoon years.
Regions that received excess rains
Konkan and Goa, India’s second wettest sub-division had excess rains in four of the past 10 years, increasing the threat of floods, particularly in Mumbai.
Surprisingly, two of India’s driest regions have clocked excess rainfall on most years since 2009. Average rainfall in West Rajasthan is just 263.2mm during June-Sept, making it the driest sub-division of India. Saurashtra and Kutch is at No. 4 (average rainfall 477.5mm).
How accurate are weather forecasters?
IMD's forecast for 2019 directly challenges the prediction of India's only private sector weather forecaster, Skymet, which is slightly more pessimistic with a forecast of 93%. Both the IMD and Skymet have hit the bull's eye an equal number of times in the last six years. IMD was off the mark in 2014, 2015 (which turned out to be drought years) and 2018, which narrowly escaped a drought.
2019/ New norms
Vishwa.Mohan , Sep 29, 2019: The Times of India
Every year, the weather department benchmarks that season’s rainfall against a ‘normal’ derived from long period average (LPA) of 50 years. This has now been revised downward from 89 cm to 88 cm.
“The LPA of 88 cm is the new normal. The India Meteorological Department will release its final monsoon report using this new normal,” Madhavan Rajeevan, secretary, ministry of earth sciences, told TOI. The IMD had arrived at the 89-cm figure based on average rainfall during 1951-2000 period. The new average figure of 88 cm is based on rainfall during 1961-2010 period, reflecting a decline in average rainfall in India.
’19 monsoon set for ‘above normal’ tag
The IMD has five categories to tell the ‘status’ of monsoon. Rainfall range of less than 90% of the LPA normal is considered ‘deficient’; 90-96% of the LPA is called ‘below normal’, 96-104% of the LPA is categorized as ‘normal’, 104-110% of the LPA as ‘above normal’ and more than 110% as ‘excess’. “The five categorisations will, however, remain the same. Only LPA has changed,” said the MoES secretary.
Rajeevan added that the 2019 monsoon was most likely to be ‘above normal’ as this year the country got more rain “because of positive Indian-Ocean Dipole (IOD)”. IOD is a sea surface warming phenomenon also called ‘El Nino of the Indian Ocean’. On the new LPA normal, he said the IMD had already started using it for its daily rainfall report. “It changes the ‘normal’ roughly every 10 years or so and starts using it whenever the data of all meteorological stations get updated using the new 50-year period,” said Rajeevan.
110% in 2019
Amit Bhattacharya , Oct 1, 2019: The Times of India
New Delhi: India experienced its first excess monsoon in 25 years, with the season officially ending with a countrywide rain surplus of 10% on the back of a once-in-100-years rain surge in September that threw all forecasts off target.
September ended with a staggering 52% higher-than normal rainfall. As hinted by TOI on Monday, this was the wettest September the country has seen since 1917 and the second wettest in IMD’s records since 1901.
Overall, this was an “excess” monsoon year, which is defined as June-September rainfall at 10% or more above the long period average (LPA). The season ended with a countrywide rainfall of 968.3mm against a normal of 880.6mm, which is the highest since 1994 — the last time India had an excess monsoon — when 1,001.6mm was recorded.
The intense rains in September, and in August to a lesser extent, clearly came as a surprise because none of long period forecasts captured it. The India Meteorological Department, the country’s official monsoon forecaster, had predicted a normal monsoon with seasonal rainfall at 96% of LPA (4% below LPA). The forecast had a 4% error margin on either side. In the event, the monsoon ended 10% higher than the upper end of the forecast.
Private forecaster Skymet was even wider of the mark, having forecast a below-normal monsoon with season’s rainfall pegged at 93% of LPA.
Both IMD and Skymet had correctly forecast a pick-up in monsoon’s performance in the second half of the season (August-September) but came nowhere close to gauging the magnitude of rainfall.
The big gaps between actual rainfall and the forecasts in the regions highlights the extremely hazardous nature of long range monsoon forecasts, which undertakes the scientifically challenging task predicting rainfall over a period of four months. “IMD correctly forecast the large scale features impacting the monsoon. We forecast that El Nino will dissipate by July and that conditions in the Indian Ocean will become favourable with the dipole turning positive,” said D Sivananda Pai, IMD’s lead monsoon forecaster.
Number of rainy days…
…in a typical June, July or August
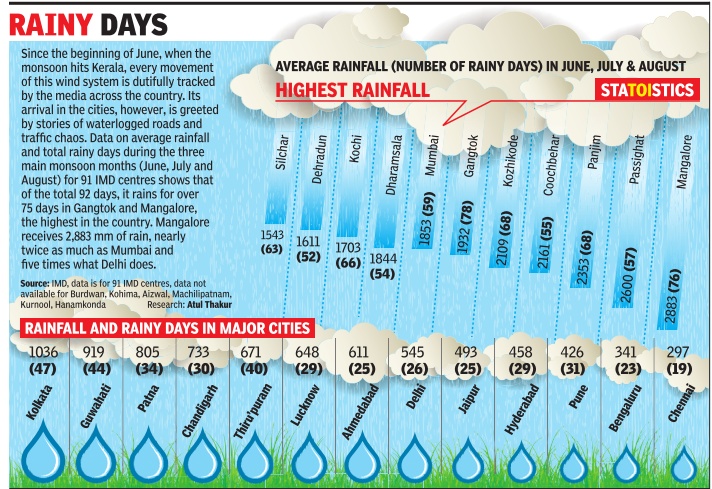
Graphic courtesy: The Times of India
See graphic, ' Average monsoon rainfall and number of rainy days in major Indian cities, and towns with the highest rainfall in India, in June, July, August '
…in June, July and August, 2015
The Times of India, May 30 2015

India receives most of the rainfall in four monsoonal months-June, July, August and September. The Met department defines normal monsoon to be 96 to 104% of the long period average, usually the average monsoon over 30 years. If the rainfall deficiency is more than 10%, it would typically be called a drought year. Last year's monsoon was deficient by 12%. This year's monsoon rainfall is predicted to be 93% of the average. If this year's monsoon deficiency crosses 10%, it will be one more year of drought, making it two successive years of drought, an event that has happened only three times in the past 113 years (1904-05, 1965-66 and 1986-87). In 1917, monsoon exceeded normal by the highest percentage (22.9) in 113 years. In 1918, monsoon was deficient by 24.9%, the highest deficiency for this period
‘Neutral’ years
1997-2017: vis-à-vis El Nino, La Nina years
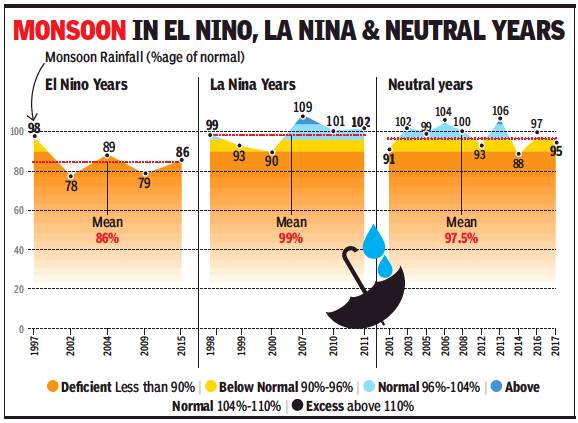
From: Amit Bhattacharya, In ‘neutral’ years, monsoon isn’t always normal, April 17, 2018: The Times of India
Neither El Nino nor La Nina is expected to impact the monsoon this year, the met department said on Monday. While such ‘neutral’ years are generally associated with normal rainfall, a look at the past 21-year record shows a wide variation in monsoon’s performance.
From 1997 to 2017, there were 10 neutral years during which the monsoon varied between 88% of average (drought) to 106% (above normal). On the whole, the mean monsoon performance during these neutral years was 97.5% of the long period average (LPA), which is in the lower end of the normal range (96%- 104%) — indicating that monsoons have been generally depressed in the current era.
The mean monsoon output in the neutral years, however, is way above that of El Nino years (86%) and below the mean for La Nina years (99%). These differences highlight the strong connection of the Indian monsoon with El Nino and La Nina, which are opposite conditions in the Pacific Ocean.
El Nino is an abnormal warming of surface waters in the east and central equatorial Pacific which negatively impacts the monsoon. La Nina is the opposite — an abnormal cooling of waters that aids the monsoon. As the 21-year data shows, there are years when this relationship doesn’t hold.
However, the monsoon’s performance varies significantly during the neutral years as well. These variations are a result of many other local and large-scale factors. Among the large scale factors is the Indian Ocean Dipole (IOD), which is expected to be weakly negative during the second half of this year’s monsoon. A positive Indian Ocean Dipole phase is seen to generally aid the monsoon while a negative phase could depress rains.
Another highly unpredictable condition with sharp, although short, impacts on rainfall is the Madden Julian Oscillation (MJO), a periodic eastward moving weather disturbance close to the equator. MJOs can depress or enhance rainfall for a week or two, depending on their position and strength. Slow-moving or stationary MJOs can have longer impacts. A well-positioned MJO can invigorate the monsoon while its absence tends to prolong breaks in monsoon rains. MJOs, however, are very hard to predict.
Finally, the distribution and intensity of monsoon rains comes down to the number of low-pressure systems and depressions coming inland from the Bay of Bengal. During active monsoon periods, the frequency of these systems are usually high. On some occasions, even winds from the northwest (western disturbances) affect rainfall.
The interplay of all these factors make monsoon forecasting a highly hazardous profession.
In 2015
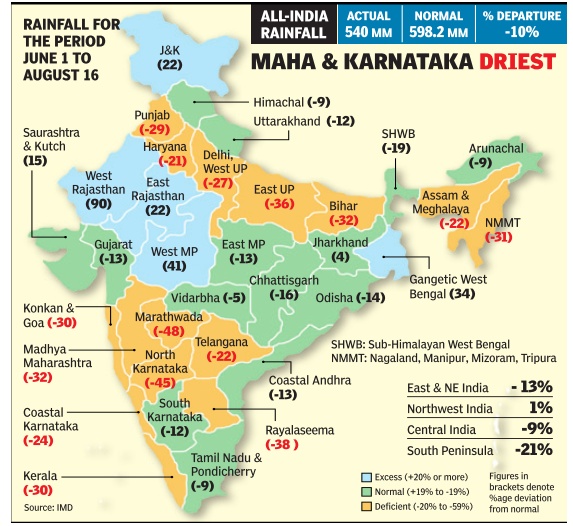
See graphic:
Rainfall, June 1-August 16, 2015
Pre-monsoon rainfall
2009-19
Neha Madaan, June 2, 2019: The Times of India

From: Neha Madaan, June 2, 2019: The Times of India
See graphic, 'Pre-monsoon rainfall in India: 2009-19'
2019: India’s 2nd driest pre-monsoon since 1954
Neha Madaan, June 2, 2019: The Times of India Rains delayed, India sees 2nd driest pre-monsoon in 65 years
With the onset of monsoon around the corner and only 99mm of rainfall so far, the country is experiencing the second driest pre-monsoon spell in 65 years, India Meteorological Department (IMD) data shows. Since 1954 — when the country experienced 93.9mm of rainfall in the pre-monsoon season of March, April and May — showers have dipped below the three-figure mark only in 2009 (99mm), 2012 (the driest at 90.5mm) and 2019 (99mm).
The highest deficiency has been witnessed in Madhya Maharashtra, Marathwada and Vidarbha in Maharashtra, Konkan-Goa, Gujarat, Saurashtra and Kutch, coastal Karnataka, Tamil Nadu, and Puducherry, among others.
Parts of Jammu and Kashmir, Himachal Pradesh, Uttarakhand, western Uttar Pradesh, north interior Karnataka, Telangana, and Rayalaseema (in Andhra Pradesh) also recorded deficient pre-monsoon rainfall, though it was better than what the entirety of Maharashtra experienced.
Pulak Guhathakurta, head of Climate Application and User Interface at IMD’s Office of Climate Research and Services, told TOI that past research has revealed a trend of dipping premonsoon rainfall over the past century in western India, especially Maharashtra. “However, such a trend has not been observed across the entire country till now. This may have something to do with the shifting of the rainfall pattern,” Guhathakurta said.
He said pre-monsoon rains were mainly important for agriculture, groundwater recharge and to maintain soil moisture. "Pre-monsoon rains tend to allay some of the severe water shortage problem in a region. Even deficient pre-monsoon rainfall can go a long way in maintaining the soil moisture necessary for agriculture. Over the past 11 years, Maharashtra got most of its monsoon rainfall in just one or two months, with heavy to very heavy showers in short bursts. This poses a flood risk and also, much of the water is wasted," he explained.
"In the four regions of the country, the maximum premonsoon rainfall deficiency has been witnessed in the southern peninsula (-48% ), followed by northwest India (-29%), Central India (-17%) and east and northeast India (-12%). Parts of north Rajasthan, northern and central MP, southern UP, southern Punjab and Haryana, had good rains,” Anupam Kashyapi from IMD, Pune, said.
Monsoons in Mumbai
‘Extremely heavy’ rain days
2009-19
Richa Pinto , Sep 29, 2019: The Times of India

From: Richa Pinto , Sep 29, 2019: The Times of India
The city recorded as many as five “extremely heavy” rain days this monsoon, when over 200mm of downpour lashed the city within a 24-hour span and disrupted daily life. The numbers are worrisome—and worthy of Swedish 16-year-old climate activist Greta Thunberg’s attention when one considers that the eight preceding “extremely heavy” rain days occurred over a stretchedout period of a decade, from 2009 to 2018.
“The overall trend in the last decade shows an increase in extreme heavy rainfall events not only in Mumbai but all over the country, which is an impact of climate change,” said R V Sharma, former deputy director general of IMD Mumbai. Mumbai’s Monsoon 2019 began on an unusual note: Rains arrived in the city on June 25—one of the most delayed onset dates in 45 years—against the traditional deadline of June 10. Moreover, it has been characterized by unusual weather patterns—one day saw a downpour of 350mm—that have been discussed at several levels, including BMC commissioner Pravin Pardeshi’s office during “debriefing” sessions for civic engineers.
Weather scientists say rains have been “hyperactive” in 2019 but aren’t sure if this is a one-off occurrence or could become a pattern. K S Hosalikar, deputy director-general (western region), IMD, has another observation: On the five “extremely heavy” rainfall days, the downpour was restricted to a few hours. For instance, the city got 200mm of rain in the six hours between 11.30pm and 5.30am on July 2. On September 4, around 121mm of rain was recorded between 8.30am and 11.30am. “Most rain received this year were either in the ‘very heavy’ or ‘extremely heavy’ rainfall categories. At a time when we are talking of climate change and global warming, the first thing to occur is the increase in precipitation and that too in short spells, which we are seeing happen now,” he said.
It is to escape the flooding caused by such intense downpours that 66-year-old Surindra Khubchandani moved from his flat in Jay Bharat society, Khar, to 15th Road, Santacruz. “Here, floodwaters drain out faster,” he said.
As not many Mumbaikars can move homes like Khubchandani, the BMC has held brainstorming sessions on how to work around these intense downpours.
A special report on ‘Oceans and Cryosphere’ released by Intergovernmental Panel on Climate Change (IPCC) warned that extreme sea level events that took place once in a century would occur every year by mid-century in several regions, increasing the risk of flooding in low-lying coastal cities. Akshay Deoras, a PhD student in the department of meteorology, University of Reading, UK, blamed “cyclonic circulations” around the city for the extremely heavy rainfall. Monsoon has been almost “hyperactive” this year, he said. Mahesh Palawat, vice-president, Meteorology And Climate Change of Skymet Weather Services, concurred: “This year saw an extreme weather event every month.”
In July, weather scientists noticed the building up of numerous weather systems affecting Maharashtra and particularly north Konkan (which includes Mumbai) and Goa. “Many low-pressure areas formed over the Bay of Bengal and traveled in the westerly direction while they usually travel northwest,” said Palawat.
Former IMD official Sharma said while “breaks” in monsoon have been common, there was no long break this year. Sridhar Balasubramanian, associate professor, department of mechanical engineering and associate faculty IDP Climate Studies, IIT Bombay, said, “We cannot avoid extreme weather events but at least control the way water reaches the right source. Our cities are seeing increasing concretisation and that will affect the local cloud pattern. Soil is getting depleted and not able to hold the rainwater. The water therefore just runs down and unless the sun comes out, it evaporate.”
2019: suburbs receive far more rain than central, southern Mumbai
Richa Pinto, August 17, 2019: The Times of India
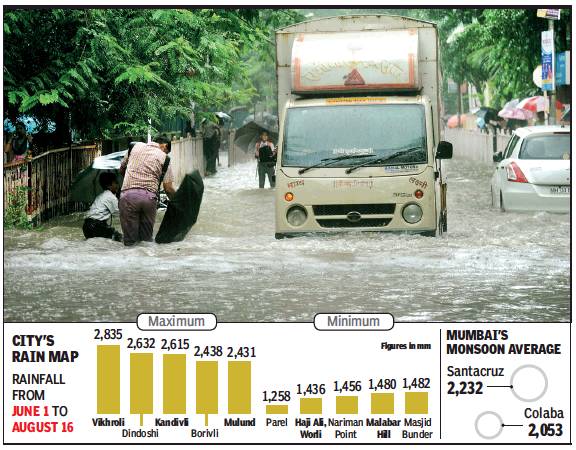
From: Richa Pinto, August 17, 2019: The Times of India
The monsoon has been marked by extreme rain days this year, with some areas of Mumbai recording over 400 mm of rainfall over 24 hours. But the pattern has not been uniform. Rain data from the onset of the rainy season till now shows that suburban areas like Vikrohli, Dindoshi, Kandivli, Borivli and Mulund have recorded the maximum rain in the city, while Mumbai’s central and southern parts have received less rain in comparison (see graphic).
The weather bureau and climate experts said this has a lot to do with the topography and layout of the suburbs, like hills and large green areas, and the presence of water bodies. In comparison, they said, the island city has more built-up area and less green cover. Wind patterns, too, differ. “Climatologically also, city-side rainfall is less than in the suburbs. Besides, the other core reason for suburbs witnessing more rainfall is local topography. The Sanjay Gandhi National Park, the Aarey Milk Colony are all large expanses of green, the equivalents of which don’t exist in the island city. Then there are water bodies like Powai lake as well,” said K S Hosalikar, deputy director general (western region), India Meteorological Department.
As a result, clouds are observed more towards the suburbs whenever there is a weather system over central India. “Hills influence weather and the Konkan belt is a perfect example of orographic enhancement of rainfall (orographic lift occurs when an air mass is forced from a low elevation to a higher elevation as it moves over rising terrain). In Mumbai’s case, hills such as those within the national park, although not as high as in the Western Ghats proper, massively enhance rainfall in the suburbs,” said Akshay Deoras, an independent meteorologist and doctoral student at the University of Reading, UK. “Enhancement is often visible when suburbs’ seasonal or sub-seasonal rainfall is compared to that of south Mumbai, which mostly has a flat terrain.”
Retreat/ Withdrawal of monsoons
North India
2023: September 25
TNN, Sep 26, 2023: The Times of India
NEW DELHI: Marking the beginning of its retreat from the country, the monsoon started withdrawing from parts of southwest Rajasthan, against its normal date of departure on September 17, the India Meteorological Department (IMD) said. The withdrawal began on a day when the overall monsoon deficit in the country further reduced to 5%, down from 11% in the first week of September.
The late retreat of the four-month long monsoon is the 13th consecutive delayed withdrawal.
It’s onset over Kerala this year happened on June 8, against the normal date of June 1. The monsoon season technically ends on September 30, but the withdrawal process normally continues till mid-October.
Although the retreat has begun, the monsoon rally continues in other parts. September has so far seen a 16% rainfall surplus in the country.
Announcing the beginning of its delayed withdrawal by eight days this year, the IMD noted that the withdrawal fulfilled all three required meteorological conditions such as no rainfall during the last five days in the region, formation of an anti-cyclonic circulation at lower tropospheric levels and dry weather conditions based on water vapour imagery.
Meanwhile, the Met department predicted sporadic light to moderate and heavy rainfall in different states till September 29 — the situation which may bring the overall monsoon closer to normal. The IMD had initially predicted a ‘normal’ monsoon this year at 96% of the long period average (LPA) with an error margin of +/- 4%.
It had, however, later indicated it to be ‘below normal’ (90-95% of the LPA) based on the huge monthly deficit of August. Monsoon rainfall between 96-104% of the LPA (average rainfall in the 1971-2020 period) is considered ‘normal’.
The monsoon, however, revived spectacularly in September, bringing the overall cumulative deficit from 11% early in the month to 5% on Monday. The revival is attributed to conditions in the Indian Ocean turning favourable (a positive Indian Ocean Dipole) and a favourable phase of Madden-Julian Oscillation (MJO) — an eastward moving pulse of cloud and rainfall near the equator — known for increasing convection in the Bay of Bengal and the Arabian Sea.
Delhi
2010-19
Jasjeev Gandhiok, Oct 11, 2019: The Times of India

The retreat of the monsoon in Delhi, 2010-19
From: Jasjeev Gandhiok, Oct 11, 2019: The Times of India
The monsoon officially retreated from the capital — 10 days later than “normal”. Delhi recorded an overall rain deficit of 38%, data from the meteorlogical department showed. This is also only the third time since 2010 that the monsoon retreat has been delayed beyond September 30.
In both 2018 and 2017, the monsoon officially started retreating from Delhi on September 30, whereas it was delayed by over a week in 2016 (October 7). The delay was the longest in 2013, when the retreat was declared on October 17.
Delhi recorded 404.1mm of rainfall this season — well below the normal of 648.9mm. “There has been an overall rain deficit of over 200mm this monsoon season. This makes it a deficit of 38% and, despite a prolonged monsoon, not much recovery happened in September,” an official said.
In fact, Delhi recorded a rain deficit in all four months of June, July, August and September. The monsoon reached Delhi a week late this year (July 5) against the normal date of June 29, meaning there was an 83% rain deficit that month alone. Only 11.2mm of rainfall was recorded against a normal of 65.5mm.
In July, 210.4mm was received compared with a normal of 276.1mm (24% deficit) and, in August, 119.6mm was recorded against an expected 247.4mm (52% deficit). In September, Delhi received 74.1mm of rainfall as compared with a normal of 125.1mm (41% deficit).
Kuldeep Srivastava, scientist at IMD, said following the retreat, northwesterly winds were affecting Delhi now, with stubble burning likely to play a part in the air quality. An anti-cyclonic formation over Rajasthan may also influence Delhi in the coming days.
Delhi’s maximum temperature on Thursday was recorded at 33.9 degrees Celsius, while the minimum was 20.7 degrees Celsius. Humidity levels oscillated between %36 and 93% in the last 24 hours. The regional meteorological department has forecast “hazy” conditions in the morning for the next few days with the maximum and minimum temperatures likely to hover around 34° and 21° C, respectively.
2010- 2020
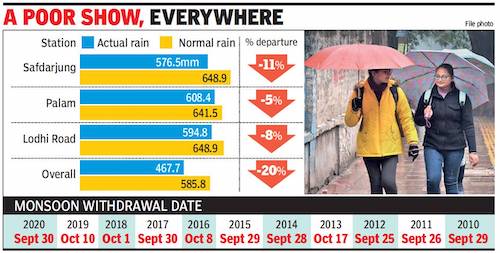
From: Priyangi Agarwal, October 1, 2020: The Times of India
See graphic:
The withdrawal date of Monsoons in India, 2010- 2020
2019
Most delayed retreat on record
Amit Bhattacharya, Oct 10, 2019: The Times of India

From: Amit Bhattacharya, Oct 10, 2019: The Times of India
The southwest monsoon finally began its retreat from the country, nearly 40 days later than the normal date, in what is by far the most delayed monsoon withdrawal in met department records going back to 1960.
The India Meteorological Department declared that monsoon had withdrawn from parts of Punjab, Haryana and north Rajasthan. From here on, monsoon is likely to make a swift retreat from north and central India, it said.
The most delayed monsoon withdrawal recorded before this year was in 1961, when the monsoon began its retreat on October 1. This year, active conditions till late in the season, including a low pressure system that came in from Bay of Bengal in September end, kept monsoon going.
IMD said conditions were now becoming ripe for monsoon to further withdraw from more parts of northwest India, including Delhi, during the next two days. In the subsequent twothree days, the rain-bearing system may retreat from the remaining parts of northwest India as well as central India, the department said.
“With the retreat process having begun, we are likely to see a quick withdrawal of monsoon,” said Mrutyunjay Mohapatra, IMD’s director general of meteorology. The withdrawal was announced after persistent anti-cyclonic circulation and gradual reduction in moisture — the two essential conditions for monsoon’s retreat — were observed, the IMD said.
“The reversal of wind direction is likely to reduce humidity and lead to a drop temperatures in north India,” Mohapatra said. The monsoon typically begins to withdraw from west Rajasthan, retreating incrementally from the north and then central India in a process spread over a month-and-a-half.
2020: 13 days late
October 28, 2020: The Times of India
Southwest monsoon withdraws, 13 days after normal schedule
NEW DELHI: The southwest monsoon finally withdrew from the entire country on Wednesday, 13 days after its normal date of final withdrawal. With the final withdrawal, the India Meteorological Department (IMD) said the northeast monsoon, a phenomenon that brings rainfall in extreme south peninsular India, has commenced. Analysis of withdrawal dates of southwest monsoon from the entire country during 1975-2020 period shows that the 2010 had seen the most delayed withdrawal on October 29.
Like this year, the withdrawal date in 2016 was also October 28 while 2000 and 2017 had seen it on October 25. Predicting weather conditions during next few days, the IMD said, “Scattered rainfall with moderate thunderstorm and lightning is very likely over Kerala, Maharashtra, Tamil Nadu and Puducherry during next five days with isolated heavy falls over south Tamil Nadu on October 29.”
2023: 4 days late
Oct 20, 2023: The Times of India
New Delhi : The southwest (summer) monsoon withdrew completely from the country, four days after the normal date of October 15 and the northeast (winter) monsoon rainfall activity is likely to commence over the southern peninsular region in the next 72 hours, the India Meteorological Department said.
The initial phase of the winter monsoon in general is, however, likely to be weak, added the Met department, even as it has already predicted overall ‘normal’ rainfall for winter monsoon in Peninsular India during October-December. Onset of summer monsoon over Kerala this year happened on June 8 against the normal date of June 1 whereas it had started withdrawing from northwest India on September 25, eight days after the normal date.
Due to prevailing El Nino conditions (warming of sea surface temperatures in the central and eastern tropical Pacific Ocean that negatively impacts monsoon), the four-month summer monsoon (June-September) this year reported ‘below normal’ rainfall at 94.4% of the long period average (LPA). It was, however, very close to being categorised as ‘normal’ (which figues between 96-104% of the LPA).
The summer monsoon hit the ‘below normal’ tag this year after reporting four consecutive years of good rainfall in either ‘normal’ or ‘above normal’ category during 2019-22.
YEAR-WISE DATA
1901-2013
1901-2013: There are two detailed, year-wise graphics elsewhere on this page.
Years of excessive rain and most deficient rain in monsoon season, 1901-1945
and
Years of excessive rain and most deficient rain in monsoon season, 1946-2013
1988-2019: the wettest July-Aug
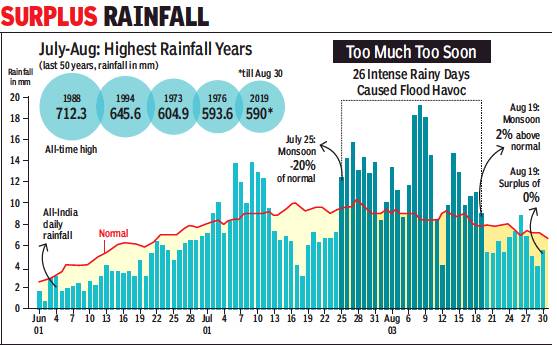
July-Aug rainfall in 2019.
From: Amit Bhattacharya, August 31, 2019: The Times of India
See graphic:
The wettest July-August between 1988 and 2019
July-Aug rainfall in 2019.
2009-18
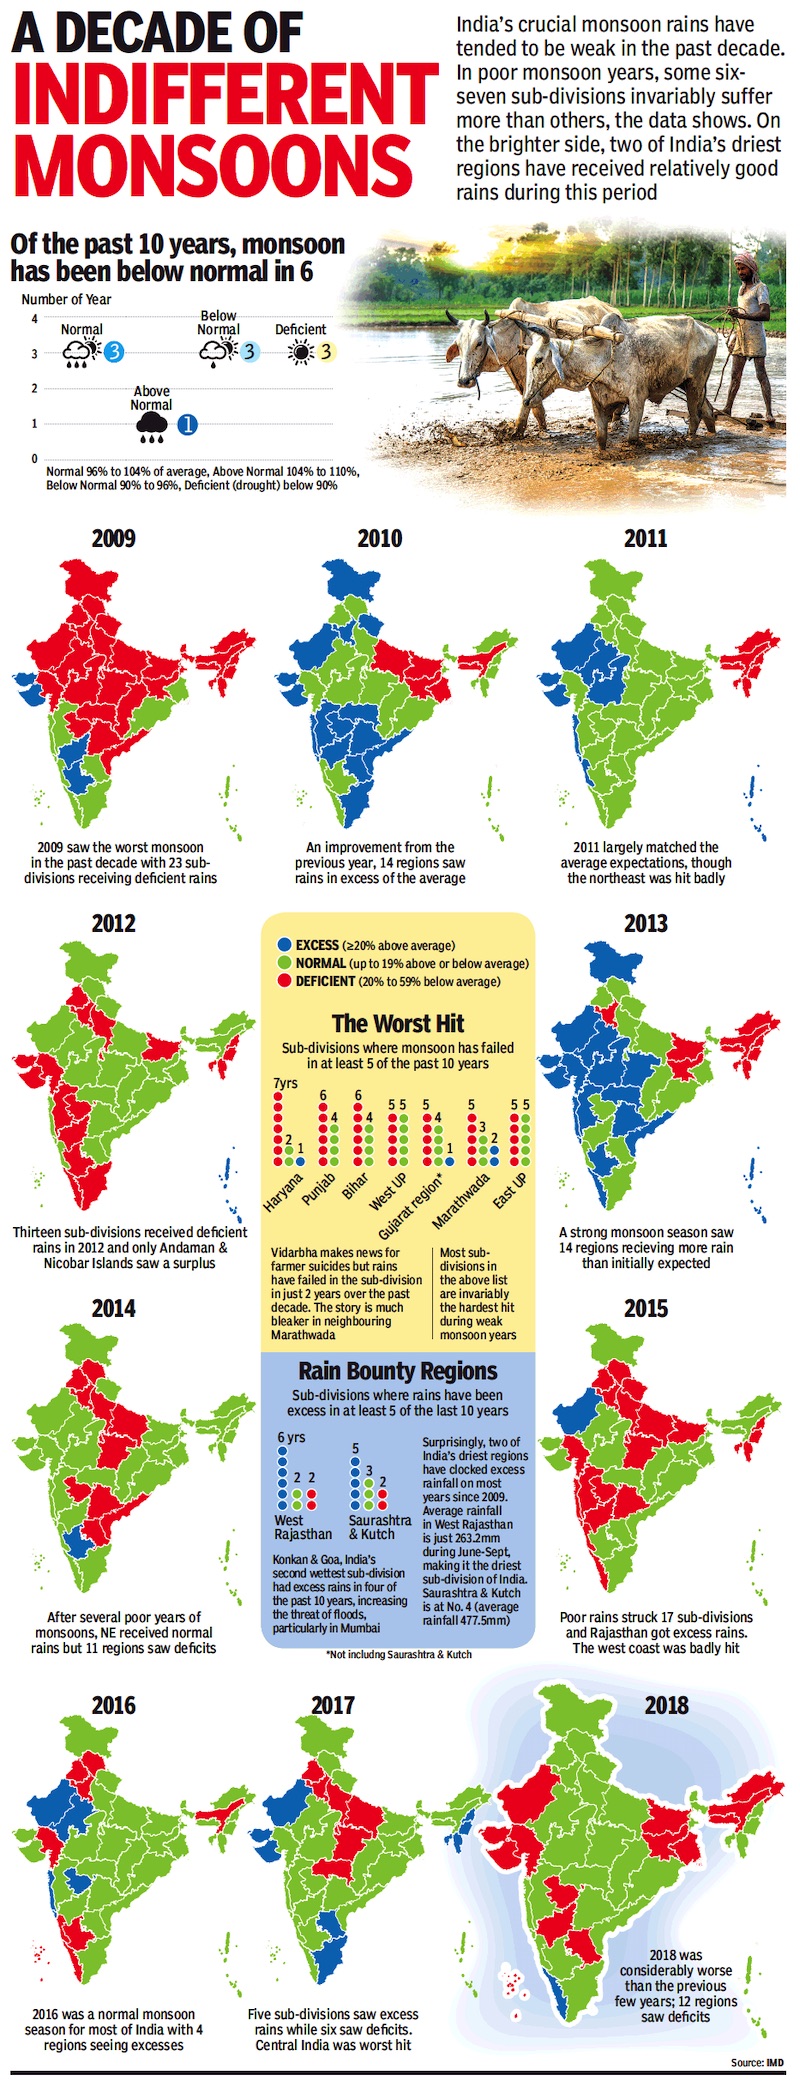
From: April 16, 2019: The Times of India
See graphic:
Years of excessive rain and deficient rain during the monsoon season, 2009-18
2010-19: rainfall received
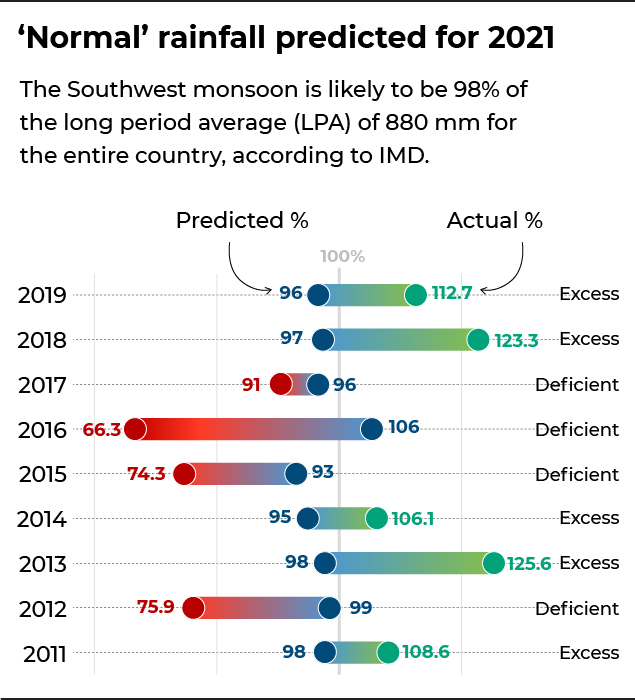
From: Sudha Nambudiri, May 18, 2021: The Times of India
See graphic:
2010-19: rainfall received during the monsoon, as percentage of the long-period average.
2012, 2014-17: deficit monsoons
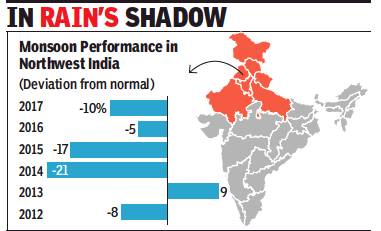
From: Amit Bhattacharya, After 4 bad years, IMD says north India to get good rains, June 1, 2018: The Times of India
The India Meteorological Department’s forecast of a normal monsoon in northwest India will bring cheer to the crucial agricultural region, where rainfall has been below-par for four years in a row. If the forecast holds, northwest India is in for its first no-deficit monsoon since 2013.
In its region-wise monsoon forecast released on Wednesday, IMD predicted 100% seasonal rainfall in northwest India, a region comprising J&K, Himachal Pradesh, Punjab, Haryana, Delhi, Rajasthan and Uttar Pradesh. In meteorological terms, 100% corresponds to rains that are exactly normal.
Being farthest from the seas, northwest India is at the tail end of the monsoon system, which arrives here after traversing the rest of the sub-continent. That’s why the normal monsoon season rainfall here is 615mm, way lower than the country’s normal of 887mm for the June-September period.
In recent years, however, monsoon in the northwest has been mostly below normal. Since 2012, the region received an above-normal monsoon only in 2013, a year that brought disasters of a different kind — cloudbursts and flash-floods in parts of Uttarakhand.
It is said, when monsoon fails in India, it fails spectacularly in the northwest. The drought years of 2014 and 2015 saw gaping monsoon deficits of 21% and 17%, respectively, in the region. Even last year, when the country had a near-normal monsoon, northwest India ended up with a rain shortfall of 10%.
The failing rainfall in recent years has not seriously impacted agricultural output in the region. That’s because farmers still have access to water due to perennial rivers, a good irrigation network and groundwater. However, deficient rainfall takes a big toll on the region’s scarce groundwater resources, which have anyway been depleting at an alarming rate.
Large parts of northwest India fall in the zone that has among the highest rates of groundwater extraction in the world. A bad monsoon puts further stress on this resource while adding to the inputs costs of farmers.
Further, poor winter rainfall in the region this year, particularly in the western Himalayas, has led to reduced levels in north India’s perennial rivers and other water sources. Timely arrival of monsoon and good rains will thereafter will go a long way in alleviating water stress on all fronts.
2013
Monsoon going strong, hopes soar
Rains Set To Cross 100% Of Long-Period Average, Record Rice Output Likely
Neha Lalchandani TNN
The Times of India 2013/08/02
A bountiful monsoon normally benefit the kharif crop and augurs good rice production with the area under sowing touching 196 lakh hectares in 2013, a 16 lakh hectare increase over 2012.
2015
17% rain deficit in July 2015
The Times of India, Aug 02 2015
Amit Bhattacharya, Vishwa Mohan & Neha Madaan
Dry days: 17% rain deficit in July
After a wet June, when other systems had countered the adverse effects of El Nino, monsoon took a drier turn in July and the month ended with a countrywide rain deficit of 17%. However, kharif sowing remained robust, boost ed by good rain spells in sev eral parts of the country . With the dip in rains monsoon's performance in the first half of the season -June 1 to July 31 -was 5% below the long term average June had a monsoon surplus of 16%.
Heavy rains in Gujarat Rajasthan, West Bengal Jharkhand and parts of cen tral India masked the fact that July this year was the driest since 2002 in terms of average rainfall across the country . The month started on a weak note and rains re mained below par till July 19, except for a brief four day period from the 9th.
But there were several redeeming features. “The rainfall, although weak, has been fairly well distributed across most parts of the country ,“ said D Sivananda Pai, head of India Meteoro logical Department's long range forecasting section.
However, some distress zones of low rainfall have started emerging. Rains were consistently weak through July in south India as well as subdivisions such as Marath wada and Madhya Maharash tra. From July 1 till 29, the southern peninsula recorded the highest rainfall deficien cy in the country , at 46%.
“We had forecast an 8% rainfall deficit for July , but it has turned out to be more. A typical feature this year has been that most rain-causing disturbances have been com ing from the east. Indian Ocean's monsoon circulation has been weak, which means that the monsoon pulses are not progressing from the south, which has caused a significant rainfall deficiency in the southern parts,“ a Met department official said.
However, rains in the north, most parts of central India and many regions of the east were close to normal.This is reflected in the kharif crop sowing figures. The overall sown area has, so far, been far ahead of the corresponding figures last year, which was a bad monsoon year.
The area under kharif as on Friday (July 31) was still less than what was reported at this time in 2013, when rains were plentiful in the monsoon months. As compared to 819.99 lakh hectares as on August 2, 2013, the kharif sown area this year was 764.28 lakh hectares as on July 31.
The monsoon is predicted to be active through the first week of August, raising hopes that the net sown area would grow in the coming days.
Several agencies, howev er, have predicted a relatively dry period in the country after the first week of August when the monsoon could go into a break, increasing the overall rain deficit.
In its monsoon update in June, IMD had forecast a 10% rain deficit in August. The department will issue another update for the second half of the season in a day or two. It had in June predicted a drought year, with overall seasonal rains at 12% below normal. Meanwhile, private forecaster Skymet downgraded its prediction for the season from 102% to 98%, still staying within the normal range.
PM explores ways on sugar exports
M Modi called for renewed P efforts to raise ethanol blending of fuel and exploring all possibilities for sugar exports as he brainstormed with key ministers and officials to resolve the problems faced by the sector.He reviewed the progress with regard to the Rs 6000 crore incentive package approved by the Centre in June and emphasized that the farmers' interest be kept foremost at all times.
2016
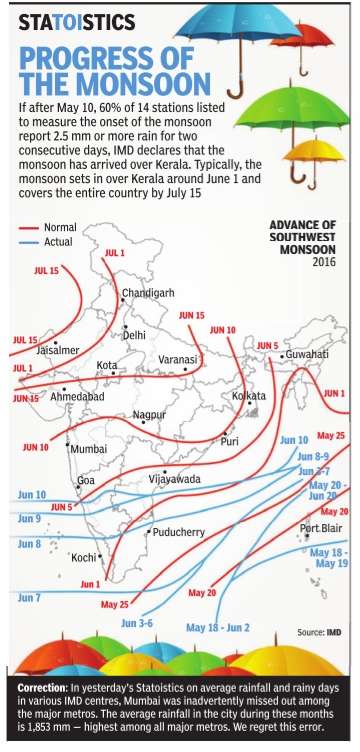
June 2016: 11% Monsoon deficit
The Times of India, July 01, 2016 Amit Bhattacharya
11% monsoon deficit in June
Monsoon remained slightly below expectations in the first month of the rainy season as June ended with a countrywide deficit of 11%, mainly on account of a delayed onset. Despite the deficit, however, rains have been in the normal to excess range in around two-thirds of India's 36 meteorological subdivisions. “The deficit in June was mainly due to the eight-day delay in monsoon's onset. It progressed well after that but did not perform as expected in central India.But the shortfall should be made up in July ,“ said D Sivananda Pai, lead monsoon forecaster at the India Meteorological Department.
The Met department expects rains to pick up in July , the most crucial month of the season for kharif sowing.Monsoon's performance in July is also important for water recharge as it accounts for almost a third of the total seasonal rainfall. By contrast, June normally gets only around 18% of the total monsoon rains.
“The monsoon hit the country only on June 8. So, we have got just about three weeks of monsoon rains so far. By that measure, an 11% shortfall is well within range,“ said B P Yadav, director, IMD. Among the meteorological regions of the country , south India received the best rain bounty , with 22% excess rains in June.Although the monsoon is yet to arrive in many parts of northwest India, the region had just a2.4% rain shortfall because of fairly good pre-monsoon showers in states such as Punjab.
The highest shortfall was in east and northeast India, where June ended with a 27.3% deficit. The performance wasn't totally unexpected because the region is predicted to receive less rains this year.
The region where monsoon has been more or less disappointing is central India, which had an 18.2% deficit in June. Except for Konkan and Goa, Marathwada and west Madhya Pradesh, rainfall has been less than average in all subdivisions of the region.
While Odisha and east MP are expected to get rains in the next days, other subdivisions in the region where the deficit is high -Gujarat and Madhya Maharashtra -may have to wait a few more days for good rainfall, Met officials said.These areas too would get good monsoon showers in July , they added. “In the next few days, monsoon activity is likely to be concentrated in northwest India and adjoining parts of central India. We expect monsoon to hit Delhi, Haryana, Punjab and more parts of UP and Rajasthan in the next two-three days,“ said Yadav.
Deficit hampers kharif sowing
The Times of India, Jul 02 2016
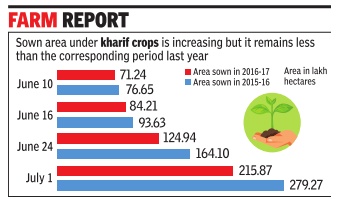
Vishwa Mohan
Deficit rainfall hampers kharif sowing in June 2016
Deficit monsoon rains in June has affected the overall kharif sowing operation in the month, keeping the sown area low as compared to the corresponding period last year but the area under paddy has shown improvement for the first time this season as compared to 2015-16.
Kharif sown area data, released by the agriculture ministry on Friday , put the total area at 215.87 lakh hectare as on July 1 as compared to 279.27 lakh hectare at this time last year. However, the paddy recorded marginal increase by covering 47.77 lakh hectare so far this year as compared to 47.62 lakh hectare in 2015-16.
Sowing operations, which remained sluggish during the first three weeks after the onset of monsoon, picked up pace in the past one week due to good rains in south India -covering over 90 lakh hectare under various crops in the past seven days.
“Though the area under kharif crops, including pulses, oilseeds and cotton, is still less than the area during the corresponding period last year due to 11% of deficit rainfall in June, the sowing operation will further pick up in July and hopefully cross the last year's sown area by the end of this month“, said an official.
Areas under pulses and oilseeds will, however, continue to be a major concern.Sown area under oilseeds stands at merely 28.71 lakh hectare as on Friday as compared to 54.24 lakh hectare at this time last year. Similarly, cotton too recorded poor sowing as its sown area stands at 30.59 lakh hectare as compared to 60.16 lakh hectare in the 2015-16.
The availability of water in the country's 91 major reservoirs has marginally increased from 23.20 billion cubic meter (BCM) on June 23 to 23.94 BCM as on June 30 despite constant withdrawal of water from them.
According to the Central Water Commission, Rajasthan, Tripura and Andhra Pradesh have better storage in 2016 than the corresponding period in 2015.
2017
Despite floods, 5% rain deficit
Amit Bhattacharya, Despite floods, India faces 5% rain deficit, August 19, 2017: The Times of India
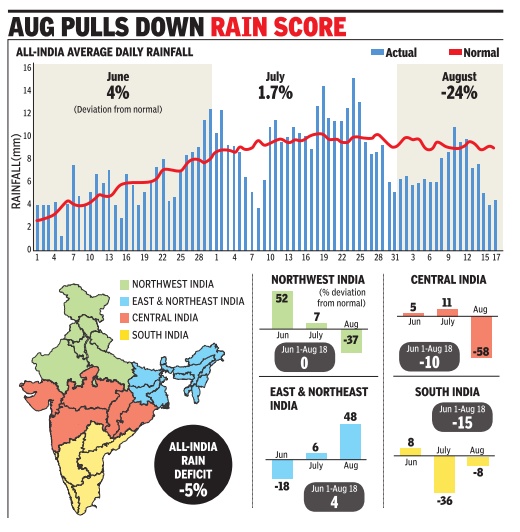
Large Parts Receive Poor Rain In August
The flood fury in Assam, Bihar, Bengal and Uttar Pradesh has taken attention away from poor monsoon rains in large parts of the country in August. The month has so far seen a 24% rain deficit (till August 18), with central India in particular reeling under a prolonged break in the monsoon.
The lull in rains has opened up a huge 58% shortfall in central India, and 37% in the northwest, for the month of August, pulling down monsoon's performance since June 1 to belownormal zone. The overall deficit now stands at 5% of the long period average.
However, the good news is that the monsoon is set to revive, the India Meteorological Department officials said. “By the weekend, the monsoon will become more active as a low pressure system is forming in the Bay of Bengal. We expect the situation in central India, west coast and the peninsula to improve,“ said D Sivananda Pai, head of IMD's longrange forecasting division.
The monsoon went into a break in the last week of July, when a weather disturbance, called Madden Julian Oscillation, appeared in the eastern Indian Ocean and depressed rains over the subcontinent.
“Since then, no low pressure systems formed in the Bay of Bengal. Neither did any storm system move west from the Pacific to aid the monsoon here. There were no impulses from the Indian Ocean either,“ Pai said.
“Now, there's some activity in the Indian Ocean which should progress northward towards India,“ he added.
While central and south are expected to get wet spells in the coming days, northwest India will have to wait to more conducive conditions.
“Northwest may not improve a lot unless there's an interaction of a western disturbance with the monsoon system,“ Pai said.
The three-week monsoon break has led to several meteorological subdivisions becoming rain “deficient“, showing a deficit of at least 20%. These include Haryana, west Uttar Pradesh, east and west Madhya Pradesh, Marathwada, Vidarbha, entire Karnataka and Kerala.In most other parts of India, comprising 26 of the 36 subdivision, rainfall has been normal or excess.
As is usually the case during a break in the monsoon, northeast India and the Himalayan regions continued to get rain in the first half of August, causing rivers to swell and flood the Gangetic plains. East and northeast India region has a 48% rain surplus so far in August, which IMD expects to decrease slightly in the second half. South India, which was the country's driest region in July with a 36% deficit, has had better rains in August. It still has an overall deficit of 16%.
Deficient rainfall brings down kharif sowing
Vishwa Mohan, Deficient rainfall brings down kharif sowing, August 19, 2017: The Times of India
Sending worry ing signals to the farm sector, deficient rains in central and peninsular India have taken toll on the ongoing Kharif (summer crop) sowing operation, bringing down the total acreage as on Friday, as compared to the sown area during the corresponding period last year.
Oilseeds and pulses are the worst hit. It will increase the country's import bill if sowing does not pick up in next two-three weeks. India, in any case, has to depend on imports to meet its domestic demand for these crops.
Latest crop-wise figures, released by the agriculture ministry on Friday , show that the total Kharif sown ar ea as on Friday stand at 976.34 lakh hectares as compared to 984.57 lakh hectares at this time last year -a clear indication that the current crop year (2017-18) may not be as good as 2016-17 in terms of production despite normal monsoon in many parts of the country .
Though the total sown area has dipped below last year's corresponding period level for the first time on Friday this monsoon season, sown area under oilseeds has consistently been declin ing for the past four weeks.
Similarly , pulses too has shown declining trend in past two weeks with sown area under pigeon pea (arhar), moong and soyabean declining by 18%, 6% and 9% respectively as compared to their acreage at this time last year. Sown area under oilseeds stand at 157.36 lakh hectares (LH) as compared to 175.10 LH at this time last year -the highest dip in terms of acreage so far this season.
Less rainfall means poor storage of water and lower acreage in the Kharif season and also during Rabi (winter crop) sowing operation, beginning October. Less moisture content in soil also affects Rabi crops. If low rainfall phase continues in these areas, its effect will be felt on overall production.
235 districts were deficit; after floods came drought
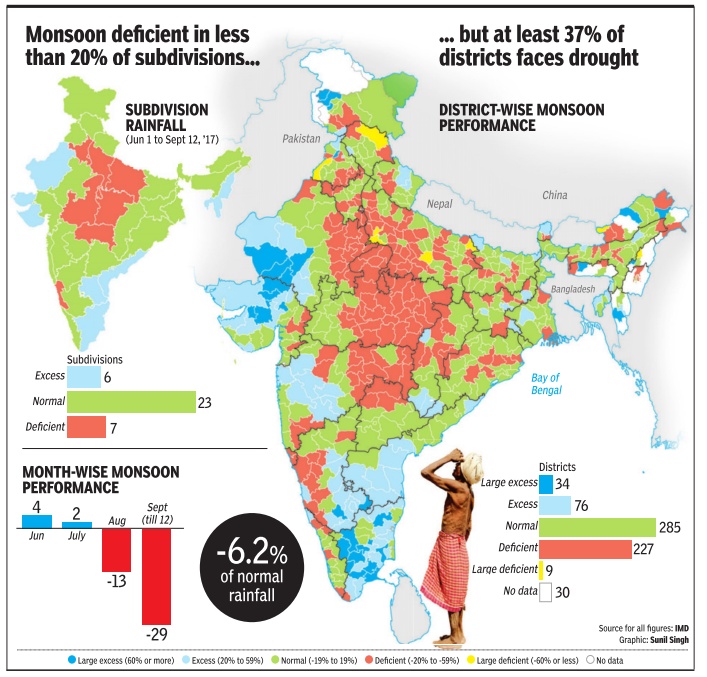
Around 235 districts across the country face the prospect of drought this year as the monsoon appears headed for a below-normal performance, with the season's deficit currently at 6.2% of normal.
These districts, accounting for 37% of the country's 630 districts for which rain data is available, have monsoon shortfall of at least 20%, with nine show acute deficits of 60% or more, data from the India Meteorological Department reveals.
A majority of the distress districts lie in the hinterland, in a swathe running through Punjab, Haryana, Uttar Pradesh, Madhya Pradesh and Vidarbha. Uttar Pradesh, Haryana and MP are the hardest hit states, showing rain deficits of 31%, 28% and 25%, respectively .
The deficits have grown gradually since the end of July, when the monsoon started failing in central and north India. The first two months of the season, June and July , ended with a countrywide rain surplus of 2.5%. Monsoon's performance since August 1 has been a dismal 17% below normal (till September 12), with good rainfall being mainly restricted to south and northeast India.
“A number of factors worked against the monsoon since July-end. There have hardly been low-pressure circulations since then and conditions in the Indian and Pacific oceans have been unfavourable,“ said D Sivananda Pai, head of IMD's long range monsoon forecasts.
IMD had forecast normal monsoon this year at 96% of long period average, which it updated to 98% in June.
Poor distribution of rainfall has added to the distress.As many as 110 districts have had excess or `large excess' (over 60% of normal) rainfall. In addition, heavy rain spells in Gujarat, Rajasthan and catchment areas in the Himalayas (particularly in Nepal) caused the worst floods in the country in 10 years.
Ironically , states such as UP have seen both flood fury as well as the prospect of drought. The monsoon deficit in west UP stands at 37%, highest for any subdivision in the country . Of the state's 72 districts, rainfall has been deficient in 48. Of these, five districts -Agra, Hamirpur, Mahamayanagar, Amethi and Kushinagar -face acute shortfall of 60% or more.
This combination of poor rains and floods is likely to hit kharif output, although data till September 8 reveals that the sowing area this year is only marginally less than last year's, with the biggest drops seen in oilseeds, pulses and jute. Several state governments have reported ly started drought exercises.
Poor rains have affected water storage levels, important for winter crops. According to the Central Water Commission data, live storage at 91 important reservoirs in the country was at 58% of capacity on September 8, lowest in five years for which data was available. It was lower than the corresponding period during drought years of 2014 (74%) and 2015 (59%), and significantly below the 10-year average of 69%.
IMD believes the second half of September could bring better rains in central India. “While the situation in northwest is not likely to change too much, there are indications that central India may get some rain in the next couple of weeks. Monsoon isn't likely to start withdrawing in the next few days,“ Pai said.
Monsoon ends 5% below normal
The southwest monsoon has begun to withdraw from the country , some two weeks later than normal.With just three days to go for the official end of India's rainy season, it is now fairly certain that this year's monsoon will end in the below-normal zone.
The India Meteorological Department announced on Wednesday that the monsoon had retreated from the western parts of Punjab, Haryana and Rajasthan, as well as the northwestern tip of Gujarat.
“We expect the monsoon to withdraw completely from northwest India and adjoining parts of central India in the next two-three days. Dry weather is forecast in the region and there's a substantial drop in moisture levels, making conditions favourable for the retreat,“ said M Mohapatra, head of services at IMD.
He said south India, eastern coast and the northeast will continue to get rain over the next few days. The monsoon's performance so far has been below normal, with the countrywide rain deficit currently at 5.5%. The figure is unlikely to change much in the next three days, when the monsoon season (June to September) ends. This means that the monsoon is most likely to finish in the below-normal range (90-96% of long period average).
That would be a rather disappointing end to the season that had begun with expectations of normal rains. In April, IMD had forecast monsoon to be 96% of normal. It had subsequently updated the prediction to 98% of normal in June. Both forecasts had 4% error margin.
One-third of districts under rain deficit
Amit Bhattacharya, September 30, 2017: The Times of India
HIGHLIGHTS
The overall monsoon shortfall is also showing in water storage levels.
In 2016, too, the monsoon went into a longish break in August.
A normal monsoon in 2016 had led to record foodgrain production.
India received below-normal monsoon this year, with the season ending on a 5.2% deficit on Saturday. While 50% of the country's districts have had normal rains, more than a third — 215 districts — are left with deficient rainfall, which could impact the kharif crop to an extent.
A 'below-normal monsoon', according to the India Meteorological Department (IMD), is when countrywide rains in the season are 90-96% of the long period average (LPA). It is a category above 'deficient monsoon', when rains are below 90% of LPA (as in the drought years of 2014 and 2015).
The majority of the districts in rain distress this year are in Uttar Pradesh, Madhya Pradesh, Punjab, Haryana, Vidarbha and surrounding areas, which were the hardest hit by an unexpected dip in rainfall in the second half of the season.
While the first half (June-July) posted a 2.5% rain surplus, August and September had a combined deficit of 12.5%. The Met department attributes the monsoon's failure in these months to a combination of factors that came into play together.
"A number of storms originated in the northwest Pacific in August, which reduced rain activity over the Indian subcontinent. Conditions in the Indian Ocean too did not boost rainfall during this period," said D Sivananda Pai, head of long range forecasting at IMD. In terms of India's four regions, the northwest had the maximum rain deficit of 10%, followed by central with 6%, and east and northeast with 4%. Rains were normal in south India.
The government's first advance estimate of this year's kharif crop reflects the monsoon's below-par performance, with the estimated production pegged 2.8% below last year's. A normal monsoon in 2016 had led to record foodgrain production.
The comparison with last year, when overall rains were better by just over two percentage points, is interesting. While 10 out of the 36 subdivisions in the country had deficient rains in 2016 — as compared to six this year — there were fewer districts with large rain shortfall. The number of districts with deficient or very deficient rain stood at 199 last year, while this year the number is 215.
In 2016, too, the monsoon went into a longish break in August. However, crucially, the break came later and lasted for a shorter time. This year, the break in the monsoon — when rainfall dips sharply in central India — began around July 26 and continued till the third week of August, a period crucial for kharif sowing.
"There were too many lulls in the monsoon during the second half. Also, the distribution of rainfall was rather poor, with some areas getting too much rain, which led to floods," said Pai. On the brighter side, south India got good rains during August and September, which wiped out the deficits of the previous months.
Some of these subdivisions, such as south interior Karnataka, had seen drought last year. The northeast, too, got good spells of rain in the second half. The overall monsoon shortfall is also showing in water storage levels. According to the Central Water Commission, 91 major reservoirs in the country were at 66% of capacity on September 28. This is just about 89% of the levels in the corresponding period last year, and 87% of the 10-year average.
Monsoon to end below-par as rains begin to withdraw
The southwest monsoon has begun to withdraw from the country , some two weeks later than normal.With just three days to go for the official end of India's rainy season, it is now fairly certain that this year's monsoon will end in the below-normal zone.
The India Meteorological Department announced on Wednesday that the monsoon had retreated from the western parts of Punjab, Haryana and Rajasthan, as well as the northwestern tip of Gujarat.
“We expect the monsoon to withdraw completely from northwest India and adjoining parts of central India in the next two-three days. Dry weather is forecast in the region and there's a substantial drop in moisture levels, making conditions favourable for the retreat,“ said M Mohapatra, head of services at IMD.
He said south India, eastern coast and the northeast will continue to get rain over the next few days. The monsoon's performance so far has been below normal, with the countrywide rain deficit currently at 5.5%. The figure is unlikely to change much in the next three days, when the monsoon season (June to September) ends. This means that the monsoon is most likely to finish in the below-normal range (90-96% of long period average).
That would be a rather disappointing end to the season that had begun with expectations of normal rains. In April, IMD had forecast monsoon to be 96% of normal. It had subsequently updated the prediction to 98% of normal in June. Both forecasts had 4% error margin.
2018
13 Jun- 11 Sept
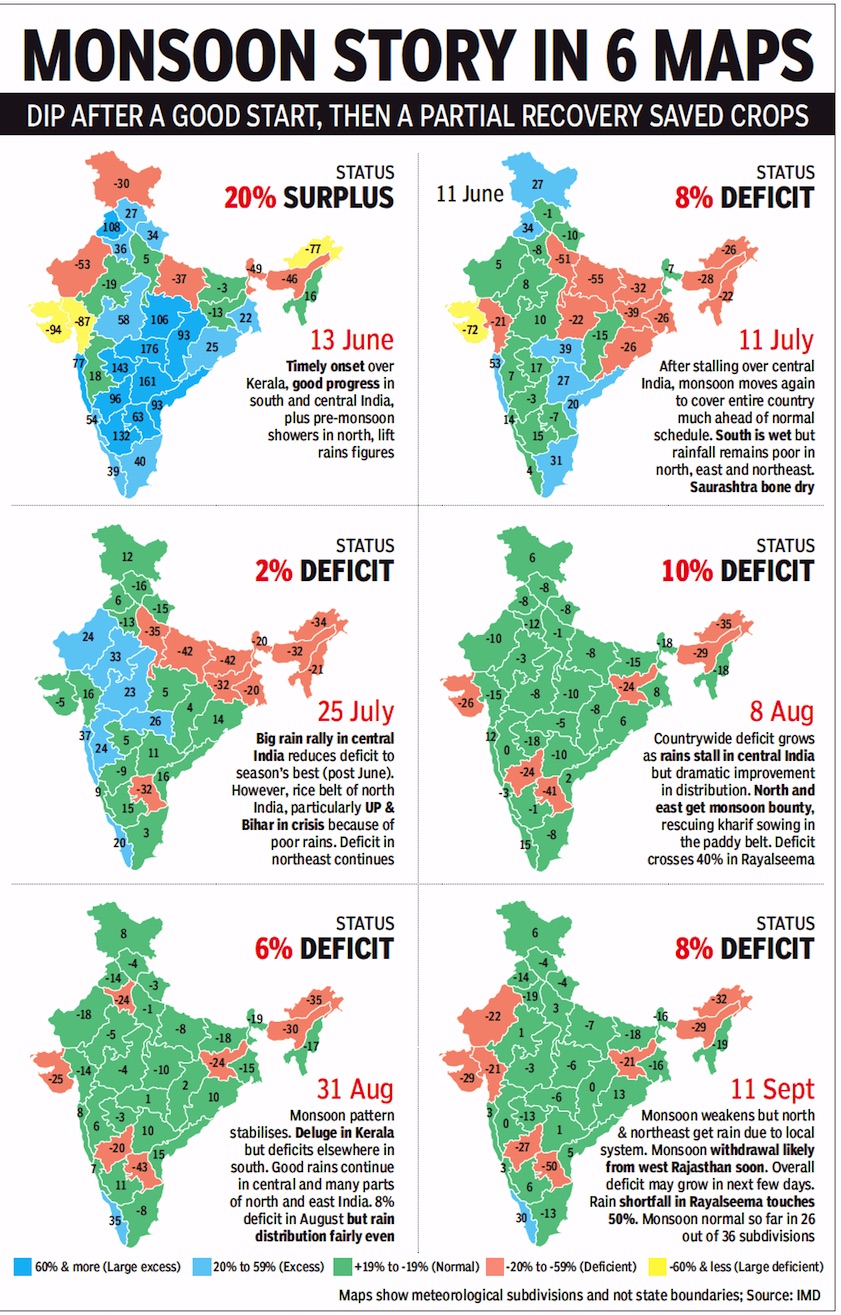
From: September 12, 2018: The Times of India
See graphic:
2018- The progress of the Monsoon in India, 13 June- 11 September, 2018
2018: a district-wise map
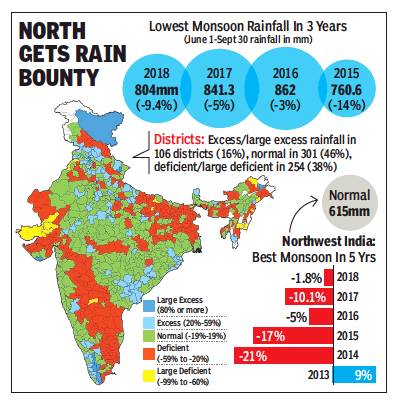
A district-wise map;
2018 vis-à-vis 2015, 16, 17
There was a 9.4% deficit
From: October 1, 2018: The Times of India
See graphic:
Rainfall in India during the 2018 Monsoon
A district-wise map;
2018 vis-à-vis 2015, 16, 17
There was a 9.4% deficit
2018: Sub division-wise actuals
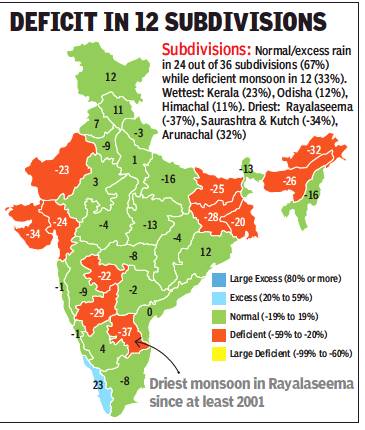
From: October 1, 2018: The Times of India
See graphic:
Rainfall in the 36 ‘sub divisions’ of India during the 2018 Monsoon, till 29 September 2018
June to Sept: Day-wise statistics
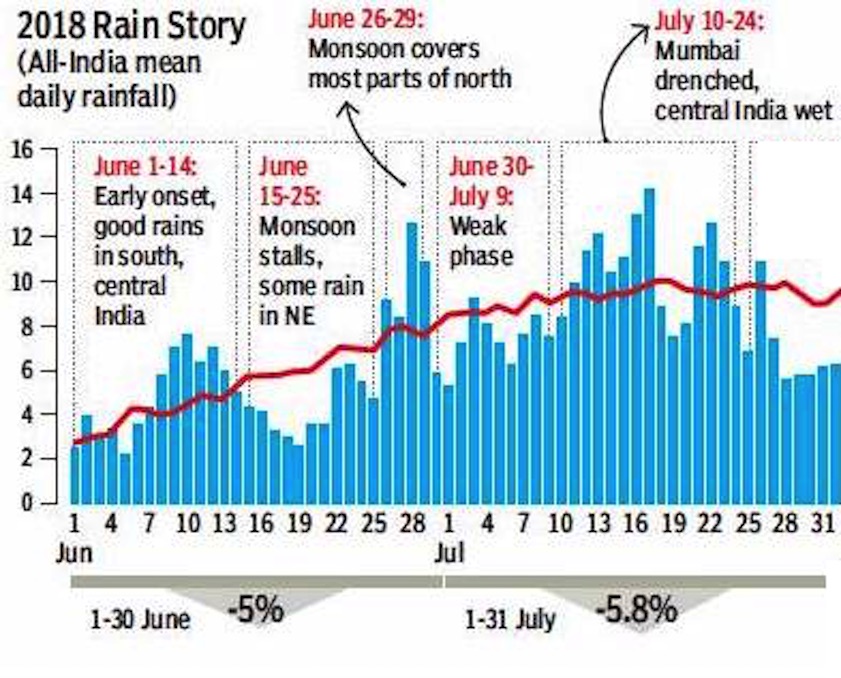
From: October 1, 2018: The Times of India
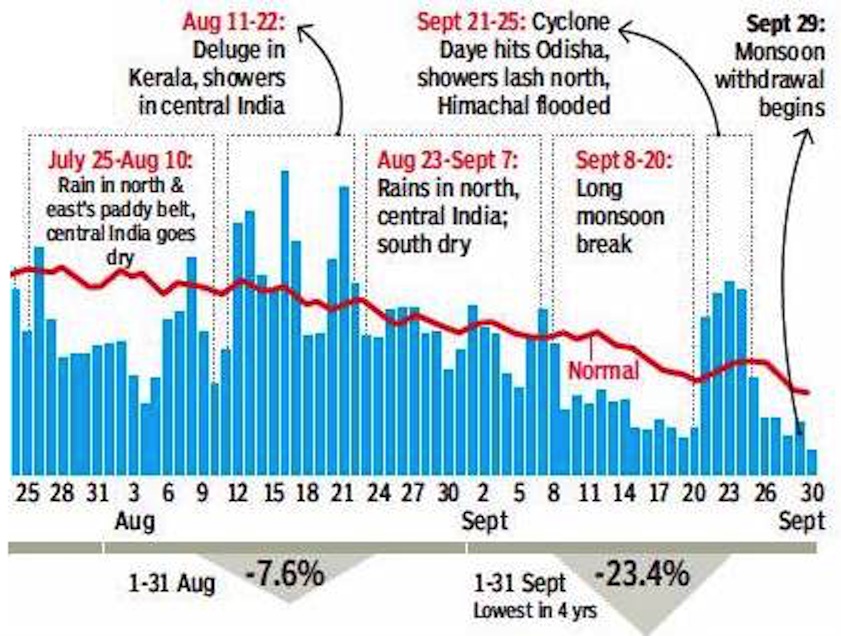
From: October 1, 2018: The Times of India
See graphics:
Rainfall in India during the 2018 Monsoon- Day-wise rainfall, June to July 31
Rainfall in India during the 2018 Monsoon- Day-wise rainfall, July 25 to September 29
2018: variations in IMD’s Sept figures
October 1, 2018: The Times of India
A discrepancy in the rainfall data for September 30 has created ambiguity over the final figure of 804mm monsoon rainfall across the country. The IMD website shows 1.1mm mean countrywide rain on Sunday but credits 3.6mm to the consolidated monsoon figure.
As on September 29, seasonal rainfall in the country was 800.4mm, as per IMD data released on the department’s website on Saturday. An addition of 1.1mm rain on Sunday would make the final monsoon figure 801.5mm. This translates to a deficit of 9.7% from the LPA of 887.5mm, which is usually rounded off to 10%.
IMD’s final figure for this year’s monsoon shows rainfall of 804mm across the country and a shortfall of 9.4%. This implies that Sunday’s rainfall was 3.6mm and not 1.1mm, as shown in the daily rainfall data. IMD officials weren’t available for comment.
2018: 9% deficit/ below-normal
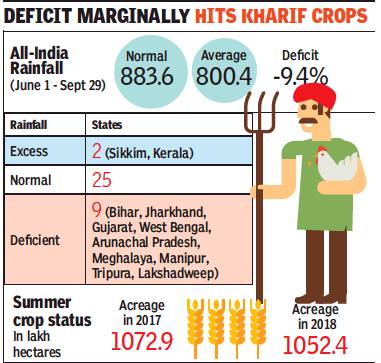
From: Vishwa Mohan and Amit Bhattacharya, With over 9% deficit, monsoon may end in below-normal zone, September 30, 2018: The Times of India
Withdrawal Begins; Oct-Dec Rains In South To Be Normal: IMD
The southwest monsoon which began to withdraw from the country on 29 September, starting from west Rajasthan, is likely to end in the ‘below-normal’ zone this year with a deficit of 9.4% so far.
While the monsoon season rainfall was below expectations, sowing of kharif crops was not majorly affected because of fairly good rain distribution. The acreage under kharif this year is 1.9% less than last year’s and around 0.7% lower than normal.
He told TOI that IMD has in association with IIT Gandhinagar come out with a map, showing soil moisture content across the country as a result of this year’s rains. “The map shows that the soil moisture content in most parts of the country is extremely good. It’s a good sign for rabi (winter sown) crops and the overall farm sector,” said Ramesh.
IMD declared the beginning of monsoon’s withdrawal, nearly a month later than the normal date of September 1. Monsoon wind patterns have receded from some west Rajasthan areas.
2018, monsoon months: 21% of India dry, worse than in last two monsoons
The monsoon in 2018 has left 21.38% area of the country moderately to extremely dry, India Meteorological Department (IMD) data at the end of the fourmonth season shows.
The department’s Standardised Precipitation Index (SPI), an index to monitor drought, showed that the dry conditions this monsoon have been worse than in 2016 and 2017.
This year, 134 districts , the maximum, reported moderately to extremely dry conditions.
This index, negative for drought and positive for wet conditions, showed that 229 districts reported “mildly dry” conditions, a staggering 43.51% this monsoon.
Around 17.78% area of the country reported moderately to extremely dry conditions last year, while 12.28% area reported such conditions in 2016, Pulak Guhathakurta, head of Climate Data Management and Services at IMD, Pune, told TOI.
“This monsoon, the percentage area showing dry conditions has gone up to over 21%, with more than 5.45% area witnessing severely dry conditions and 2.08% reporting extremely dry conditions during the season,” Guhathakurta said.
The latest SPI report released by IMD said the monsoon showed extremely, severely and moderately dry conditions over most districts of Lakshadweep, many districts of Arunachal Pradesh, sub-Himalayan West Bengal, Sikkim, Jharkhand, Bihar, Rayalseema and north interior Karnataka.
One or two districts of Maharashtra, Marathwada and Vidarbha also experienced similar dry conditions this season. Moderately to severely dry districts in Maharashtra included Satara, Solapur, Aurangabad, Jalna and Buldhana. September seemed worse for Maharashtra as extremely to moderately dry conditions prevailed over most districts of Konkan, Maharashtra, Marathwada and other regions of the country.
Maharashtra reported a -1.42 on the index in September this year which is “severely dry”.
Among the other states, the worst performer this monsoon was Lakshadweep with extremely dry conditions, followed by states such as Arunachal Pradesh, Bihar, Meghalaya, Tripura and Jharkhand where moderately dry conditions prevailed.
Guhathakurta said the most affected regions this season were from the northeast, some districts in Marathwada, Maharashtra, Vidarbha, Gujarat, coastal Andhra Pradesh, Telangana, south interior Karnataka and Kerala.
Around 17.8% of the country’s area reported moderate to extremely dry conditions last year, while 12.3% of area reported such conditions in 2016
2019
After slow start, monsoon covers 10 states in 4 days
Amit Bhattacharya, June 24, 2019: The Times of India
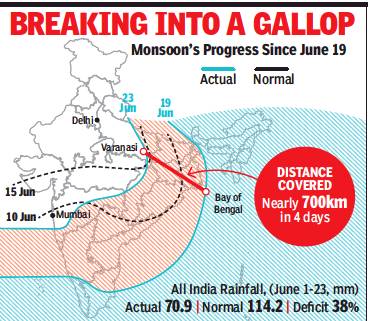
From: Amit Bhattacharya, June 24, 2019: The Times of India
After having made the slowest progress in at least 12 years, the monsoon has broken into a sprint, nearly covering 10 states and entering two more within a span of four days since June 19 while racing into east Uttar Pradesh in the north.
With a low-pressure system giving it wind, the monsoon strode into Varanasi, covering nearly 700km in four days from its position over north Bay of Bengal last Wednesday. The push from the Bay of Bengal arm has led to an unusual situation of the monsoon having reached Varanasi while being still to arrive over Mumbai, which it normally hits by June 10.
“Monsoon is likely to reach Mumbai in a day or two and cover most parts of Maharashtra by June 25, after which the system is likely to go into a brief lull again,” said D Sivananda Pai, IMD’s lead monsoon forecaster.
In the north, monsoon may push a little further into UP before the low pressure system driving it runs out of steam, Pai added.
The rapid strides in the last four days, however, haven’t made a significant dent in the overall rain deficit this month. Monsoon rainfall remains 38% lower than normal this month (June 1 to 23). The deficit has reduced from 44% on June 19, but still remains significantly high due to monsoon’s late onset and slow initial progress.
Marathwada, Vidarbha both receive good rains
Nonetheless, monsoon’s speedy progress this week should come as good news for regions battling drought conditions in central India and parts of the south. Rains over Bihar will also moderate temperatures in the state, leading to a likely drop acute encephalitis cases.
Marathwada and Vidarbha, both battling acute water shortages this summer, were among the regions that received good rain on Sunday. Madhya Maharashtra, Rayalaseema, coastal Andhra Pradesh, Chhattisgarh, Bihar and east UP were the other sub-divisions were monsoon was active. Karnataka, Telangana, west MP and J&K also received some rain.
While monsoon is likely to cover Maharashtra and enter MP and south Gujarat over the next couple of days, its further progress, particularly into most of northwest India, may depend on another low-pressure system coming in from Bay of Bengal. “As of now, there is no sign of a low forming over Bay of Bengal. Many parts of north India may get thundershowers, outside the monsoon system, in the next few days. It’s difficult to say at present when monsoon will hit Delhi and neighbouring states,” Pai said.
With many regions still awaiting a delayed monsoon, central India continues to run a high rain deficit of 43.5% while east and northeast reels under a deficit of 44% in the June 1-19 period. South too has a high shortfall of nearly 30% while north India, which is the last region to come under monsoon system, has a relatively lower deficit of 20%. It is likely that June will end up with a large rain deficit, said IMD officials. “The presence of a weak El Nino seems to have affected monsoon, delaying its onset over the Indian mainland and its slow progress thereafter,” an official said.
Gujarat, Karnataka, Kerala: deficit turns into deluge
Amit Bhattacharya, August 16, 2019: The Times of India

From: Amit Bhattacharya, August 16, 2019: The Times of India
When it rained, it poured. Six days of monsoon mayhem turned three sub-divisions of the country from rain deficit regions into flooded fields, in a pattern that experts warn could be getting more frequent due to climate change.
Till August 7, Kerala was among the monsoon deficient sub-divisions of the country with a seasonal deficit of 27%. Eleven of its 14 districts had monsoon shortfall of over 20%, with six having deficits above 30%.
By August 13, all the districts, barring Kollam and Thiruvananthapuram, were hit by floods.
In these six days, the state received 453.4mm of rain, five times the normal for this period (92.6mm) and over 30% monsoon deficiency till August 7 to a 24% surplus on August 13. South Interior Karnataka, another floodhit region, received 163.6mm of rain from August 7 to 13, 4.5 times the normal, turning an 8% deficit to a 21% rainfall surplus.
40% of the rainfall in Kerala in the previous 68 days of the monsoon season. Floods in the state, bringing back memories of last year’s unprecedented deluge, have since claimed 104 lives so far.
The change was even more dramatic in the Saurashtra and Kutch sub-division of Gujarat, which went from
Monsoon now akin to a T20 match: Expert
The patterns seem to fit in with what experts have been warning about the monsoon under climate change — the frequency of heavy rain events is increasing while the number of days of light to moderate showers is decreasing.
“The Indian monsoon has become like a T20 match, the situation can change dramatically within a few balls (days),” said M Rajeevan, veteran meteorologist and secretary of the earth sciences ministry. He said, coupled with extreme rain events, length of dry spells is also increasing. This combination increases the threat of floods, experts said. Saurashtra & Kutch, which is among the drier subdivisions in the country, had a cumulative rainfall of 233mm in the 68 days till August 7. In the next six days, it received 222.8mm rainfall, resulting in flood havoc in seven of the subdivision’s 12 districts.
No single weather event can be directly linked to climate change, M Mohapatra, director general (meteorology) at IMD said. “Last year, Mt Abu got around 70cm of rain in a day. This is part of climate variability. But the increase in the number of very rainy days is due to climate change.”
The wettest July-Aug in 25 years
For day-wise data, see the graphic under ‘1988-2019: the wettest July-Aug’
August 31, 2019: The Times of India
July and August this year, the main monsoon months, were the wettest India has seen in 25 years. Countrywide rainfall in the two months has been 10% above normal, the highest since 1994, met records reveal.
The current month, with 16% above-normal rainfall across the country in 30 days so far, is set to be the wettest August in 23 years. July had ended with a 5% monsoon surplus.
This is also the first time since 2010 that both July and August have received surplus all-India rainfall — just the second time in the past 25 years — IMD data reveals.
The surplus rainfall in July-August was a dramatic change from June, which witnessed a 33% rainfall deficit, the worst for the month in five years. “Both large scale and regional factors became favourable for the monsoon since July. First, El Nino, which normally disrupts the Indian monsoon, weakened considerably in July (and later dissipated). Meanwhile, conditions in the Indian Ocean became good for monsoon with the oceanic dipole turning positive,” said Mrutyunjay Mohapatra, director general of meteorology of IMD.
At the regional level, low pressure systems started forming over the Bay of Bengal and moving inland. “Four such systems formed in August alone. But it wasn’t the number alone. The systems remained active over the land for a large number of days, leading to vigorous monsoon conditions, particularly over central and peninsular India,” Mohapatra said.
However, at many places, the rainfall proved to be too much, too soon, and not much beneficial for kharif crops. While July got off to a wet start, the monsoon went into a 12-day hiatus from July 13, which delayed sowing in several states.
By July 25, the monsoon was nearly 20% below normal across the country, leading to concerns over another failed monsoon year. That’s when a 26-day period of intense rainfall began which not just wiped out the deficit but pulled the seasonal rainfall (since June 1) to a 2% surplus.
Countrywide daily rainfall during this period remained higher than normal on all but three days. As on August 30, the total sown area under kharif crops was nearly 2% less than the same period last year, according to agriculture ministry figures. While cotton has benefitted, with an increase of 6% in sown area as compared with last year, paddy has taken a hit. The sown area of the staple crop shows a 4.7% decline from last year. That’s also because of poor rains so far in major ricegrowing states such as Bihar, West Bengal and Jharkhand.
Amid floods, 1 in 5 districts had deficit rain
Amit Bhattacharya , Oct 3, 2019: The Times of India

From: Amit Bhattacharya , Oct 3, 2019: The Times of India
Key Highlights
These dry districts account for nearly 23% of the 678 districts for which India Meteorological Department’s rainfall data is available. All but 12 of these districts are in north, east and northeast India.
IMD defines “deficient” rainfall in a district as rainfall that is 20% to 59% below normal. Deficiency of 60% or more falls in the “scanty” or “large deficient” category.
NEW DELHI: Flood fury in different parts of the country has dominated the news this rainy season as India experienced its wettest monsoon in 25 years . However, amid all the rain, 154 districts in the country — more than one in every five for which data is available — received deficient or scanty rainfall in the season.
These dry districts account for nearly 23% of the 678 districts for which India Meteorological Department’s rainfall data is available. All but 12 of these districts are in north, east and northeast India.
IMD defines “deficient” rainfall in a district as rainfall that is 20% to 59% below normal. Deficiency of 60% or more falls in the “scanty” or “large deficient” category.
Haryana had the highest number of dry districts, 19 out of 21, including three where rainfall was scanty. The overall monsoon deficiency in Haryana was 42%, which made it the driest state in the country in the season after Manipur (-56%). Delhi had five dry districts out of six for which data was available.
In fact, more than a third of the dry districts, 52, are in the high-output agriculture belt of Punjab, Haryana and west Uttar Pradesh, including Delhi. This is the region where the water table is falling alarmingly, and another season of poor rains will only add to the stress.
The high number of dry districts during a season when countrywide rainfall was 10% above normal may come as a surprise to many but not to experts familiar with the vagaries of the monsoon.
“During a normal monsoon year, around 30% of the districts in the country get deficient or scanty rainfall. This year, due to higher rainfall, that figure is closer to 20%. India is a vast country and there is much variation in rainfall at the district level,” said Mrutyunjay Mohapatra, IMD’s director general of meteorology.
Last year, when the monsoon was more than 9% below normal — close to the threshold of a drought year — there were 254 dry districts across the country. These accounted for nearly 38% of all districts. This year’s number is 40% lower while rainfall was 20% higher than in 2018.
“Rainfall distribution was good this year although temporally, the distribution wasn’t good in east Uttar Pradesh and Bihar. These sub divisions got heavy rainfall in the second half of September after being deficient for most of the season,” said Mohapatra.
Outside of the rain-deficient districts, and the havoc caused by heavy rains, this year’s monsoon should bring good news, particularly for upcoming sowing of rabi crops. At least five states — Odisha, Madhya Pradesh, Gujarat, Andhra Pradesh and Kerala —had no dry districts at the end of the monsoon season.
Across south India, there were just four districts that ended with deficient rainfall. In central India, that number stood at eight. Surprisingly, five of these districts were in Maharashtra, which was among the top four wettest states during the season and witnessed floods in some part or the other in July, August and September.
District wise analysis reveals important information about distribution of rainfall that often gets obscured in big-picture data. For instance, at the sub-divisional level, just five of the 36 sub divisions in the country — less than 14% — got deficient rainfall this monsoon. That number comes further down to four out of 36 states and UTs that were rain-deficient.
2020

From: April 17, 2022: The Times of India
June- Aug
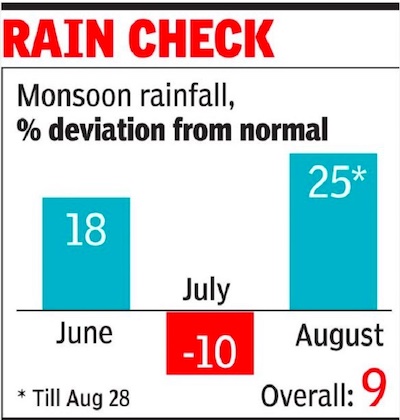
From: Amit Bhattacharya, August set for highest rain surplus in 44 years, August 29, 2020: The Times of India
NEW DELHI: While the monsoon in July was 10% below normal in the country, August is set to be one of the wettest in decades. Rainfall during the month has been 25% surplus so far (till August 28), the highest deviation from normal in 44 years, with monsoon rains pounding central and south India in recent weeks.
India last witnessed a higher monsoon surplus in the month of August in 1976, when 28.4% higher than normal rainfall was recorded, according to India Meteorological Department data. Met officials said active monsoon conditions are expected in the remaining three days of the month, which means the rain surplus of 25% may not change much.
Across the country, an average of 296.2mm of rain has been recorded so far this month, against a normal of 237.1mm. In absolute terms, rainfall for the whole month could be the highest for August since 1988, when 329.6mm was recorded.
Monsoon was most active over central India, which received relentless rains during the month, adding up to a huge surplus of 57% in August. South India too has had over 42% excess rains, on top of the 16% surplus it received in July.
Between the two months, July and August, what made the difference in monsoon conditions were the number of low-pressure systems forming in the Bay of Bengal. While there were none in July, August has had five so far against a normal of three-four in each of the two months.
“In July, one low-pressure system had formed in the first week but quickly dissipated. So it wouldn’t be counted as a proper system. In August, we had a number of low-pressure circulations that had long life periods, bringing copious rain, particularly over central India. The region had a 22% rain deficit in July, while in August it had a 57% surplus,” said D Sivananda Pai, IMD’s lead monsoon forecaster.
The rain bounty in August has led to an overall monsoon surplus of 9% for the season (June 1-August 28) so far. If September turns out to be even slightly wetter than normal, the 2020 monsoon season could end with excess rainfall (over 10% above normal).
However, IMD officials said September could see slightly below normal rainfall although La Nina conditions are developing in the Pacific Ocean which favour good monsoon rainfall over India.
“We expect northwest India to get rain over the next week. After that, around September 5, monsoon activity is likely to shift to northeast India, which hasn’t had good rainfall in August. The risk of floods could increase in that region following this rain spell,” said Mrutyunjay Mohapatra, head of IMD.
While northwest India received normal rainfall in August, several parts of the region, particularly the subdivision of west Uttar Pradesh, have had deficient rains. For the season as a whole, northwest India has a rain deficit of 11%.
Delhi: 20% rain deficit
Priyangi Agarwal, October 1, 2020: The Times of India
Delhi recorded 467.7mm of rainfall this season against the normal level of 585.8mm of rainfall. “There has been an overall deficit of 118.1mm rainfall this monsoon season,” said Kuldeep Srivastava, a scientist at IMD.
Despite prolonged monsoon, the month witnessed only three rainy days on September 5, 6 and 8. Only “trace” rainfall was recorded on September 4, while 0.8mm of rainfall was recorded on September 5. Safdarjung — Delhi’s base station — recorded no rainfall since September 9 even after the extended monsoon. However, the city saw two “heavy” and a “very heavy” rainy day in August.
Though the Safdarjung observatory observed excess rainfall in both June and July, it recorded 11 per cent deficit this season after less rain in August and September. The observatory recorded 81.8mm rainfall in June, which was 25% excess than normal 60.5mm rainfall. With 236.9mm rainfall in July, Safdarjung observed 12 per cent excess rainfall. However, in August, Safdarjung received 237mm rainfall against 247.7mm normal rainfall, while it recorded only 20.8mm rainfall in September.
This monsoon season, no district in Delhi recorded “excess” rainfall. However, three districts, including New Delhi with 12 per cent deficit, North Delhi with 5 per cent excess rain and South West Delhi with 3 per cent deficit, made it to “normal” category of rainfall. The IMD classifies a rain deficit when it is above -19 per cent.
East Delhi, North East Delhi, North West Delhi and South Delhi districts were in “deficit” category. Central Delhi, which has only received 250.2mm of rainfall against 674.9mm normal rainfall this season, fared the worst with a “large deficit” rainfall of 63 per cent.
Marathwada: record rainfall
Prasad Joshi, October 25, 2020: The Times of India
All the 11 major dams in Marathwada, including the Manjra dam that is prone to dry storage and supplies water to Latur, Sina Kolegaon and Lower Dudhna in Osmanabad district, are almost filled to the designed storage capacity, thanks to record rainfall.
Jaisingh Hire, assistant engineer with Command Area Development Authority (CADA), Aurangabad, on Saturday said the cumulative storage in these major reservoirs was the highest in the last decade and a half.
Marathwada has faced droughts twice in the last six years and the threat of water scarcity looms over the region every year, especially in Latur, Osmanabad and Beed districts due to relatively poorer storages in major dams that supply water to them.
The overflowing dams have now addressed issues of the water-scarcity prone areas of the region at least till the end of December next year.
Notably, Latur had grabbed national and international attention when it was forced to supply water through special trains during the summer of 2016 owing to scanty rainfall. “The storage in the Sina Kolegaon dam was very poor in the last 15 years due to low rainfall in catchment areas. Similar was the case with Manjra for around 10 years. Overall, the collective storage in all the dams in the region is exceptional this year due to the good run of monsoon,” said Hire.
Four of the major irrigation projects — Sina Kolegaon (-80%), Majalgaon (-18%) and Manjra (-17%) in Beed district and Lower Dudhna (-15%) in Parbhani district — were in dead storage during the corresponding period last year.
Hire said that the available water stock is expected to produce a bumper season of rabi crops ahead even if kharif crops have taken a hit in many areas due to excessive rainfall.
“The meetings of canal advisory committees for every major irrigation project, to be convened shortly, will decide on allocation of water for drinking, irrigation and industrial among other needs. There is sufficient water to cater to all possible demands,” he said.
The total 11 major dams were showing 180 TMC live storage (99%), which is more than twice the average stock that has been held by them in the last five years.
The 75 medium dams in the region were showing 31 TMC live storage (92%), whereas 752 minor dams were holding 47 TMC water (80%). A total of 38 barrages on different major rivers from Marathwada were showing 11 TMC water in total (94%).
2023
Overall performance
In India
Vishwa Mohan, Oct 1, 2023: The Times of India

From: Vishwa Mohan, Oct 1, 2023: The Times of India
NEW DELHI: Breaking the four-year trend of good rainfall in either 'normal' or 'above normal' category during 2019-2022, India recorded ‘below normal’ monsoon rainfall at 94.4% of the long-period average, according to data for the June-September period released by the India Meteorological Department (IMD) on Saturday. The Met department, however, forecast 'normal' rainfall for winter monsoon in Peninsular India during October-December. Rainfall in the range of 96-104 per cent of the long-period average (LPA) is considered normal.
Despite prevailingEl Nino conditions (warming of sea surface temperatures in the central and eastern tropical Pacific Ocean that impact monsoon negatively), the monsoon season ended with ‘close to normal’ rainfall."Effect of other meteorological factors reduced the impact of El Nino to an extent and it helped in taking the overall monsoon very close to normal, the way we had predicted it," said IMD Director General M Mohapatra.
The Met department had predicted a 'normal' monsoon this year at 96% of LPA with an error margin of +/- 4%. But huge deficit (36%) of August dragged the overall monsoon rainfall to 94.4% of LPA of 87 cm (based on data of 1971-2020). Around 73% of the total area in the country, however, received 'normal' rainfall and 9% got 'excess' rainfall. "We have been analysing what went wrong in August and sensitised all academic and research institutions to study it," said Mohapatra.
The IMD data show that not all El Nino years were bad monsoon years and that 40% of such years in the past received normal to above-normal monsoon rainfall. Out of 15 El Nino years during 1951-2022, there were six years with normal to above normal rainfall. El Nino years normally report higher than normal temperatures -- an indication that the winter this year may not be severe.
"It would, however, be premature to predict anything at this juncture. We will come out with the winter temperature outlook for December-February later," said Mohapatra.
Though June also reported a deficit of 9%, it was almost on the predicted lines. July and September were, on the other hand, good in terms of monsoon with 13% higher rainfall in both months. Good rainfall in July (main sowing season of Kharif crops) and overall normal rainfall in the monsoon core zone (rainfed areas) helped the Kharif sowing operations which finally ended with higher than normal (average of last five years) acreage and also higher than the sown area of last year.
The IMD's season-end report shows that out of the total 36 meteorological subdivisions, three constituting 9% of the total area of the country received excess rainfall , 26 subdivisions (73% of the total area) received normal and seven subdivisions (18% of the total area) received deficient rainfall during the season.
Kerala was the worst hit among those seven meteorological subdivisions which got deficient rainfall. Others were Nagaland, Manipur, Mizoram & Tripura (NMMT); Gangetic West Bengal, Jharkhand, Bihar, East Uttar Pradesh and South interior Karnataka.
Besides extreme variability, the monsoon this year was also marked by two major intense heavy rainfall spells over Himachal Pradesh -- July 6-15 and August 10-15 -- that caused extreme flooding during the period due to occurrence of mini cloudburts over the state. Some other parts of the country -- Chandigarh, Saurashtra, Konkan and Telangana -- too witnessed exceptionally heavy rainfall, mostly in July.
In Delhi
Priyangi Agarwal, Oct 1, 2023: The Times of India

From: Priyangi Agarwal, Oct 1, 2023: The Times of India
NEW DELHI: The southwest monsoon retreated from Delhi on Saturday after a delay of five days from the normal withdrawal date of September 25. For a decade now, the rain-bearing winds have withdrawn from Delhi late, according to India Meteorological Department’s data. Safdarjung, which is the city’s base weather station, logged 660.8mm of rainfall in the monsoon season from June to September against the normal average of 640.4mm.
“The southwest monsoon has withdrawn from some parts of Jammu-Kashmir, Himachal Pradesh and Uttarakhand, entire Punjab and Haryana-Chandigarh-Delhi, some parts of west Uttar Pradesh, west Madhya Pradesh and east Rajasthan and some more parts of west Rajasthan on Sunday,” said IMD in its bulletin on Saturday.
IMD’s data shows that of the total rainfall reported during the monsoon season, more than half the precipitation was recorded in July at 384.6mm with a monthly excess of 83%. June also had excess rain of 37% with Safdarjung logging 101.7mm rainfall against the normal of 74.1mm.
In contrast, August received 91.8mm of rainfall against the month’s normal of 233.1mm, thus bing the second driest in 14years with a rain deficit of 61%. September received 82.7mm rainfall, a deficit of 33%. It is the lowest rainfall recorded in September at Safdarjung in the past three years.
Met officials said that since the monsoon trough had moved away from Delhi in the past two months, the city received scanty rainfall. “In August and September, the monsoon trough shifted from its normal position. On most days, it skirted Delhi and the city was unable to meet its normal precipitation mark,” said a Met official.
However, the total rainfall logged in this monsoon season was higher than last year. Safdarjung recorded 516.9mm rainfall during the monsoon in 2022. However, 2021 was the wettest monsoon since 1964 as Safdarjung logged 1,176.4mm of rainfall.
Met department’s data shows that the rains withdrew on September 29 in 2022 and October 8 in 2021. The earlier normal withdrawal date for monsoon for the city was September 22, but it was revised to September 25 from 2021 onwards. The normal date of monsoon withdrawal was revised based on long period average data based on 1971-2019.
While the rains withdrew from the city after a delay of five days, the monsoon arrived early this year in Delhi on June 25, two days before its normal onset date.
IMD’s forecast says that the day temperature is likely to hover at 35-36 degrees Celsius for the next seven days.
2024
Overall performance
In India, July August
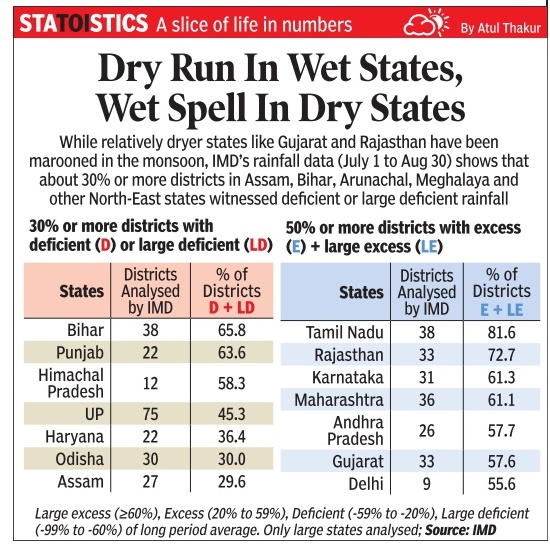
From: August 31, 2024: The Times of India
See graphic:
Monsoon 2024: Overall performance In India, July August
Districts, the driest and Wettest

From: Sep 1, 2024: The Times of India
See graphic:
Monsoon 2024: the driest and Wettest districts In India, July August
State-wise
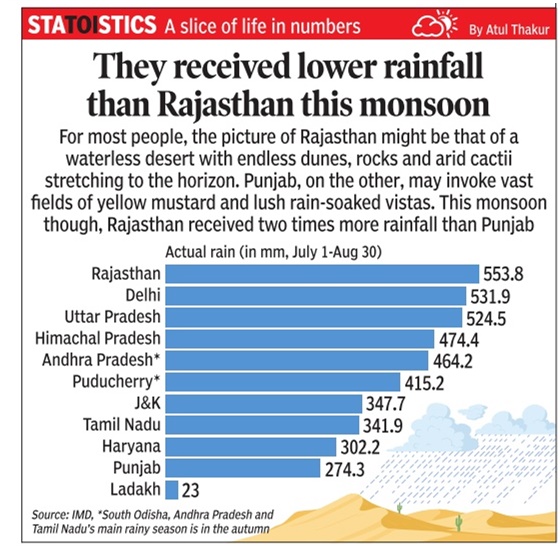
From: Sep 2, 2024: The Times of India
See graphic:
Monsoon 2024, India, July Aug: rainfall in some states
State-wise II
See graphic:
Monsoon 2024, India, July Aug: Deficit and excess rainfall in some states
See also
India Meteorological Department
Monsoons: India
Rainfall: India and Burma, 1907-12
Storms (dust-, hail-, rain-, thunder-): India
January weather in India <> February weather in India <> March weather in India <> April weather in India <> May weather in India <> June weather in India <> Summers: India<> July weather in India <> August weather in India <> September weather in India <> Monsoons: India<> October weather in India <> November weather in India <> December weather in India <> Winter rains: India <> Winters: India
