Economy: India 1
Several sections from this page have been shifted to Economy: India 2 (Ministry data)
This is a collection of articles archived for the excellence of their content. |
India’s economy: the main trends
A.D. 1 to 2003
The British Era
1962-2021
February 2, 2022: The Times of India
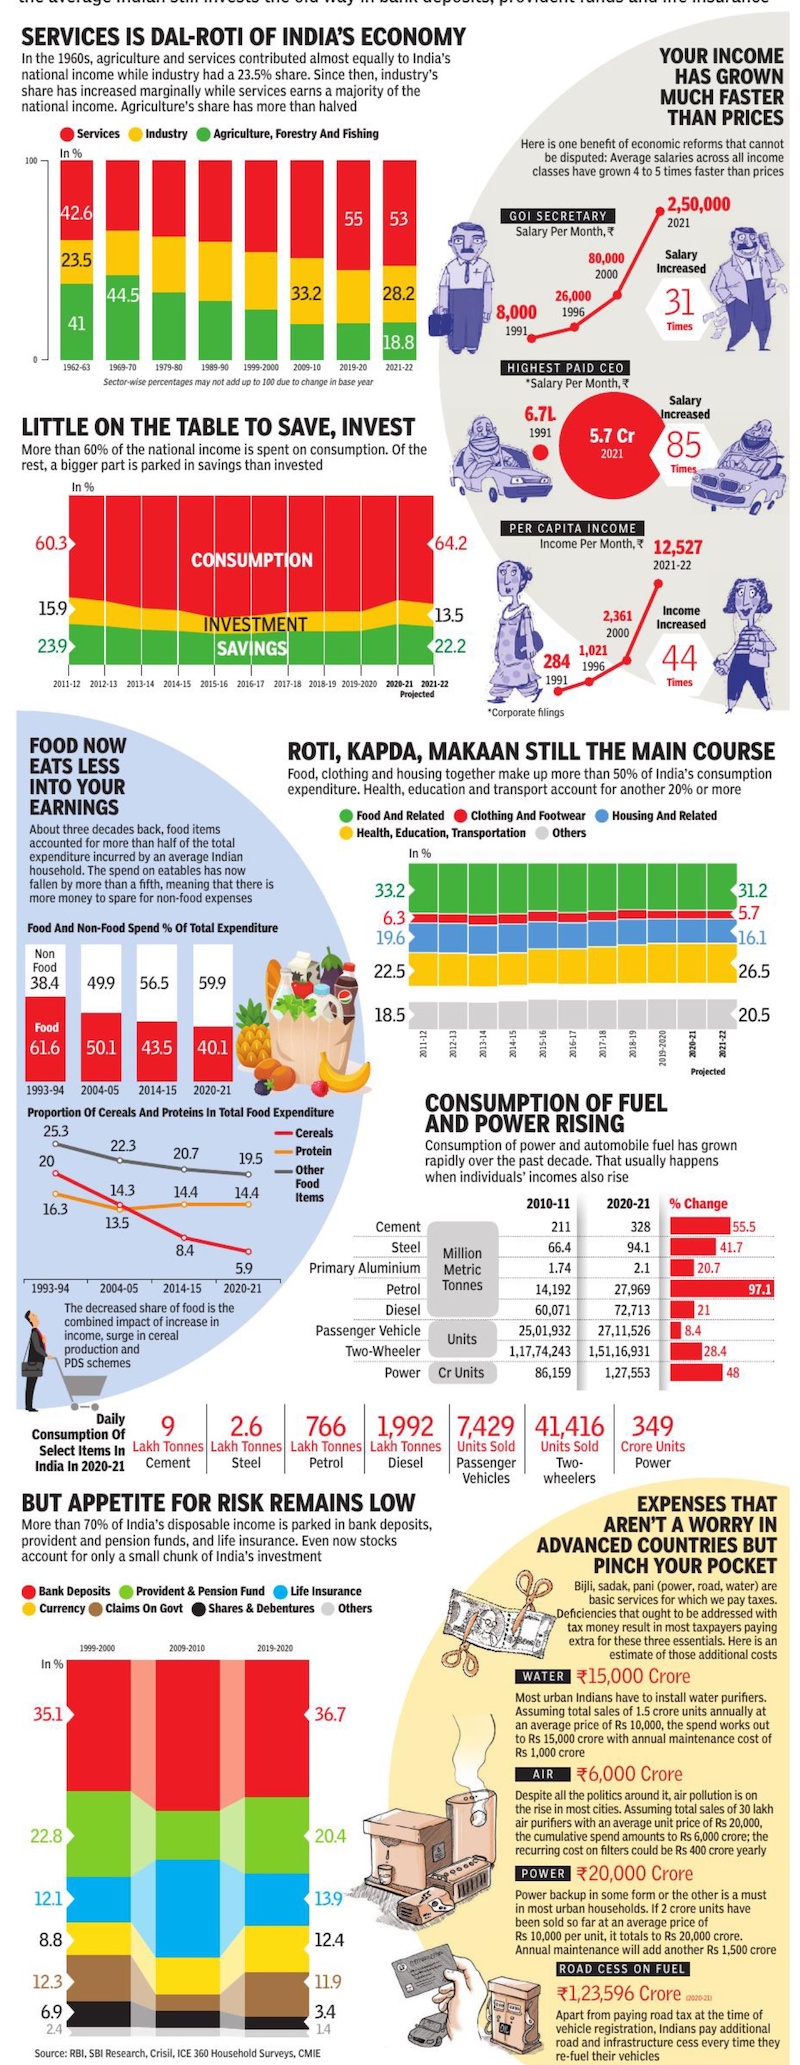
From: February 2, 2022: The Times of India
Most economies shift from agriculture to services via a vigorous industrial age, but India moved up the ladder from ‘Jai Kisan’ to ‘Hello, World’ without really resting its weight on the rung of industry. Industrial output has never made up more than a third of India’s GDP while services have accounted for more than half for over a decade. Yet, this seemingly young economic profile hides the fact that most Indians still live from hand to mouth, exhausting their earnings on the basic needs of food, housing and transport. And while stock markets soar, the average Indian still invests the old way in bank deposits, provident funds and life insurance
BUDGET RESEARCH: Atul Thakur; DESIGN: Nirmal Sharma, Chanchal Mazumder, Sunil Singh, Anil Dinod, Karthic R Iyer, Arya Praharaj, Asheeran Punjabi, Deepti Singh; ADMINISTRATIVE SUPPORT: Sanjay Kalia
1975-2015
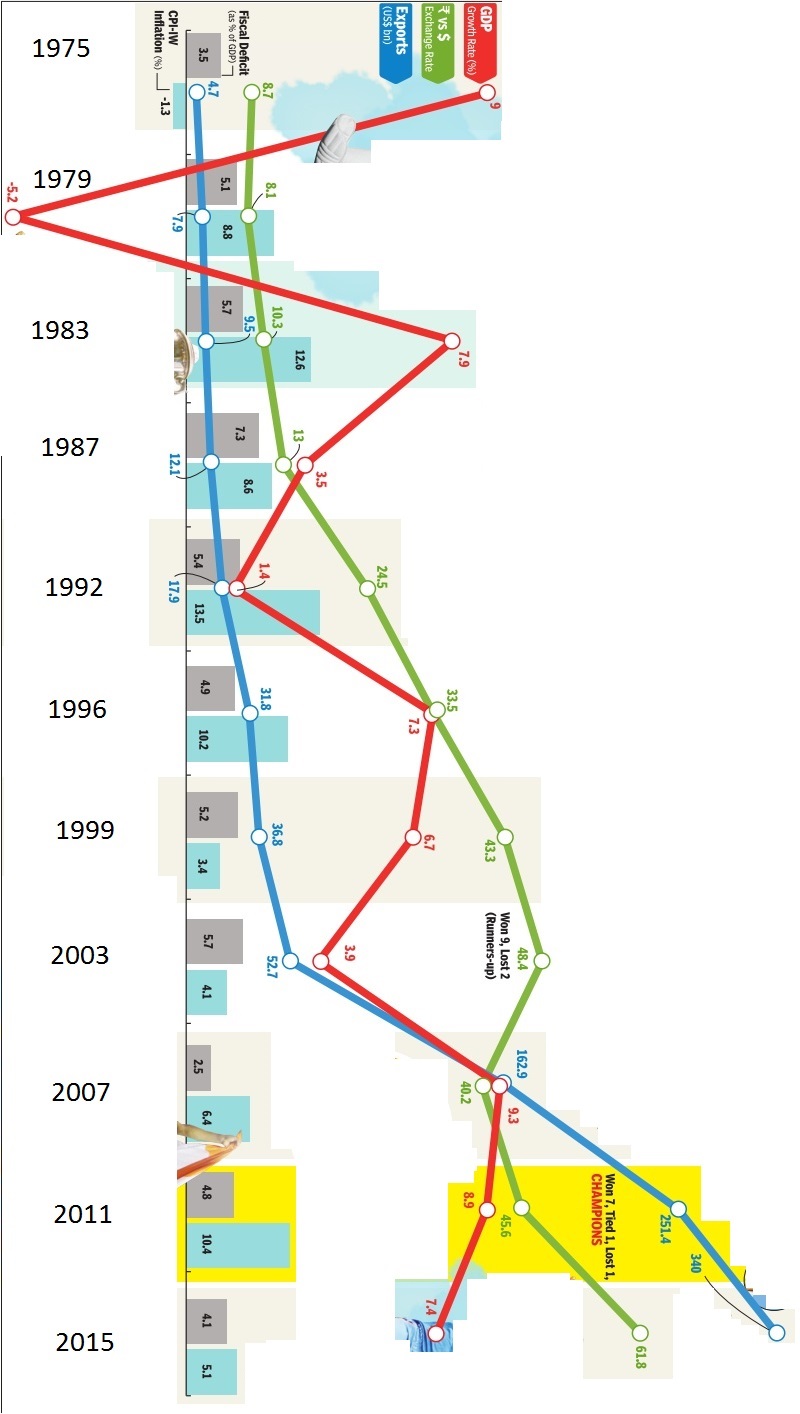
See graphic, 'The Indian economy, 1975-2015: GDP, the rupee exchange rate, exports, fiscal deficit and inflation'
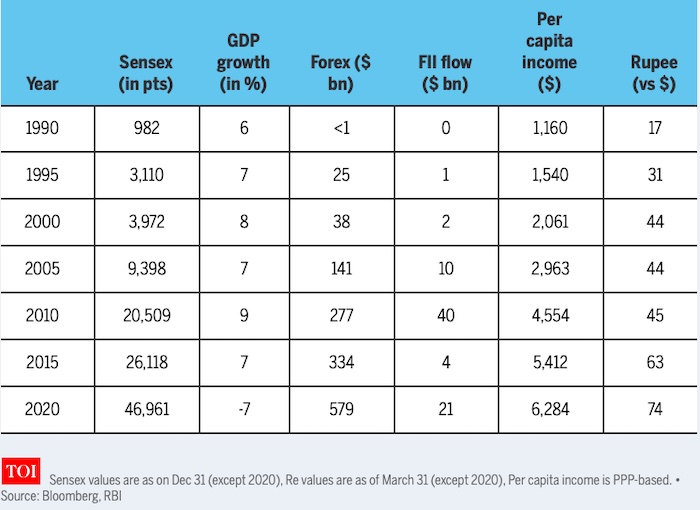
1990-2020: sensex, per capita income, ₹ vs $, GDP growth, forex, FII flow
From: December 19, 2020: The Times of India
See graphic:
India, 1990-2020: sensex, per capita income, ₹ vs $, GDP growth, forex reserves, FII inflow
1980-2020
From: December 23, 2020: The Times of India
See graphic:
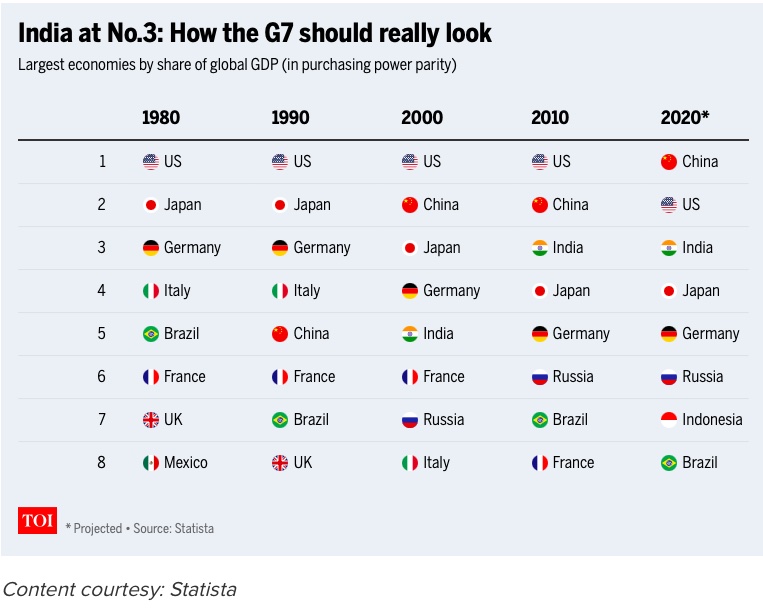
The GDP of India (in PPP terms) vis-à-vis the GDPs of the other top 7 economies of the time, 1980-2020
1990-2020: sensex, per capita income, ₹ vs $, GDP growth, forex, FII flow

From: December 19, 2020: The Times of India
See graphic:
India, 1990-2020: sensex, per capita income, ₹ vs $, GDP growth, forex reserves, FII inflow

From: February 2, 2021: The Times of India
See graphic:
1991-21: salaries, wealth, share of agriculture, women workers in India
1997-2018: Fiscal Deficit to GDP
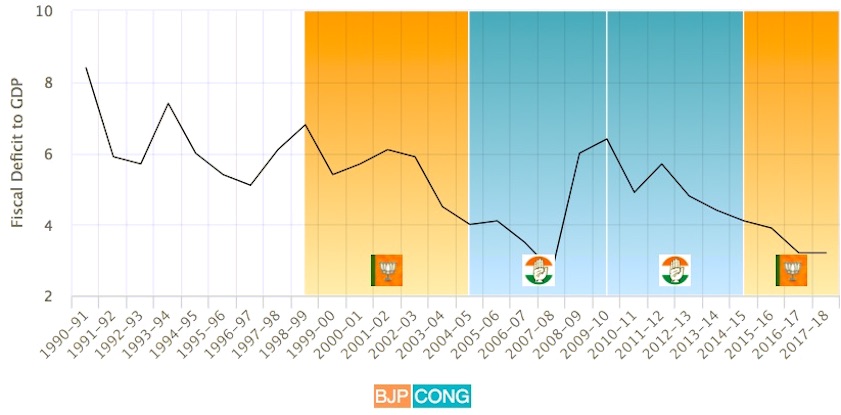
This is the size of the government’s debt as a proportion of the overall size of the economy.Data source for this chart: World Bank
From: January 29, 2018: The Times of India
See graphic:
Fiscal Deficit to GDP, 1990-2018
1997-2018: Gross Fixed Capital Formation (GFCF)
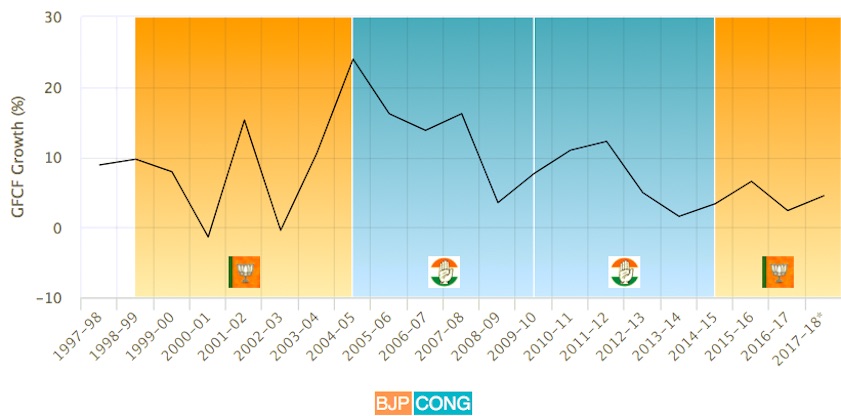
Data source for this chart: World Bank
From: January 29, 2018: The Times of India
See graphic:
Gross Fixed Capital Formation (GFCF) is an indicator of how much investment activity is happening in the country and a slowdown on this front does not bode well for overall growth and job creation- 1997-2018
1997-2018: Inflation trend
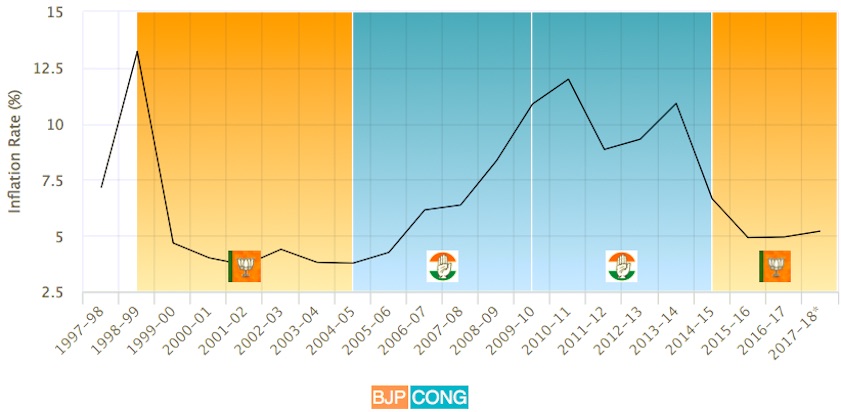
This is the rate at which the general level of prices in the economy is rising.Data source for this chart: World Bank
From: January 29, 2018: The Times of India
See graphic:
Inflation trend, 1997-2018
1997-2018: Unemployment Rate

The unemployment rate measures the proportion of people in the labour force looking for a job but unable to find one.Data source for this chart: World Bank
From: January 29, 2018: The Times of India
See graphic:
Unemployment Rate, 1997-18
2009-18: ₹ vs. $/ GDP/ adding $1 trillion to GDP
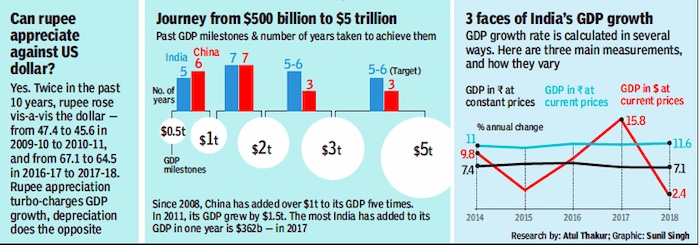
From: June 18, 2019: The Times of India
See graphic:
i) 2009-19: The Indian rupee appreciated twice vis-à-vis the US dollar; ii) The number of years that it took China and India to add each $1 trillion to their GDPs/ economies; iii) 2014-18: India’s GDP estimated by three different methods.
2011/ 13-19

i)Growth rate vis-à-vis the world;
ii) Inflation;
iii) Growth in loans and advances of NBFCs;
iv) Tax to GDP ratio;
v) Items of revenue expenditure, unproductive expenditure
From: July 5, 2019: The Times of India
See graphic, ‘ The Indian economy, 2013-19:
i)Growth rate vis-à-vis the world;
ii) Inflation;
iii) Growth in loans and advances of NBFCs;
iv) Tax to GDP ratio;
v) Items of revenue expenditure, unproductive expenditure '
2017>19: The slowdown in demand
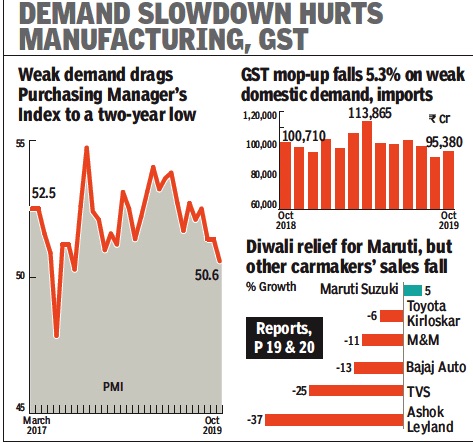
From: Nov 1, 2019: The Times of India
See graphic:
2017>19: The slowdown in demand
2020, the year of the Covid pandemic
January 22, 2021: The Times of India
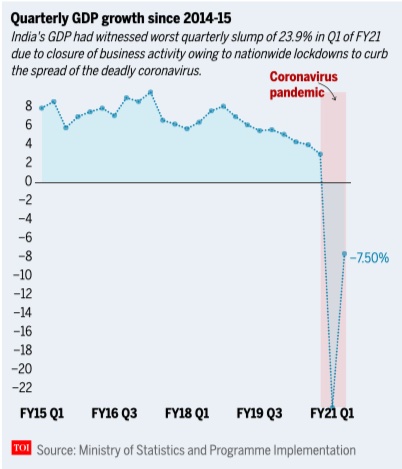
From: January 22, 2021: The Times of India
RBI sees V-shaped recovery: State of Indian economy explained in 10 charts
NEW DELHI: With domestic activity gradually returning to pre-Covid levels, the Reserve Bank of India (RBI) sees a phoenix-like recovery for the Indian economy.
According to a recent report published by the central bank, the country's gross domestic product (GDP) is not far from attaining positive growth. It observed that the economy will experience a V-shaped recovery in 2021, where V will stand for vaccine. India has already started one of the world’s biggest vaccination drives against Covid-19. It plans to inoculate about 300 million people on priority by year end.
RBI's report also stated that barring another wave of Covid, the worst is over for India. Hence, policymakers might soon have more room to support the recovery process.
State of Indian economy
The Covid-19 pandemic has been a human and economic catastrophe for India. Almost one-fourth of the country's economic activity was wiped out due to fall in domestic demand in wake of the strict nationwide lockdowns to curb Covid infections.
India's GDP dipped a historic 23.9 per cent in the first quarter (Q1) of 2020. The contraction narrowed down to 7.5 per cent in the second quarter (Q2).
However, so far India seems to have managed the Covid crisis pretty well.
The first advance estimates of national income for 2020-21 released by the National Statistical Office (NSO) estimated real GDP growth in 2020-21 to be at (-) 7.7 per cent as against (-) 10.3 per cent projected by the International Monetary Fund (IMF) in October 2020. In December 2020, RBI’s monetary policy committee (MPC) had projected GDP to be (-) 7.5 per cent.
Rise in government expenditure
Total expenditure of the government surged 48.3 per cent on year-on-year (y-o-y) basis in the month of November. While, capital expenditure shrugged off a three-month contraction and expanded 248.5 per cent.
This was mainly due to the introduction of the Atmanirbhar Bharat package.
Revival of imports, exports
After contracting for 9 consecutive months, merchandise imports finally experienced a growth of 7.6 per cent (y-o-y) in December 2020.
The revival was led by gold, electronic goods and vegetable oils. Rising imports of pearls and precious stones, machinery, electronic goods and textiles reflect the revival of domestic activity as they are of the nature of intermediate goods in supply chains. This also augurs well for exports going forward.
This suggests that moribund absorptive capacity of the economy is coming back to life, backed by domestic demand.
India’s merchandise exports have reached pre-Covid levels and exhibited a growth of 0.1 per cent in December 2020. Non-oil exports actually expanded by 5.6 per cent, marking the fourth consecutive month of positive growth.
Financial markets surge
The Covid-19 pandemic dragged the sensex to record low in late March 2020. But, it staged a strong recovery from the lows. Both the BSE and NSE indices finally wrapped up 2020 on a bullish note, with sensex gaining nearly 16 per cent.
The BSE index jumped almost 91 per cent from its record low of 25,881 to breach the 50,000-mark in just over 10 months.
IPO market
During December 2020, the listing of two initial public offerings (IPOs), aggregating Rs 1,351 crore, took the total resource mobilisation through main board IPOs to Rs 15,971 crore during 2020-21 (up to December 2020), marking a sharp rebound from Rs 10,487 crore in the corresponding period of the previous year.
Beginning with the first IPO issued in July 2020, healthcare and finance sector companies have garnered the maximum amount of resources among all initial offerings.
Industrial activity
Although industrial output remains volatile, contracting by 1.9 per cent in November 2020 after a record expansion in October by 4.2 per cent, industrial activity is finally turning around.
The headline purchasing managers’ index (PMI) manufacturing expanded in December 2020 to 56.4, a tick higher than November’s reading of 56.3. Both new orders and output continued to grow strongly.
Record GST collections
The gross Goods and Services Tax (GST) collections touched a record high of over Rs 1.15 lakh crore in December — the highest since the implementation of the regime. The collection indicates that the economy continues to show signs of recovery after a stringent lockdown last year.
With this, the GST has also now crossed the psychological Rs 1 lakh crore-mark for the third straight month in the current fiscal.
Fall in government revenue
Even though GST collections have been at record levels during the year, the pandemic has inflicted a ‘scissor effect’ on government revenues.
On the one hand, it stretched expenditure on account of fiscal support to the economy that was completely unanticipated at the time of drawing up Budgets for 2020-21.
On the other, there was contraction in revenues as activity went into complete standstill with lockdowns and other containment measures.
As a result, the general government gross fiscal deficit (GFD) rose to 14.5 per cent in the first half of 2020-21.
2015-22

From: February 1, 2023: The Times of India

From: February 1, 2023: The Times of India
See graphics:
The Indian economy- the main trends 2015- 2022/ A
The Indian economy- the main trends 2015- 2022/ B
The year-wise position, especially after 2002
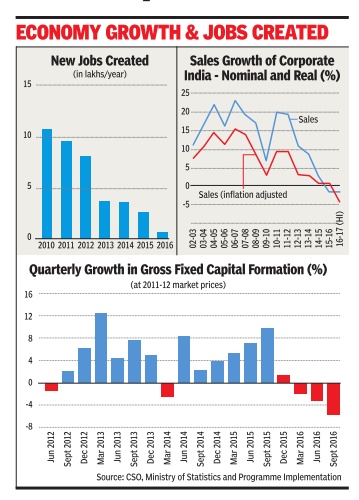
ii) Sales Growth of corporate India-Nominal and Real (%), 2002-17;
iii) Quarterly growth in Gross Fixed Capital Formation (%), Jun 2013- Sept 2016; The Times of India, January 31, 2017
2004- 18
Better growth prospects in FY19, but oil a risk: Expert, June 1, 2018: The Times of India
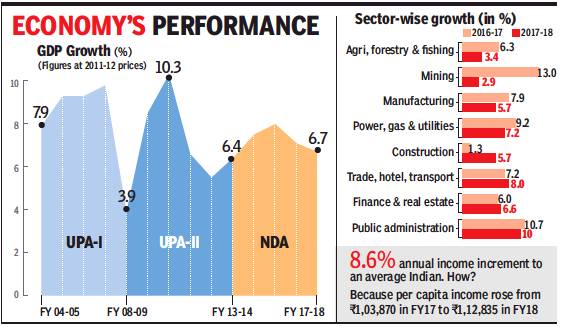
2016-18
i) Sector-wise growth, and
Growth in per capita income
From: Better growth prospects in FY19, but oil a risk: Expert, June 1, 2018: The Times of India
Economists are predicting a further pick-up in activity during the current financial year on the back of higher consumption demand, a stable GST and a surge in investment towards end of the year. But they have identified higher crude oil price and its impact on inflation, current account deficit and overall growth as risk factors that are expected to weigh on RBI’s Monetary Policy Committee (MPC), which meets next week.
Most economists are predicting a GDP growth rate of 7-7.5%, with a majority closer to the upper end of the band. A few have already lowered their projections, such as Moody’s which cut from 7.5% to 7.3%, citing the impact of crude. But others, including the government, are sticking to their earlier estimates.
“I don’t think we are revising our estimates or the forecast for the current year, which is about 7.5%. We retain it at that level... there is no one-to-one relation between the oil price growth and the GDP growth. There have been various quarters and years when oil prices have gone up but there has been growth also. So, we at this moment feel that we should retain (the growth estimate),” economic affairs secretary Subhash Chandra Garg told reporters after the GDP numbers were released.
Economists too are bullish at the moment. “The growth is likely to realise from pick-up in consumption, especially rural consumption, with the forecast of normal monsoon, increased public sector spending and uptick in performance of the manufacturing sector in coming quarters. The manufacturing sector, which witnessed improvement in the last three quarters, is expected to benefit in Q1 of FY19 due to favourable base effect. In addition, investment rate has seen some improvement on the quarterly basis and is expected to maintain the momentum going ahead,” said Madan Sabhnavis, economist at CARE, while forecasting 7.5% growth this fiscal.
Health of the banking sector will also be crucial. “The ability of public sector banks to support lending growth, the risk of monetary tightening and trade wars, and impact of higher crude oil prices on purchasing power of consumers and corporate earnings have emerged as risks,” said Aditi Nayar, principal economist at ICRA.
2004-14 vis-à-vis 2014-18
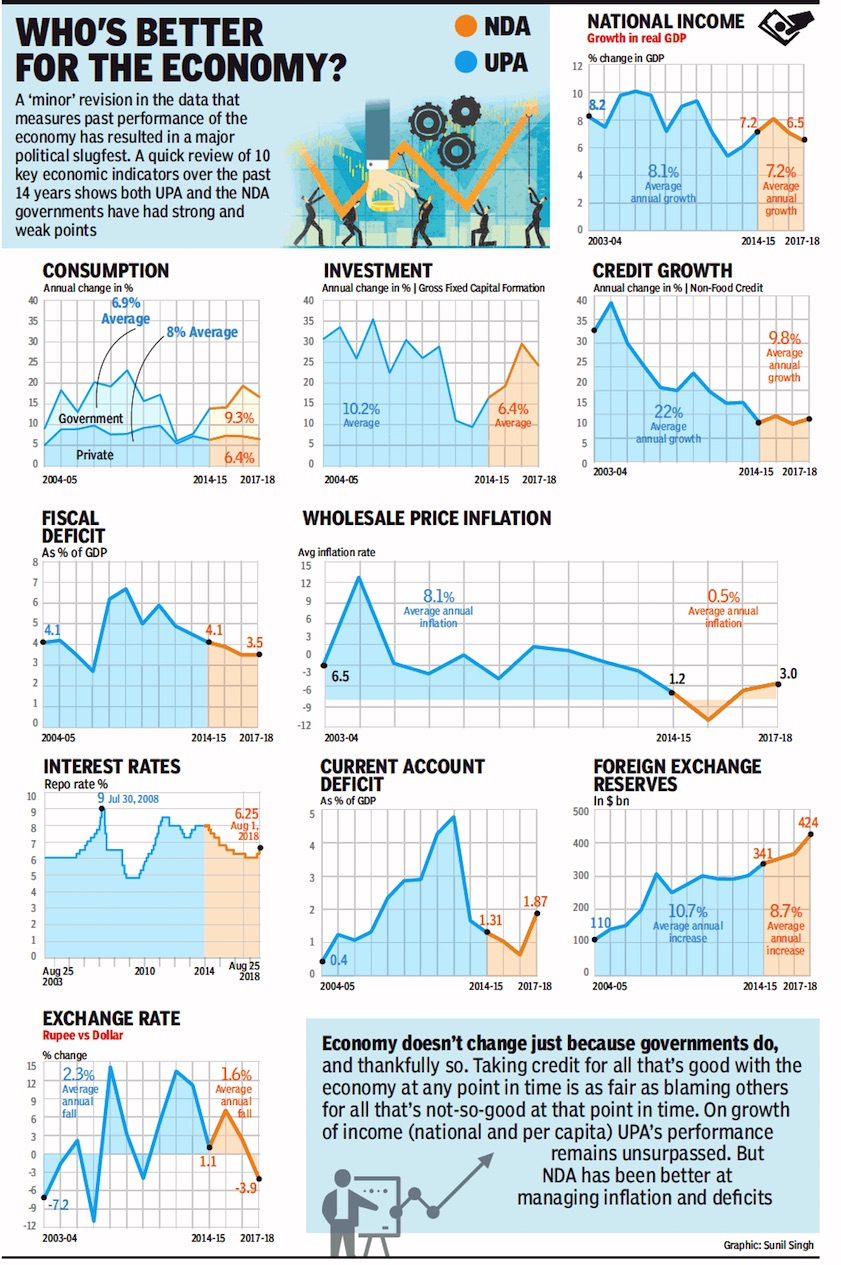
i) Consumption,
ii) Investment,
iii)Credit Growth,
iv) Fiscal Deficit,
v) Wholesale Price Inflation,
vi) Interest Rates,
vii) Current account Deficit,
viii) Foreign Exchange Reserves
From: August 23, 2018: The Times of India
See graphic:
The Indian economy in 2004-14 vis-à-vis 2014-18- Consumption, Investment, Credit Growth, Fiscal Deficit, Wholesale Price Inflation, Interest Rates, Current account Deficit, Foreign Exchange Reserves
2004-14 (and 1988-89, 1994-2003)

From: India clocked 10.08 per cent growth under Manmohan Singh's tenure: Report, August 18, 2018: The Economic Times
The numbers have been calculated by a committee set up by the National Statistical Commission.
India’s economic growth numbers, adjusted for the base year of FY12, show that expansion was marginally higher under the new series after the economy picked up pace in FY04 and generally lower in the preceding years.
The numbers have been calculated by a committee set up by the National Statistical Commission. Former chief statistician Pronab Sen said the exercise was a good start but that more work was needed.
The report shows real GDP growth touching a high of 10.08% in 2006-07 in terms of factor cost, the highest since liberalisation of the economy in 1991 and the second highest ever, behind 10.2% during the Rajiv Gandhi administration in 1988-89. Under the old series, growth in 2006-07 was 9.57%.
In terms of market prices, the highest growth was 10.78% in 2010-11.
The new GDP series with FY12 as the base year was begun in 2015 and follows internationally accepted methods based on market prices as opposed to the factor cost method followed earlier and uses corporate numbers to estimate manufacturing output.
The committee has issued adjusted numbers for the 1994-2014 period. Average growth in first five-year term of the Congress-led United Progressive Alliance (UPA-1), FY05-09, goes up under the new series to 8.37% from 8.03% earlier in terms of market prices.
In terms of factor cost, the increase is from 8.43% to 8.87%. Average growth during the preceding Bharatiya Janata Party-led National Democratic Alliance administration is down marginally from 5.89% to 5.73%. In terms of factor cost, the decline was from 6.01% to 5.83%.
In the first three years of UPA-2 (FY10-12), the average growth rate goes up from 8.46% to 8.86%. In terms of factor cost, the revision is up from 8.06% to 8.49%. Growth data based on the old series is available till FY12 while the revised series is till FY14.
The Congress party said growth numbers were better under the UPA. “It proves that like-for-like, the economy under both UPA terms (10-year avg: 8.1%) outperformed the Modi Govt (avg 7.3%),” the party’s official handle tweeted. “The UPA also delivered the only instance of double-digit annual growth in modern Indian history.”
Over the 1994-95 to 2002-03 period, the restated growth under the new series is lower than GDP estimated according to market prices.
“Growth is higher in the new back series especially for value-added growth,” said Aditi Nayar, principal economist at ICRA. “There is a fairly secular trend after 2003-04.”
The committee said the deviations were not significant and attributed these to discrepancies.
“When we look at the growth rates, there are some differences, although not significant and this is largely due to the ‘discrepancy’ variable, which is found to be highly volatile,” it said.
Former chief statistician Pronab Sen said: “It is a good start but the committee has used some proxies to generate the series so one needs to see how consistent these methods are by themselves.”
The statistics office has not yet taken a call on the numbers.
“These are indicative numbers to decide the approach,” said a statistics ministry official. “These will be sent to the advisory committee on national accounts and based on its approval, we will work on sectoral data.”
Officials of Central Statistics Office were also involved in the recommendations made in the report. NR Bhanumurthy, professor at National Institute of Public Finance and Policy (NIPFP) and member of the committee, said the back series is consistent with the new series and would be helpful for research.
ONE METHOD The committee has restated the old series using one of the possible three ways--the production shift method. This is different from the method currently followed in compiling GDP data.
The committee recommended that the other two methods should be also used to calculate the back series and when these numbers become available then “the time series data based on all the three approaches should be compared for their robustness.”
The CSO has already computed the growth rates of GVA/GDP (gross value added/gross domestic product) estimates from 2004-05 to 2011-12 at current and constant prices using the current methodology. These are tentative estimates that need to be deliberated on by the advisory committee on national accounts, the committee noted in its report, and have not yet been presented.
2004-14 vis-à-vis 2014-19
Vivek Kaul, Manmohan Singh vs Narendra Modi: The real India growth story, April 12, 2019: Livemint
The quality of India GDP data came into question when GDP growth in FY17 was revised to 8.2%—the highest in any year between FY12 and FY19, despite demonetisation
GDP growth under Narendra Modi was faster than under Manmohan Singh. The question, though, is: does this pass the basic smell test?
The quality of India’s economic data in general, and gross domestic product (GDP) data in particular, has come in for questioning in recent months. Those questions only acquired more urgency in January, when the GDP growth in 2016-17 was revised to 8.2%—the highest in any year between 2011-12 and 2018-19.
In 2016-17, a large section of the informal economy, which forms a significant portion of the Indian economy, was severely hit by demonetisation. Hence, the question: how did the economy grow at 8.2% during the year? Between 2009-10 and 2013-14, the period during which Manmohan Singh was the prime minister, the Indian economy grew by 6.7% per year. Between 2014-15 and 2018-19, the Indian economy is supposed to have grown at 7.5% per year. Narendra Modi has been prime minister during this period (from 26 May 2014 onwards).
Hence, the economic growth during the Modi years has been faster in comparison to the growth during the Manmohan Singh years. The question, though, is: does this pass the basic smell test? One way of figuring this out is to take a look at real-time economic indicators which capture the economic decisions of the average Indian.
Since January 2015, when India adopted a new way of calculating the GDP, the growth figure has not been in line with high-frequency economic indicators that reflect the economic decisions of individuals. Unlike GDP growth, the economic indicators used here, from domestic car sales to steel output, are real numbers (except inflation) and not theoretical constructs. So, if domestic car sales are growing, it is a reflection of robust urban consumer demand. If steel production is growing, it shows a robust car industry which uses a lot of steel, and a better physical infrastructure that can be used by individuals, among other things.
Let’s look at 15 economic indicators and see what they suggest. The growth of 11 out of the following 15 economic indicators was better during the second term of Manmohan Singh than Modi’s term. It is worth reminding here that the United Progressive Alliance’s (UPA’s) second term was by all accounts worse than its first term. Hence, we are comparing the worst of Manmohan with the best of Modi.
(1) Domestic two-wheeler sales: Motorcycle sales during the Manmohan Singh’s era grew by 12.44% per year. In Modi’s era, growth was at 5.35% per year. Scooter sales during Singh’s era grew by 25.7% per year. In Modi’s era, the growth was at 13.21% per year. Scooters sell more in urban India than rural India. Motorcycles sell in both urban as well as rural India. The growth rate of 5.35% per year in motorcycle sales during the Modi years is indicative of the agricultural distress and, accordingly, the slow rise in the consumption power of rural India as well.
(2) Domestic car sales: Car sales are an important indicator of how urban India is feeling on the economic front, because no one forces anyone to buy a car. When an individual buys a car (or a two-wheeler for that matter), he or she feels confident enough to make a down payment and pay an equated monthly instalment on the car loan. Car sales grew at 4.42% per year during the Modi years in comparison to 7.92% during the Manmohan years. The major jump during the Manmohan Singh years came in 2009-10 and 2010-11, when car sales increased by 25.22% and 29.08%, respectively. What this again tells us is that urban India, in particular corporate India, has not been very confident on the economic front during the Modi years, irrespective of what they say in public forums. Of course, the growth of cab aggregators Uber and Ola has also played some role in the slowdown of domestic car sales growth in recent years.
(3) Domestic tractor sales: This is a good indicator of how rich farmers are feeling on the economic front. During the Modi years, the tractor sales are expected to grow at 4.49% per year. In comparison, tractor sales grew by 15.73% per year during the Manmohan years. This shows the presence of agriculture distress hurting farmers during the Modi years. In fact, domestic tractor sales in 2013-14 had stood at 634,000. The sales fell over the next two years, and in 2015-16 stood at 494,000. Since then, they have recovered to 724,000 during April 2018 to February 2019.
(4) Incremental retail loans growth: This is an indicator of how a reasonably large section of the population is feeling about their economic future. People usually take a loan when they are confident enough about repaying it. This may not be true about loans given to the industry but is true about retail loans (i.e. home loans, vehicle loans, etc.), given that the bad loan rate of retail loans stands at just 2%. Bad loans are loans which haven’t been repaid for 90 days or more.
Retail loans given out by banks during the Modi era are expected to grow at 19.92% per year in comparison to 22.47% per year during the Manmohan era.
(5) Airline passenger traffic: This is one point that is perpetually brought up by everyone who believes that the Modi government has done well on the economic front. In the Manmohan years, the number of airline passengers grew by 9.20% per year. It is expected to grow at 15.28% per year during the Modi years.
(6) Passenger revenues of Indian Railways: One point which people forget to mention is the fact that the growth in air travel has come at the cost of people upgrading from travelling by Indian Railways. This has led to a slowdown in the growth of passenger revenue of Indian Railways. In the Manmohan years, this was at 10.81% per year. In the Modi years, it is expected to be at 7.32% per year.
(7) Domestic commercial vehicles sales: Robust consumer demand should translate into more investment, with companies expanding to cater to the increasing demand. A good way to check whether this is happening or not is to take a look at domestic commercial vehicle sales. Faster sales indicate robust activity on the infrastructure front as well as the industrial front, which ultimately benefits individuals. Commercial vehicles are used to move around finished as well as semi-finished goods.
During the Modi years, commercial vehicles sales grew at 9.74% per year. In the Manmohan years, they had grown at 10.50% per year. In fact, the growth in commercial vehicles sales during the Modi years has been robust, though it might have been slower than that of Manmohan years. This is primarily on account of the road building programme carried out by the Modi government (as we shall see later).
(8) Cement production: Cement production during the Modi years is expected to grow at 4.32% per year against 7.05% per year during the Manmohan era. The cement consumption has grown at a slow pace during the Modi years despite a massive road building programme.
This essentially tells us two things. First, private sector investment has been slow. Second, the real estate sector, which uses a lot of cement, has been down in the dumps. People aren’t buying new homes. Interestingly, the history of economic development suggests that once people start getting out of agriculture, real estate and construction are the two sectors which they move towards, primarily because both these sectors offer a lot of low-skill jobs. The slow growth in cement production is another indicator that India is not generating enough low-skilled jobs.
(9) Consumption of finished steel: Steel consumption is another great indicator of the investment scenario in the country, as the construction of any new infrastructure requires steel. And better infrastructure essentially leads to an improvement in the ease of living of individuals. Data from India Brand Equity Foundation, a trust established by the ministry of commerce and industry, suggests consumption of finished steel is expected to increase 5.18% per year during the Modi era, in comparison to 7.18% per year during the Manmohan era.
This is indicative of the fact that the investment scenario in India continues to be dull. A dull investment scenario basically means that enough jobs aren’t being created. It also means that the incomes of those who already have jobs are rising at a slower pace.
(10) Income tax growth: This is a good indicator of whether the income of individuals working in the formal sector of the economy is growing or not.
The Modi administration has over the years talked a lot about the income tax collections improving significantly. The income tax collections in the Modi years are expected to grow at 16.85% per year. In comparison, the growth in tax revenue in the Manmohan years was 17.53% per year. The government has also talked about the fact that more people are filing income tax returns now than before. While this is true, this hasn’t exactly translated into faster pace of growth in tax revenue.
(11) Corporation tax growth: Companies pay a higher tax when they sell more stuff, and consequently make a higher profit. They sell more when people consume more. People consume more when they are doing well on the financial front. And that’s possible when the overall economy is doing well. During the Modi years, corporation tax collections are expected to grow by 11.20% per year against 13.09% in the Manmohan years.
(12) Consumption of petroleum products: The consumption of fuel in an economy which is doing well tends to grow at a faster rate. The consumption of fuel products during the Modi years is expected to grow at 5.91% per year against 3.47% during the Manmohan years. This is another economic indicator that has fared better in the Modi years than the Manmohan years. A simple explanation for this lies in the fact that oil prices were much higher between 2011 and 2014 than they have been since then.
(13) Inflation: One of the genuine successes of the Modi government has been on the inflation front. In May 2014, when Narendra Modi took over as prime minister, inflation, as measured by the consumer price index (CPI), stood at 7.72%, with food inflation at 9.21%. In February 2019, inflation was at 2.57%, with food prices falling by 0.66%. During 2018-2019, food prices have risen by just 0.13%.
On the flip side, the lack of food inflation is hurting farmers.
(14) Household financial savings: This is an indicator which tells us how much people are saving. The problem, in this case, is that data is available only from 2011-12 onwards, which is what we will consider. The gross household financial savings when Manmohan Singh was the prime minister grew at 13% per year. In the Modi years (up to 2017-18) they grew by 11.94% per year. As far as net household financial savings (gross household financial savings minus the financial liabilities of households) are concerned, they grew by 13.79% per year in the Manmohan years. In comparison, they grew by 7.38% per year during the Modi years (up to 2016-17).
(15) Road construction: This is another area where the Modi government has done significantly better than the Manmohan Singh government. As of 31 March 2009, the total length of national highways stood at 70,548 kilometres (km). By 31 March 2014, this had increased to 91,287km, at the rate of 5.29% growth per year. By March 2019, the length of national highways is expected to touch 135,676km, with 10,000km of road expected to be constructed during 2018-19. This means an increase of 8.25% per year. Between April and December, 6,715km had already been built.
To conclude, the Manmohan Singh years come out to be much better than the Modi years, in 11 out of the 15 indicators.
This essentially brings us back to the question: When so many economic indicators grew faster in the second term of Manmohan Singh vis a vis the first term of Modi, why doesn’t this reflect in the GDP growth figures of the two eras? The Modi years growing at a faster pace than the second term of Manmohan doesn’t make much sense.
2012-16: fastest growth in 5 years
The Times of India, Jun 01 2016
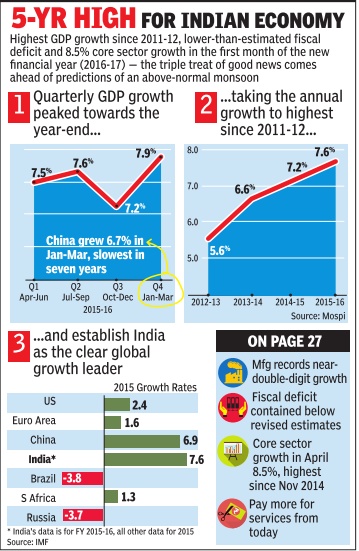
Eco grows fastest in 5 years at 7.6%
The country's economy grew 7.6% in 2015-16, the fastest in five years, while growth in the fourth quarter clocked 7.9%, keeping India ahead as the fastest growing major economy in the world.
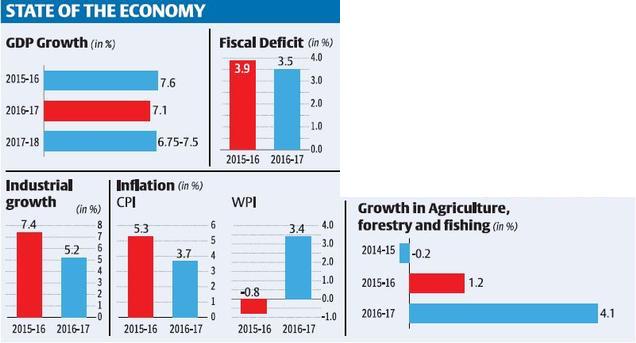
The GDP data also brought cheers for the government, which has completed two years in office and is showcasing revival of the economy as a major achievement. India's 7.9% expansion in JanuaryMarch (fastest in six quarters) is higher than China's 6.7% expansion in the same quarter.In October-December quarter Indian economy grew 7.2%.Growth was powered by strong expansion in the manufacturing, which grew 9.3% in 2015-16 compared to 5.5% in 2014-15 and the farm sector, which clocked a growth of 1.2% in 2015-16 compared to a contraction of 0.2% in the previous year. The growth in the farm sector was despite the impact of a drought. Policy makers lauded the improving health of public finances. “.. India continues to remain a bright spot in the world economy with robust macro-economic and fiscal parameters,“ the finance mini stry said in a statement. Economist said they expect a good monsoon to support improving growth in the months ahead.
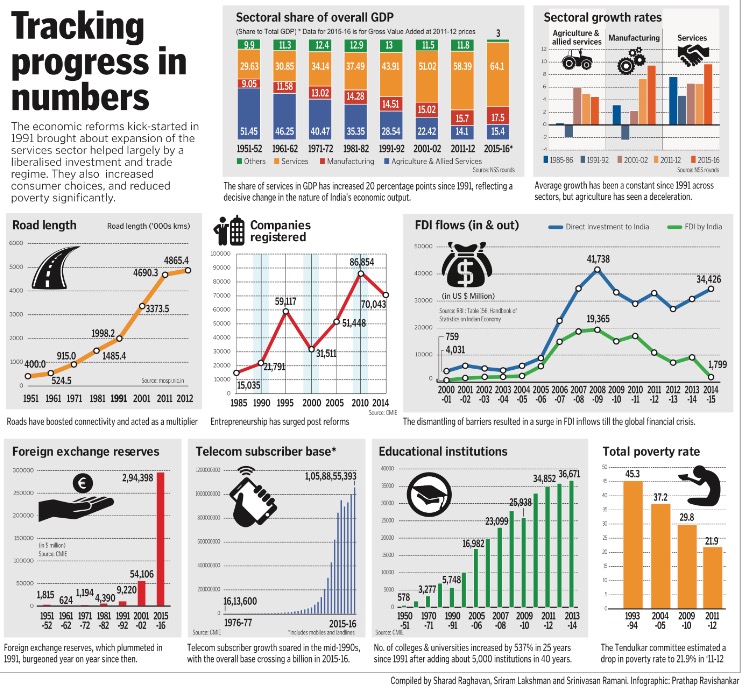
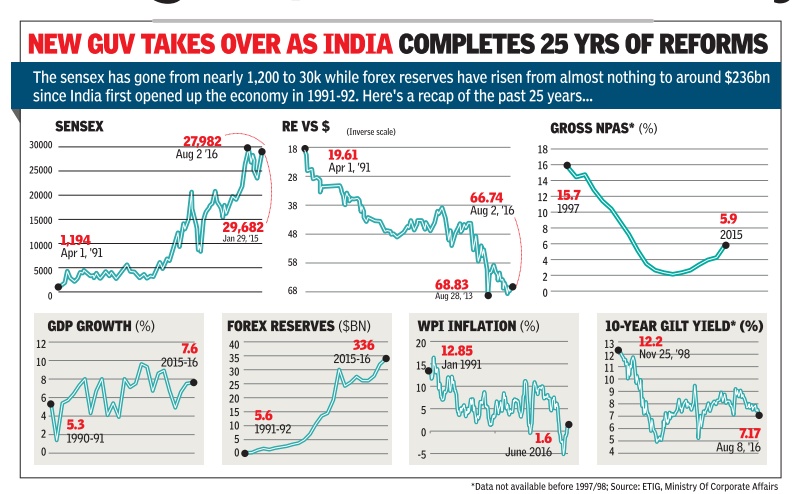


“With renewed forecast of more than normal monsoon this year, the situation in agriculture is expected to improve significantly , which will eventually lead to revival of consumption demand, especially in rural areas,“ said Madan Sabnavis, chief economist at Care Ratings.
“This in turn should also boost investment sentiment and keep food inflation under control. Also implementation of various government schemes and 7th Pay Commission will have an important bearing. With continued strong performance of the service sector, GDP growth in FY17 should see strong contributions from each sector of the economy . We expect GDP growth in FY17 to be around 7.8%,“ he said.
But the numbers also showed some weak spots such as sluggish investment growth.
“Private consumption has emerged as the bulwark of economy in 2015-16, whereas investment growth has slowed.With excess capacity and high leverage, private consumption demand will have to rise further to pare excess capacity and encourage private investment. With normal monsoon, a mild kick to public sector wages and improved transmission of interest rates, private consumption demand is set to get a boost in 2016-17,“ said D K Joshi, chief economist at Crisil.
2014-16: Economic indicators
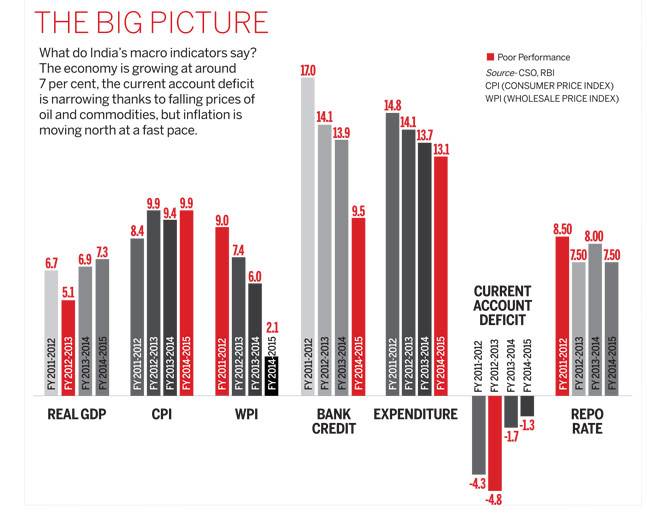
See graphic
Economy, GDP growth, fiscal deficit, industrial growth, inflation and growth in agriculture, forestry and fishing, 2014-17
Facts about Indian economy
2015-16
[The Economic Survey: 2016-17]
Indians on The Move

New estimates based on railway passenger traf c data reveal annual work-related migration of about 9 million people, almost double what the 2011 Census suggests.
Biases in Perception
China’s credit rating was upgraded from A+ to AA- in December 2010 while India’s has re- mained unchanged at BBB-. From 2009 to 2015, China’s credit-to-GDP soared from about 142 percent to 205 percent and its growth decelerated. The contrast with India’s indicators is striking.
New Evidence on Weak Targeting of Social Programs
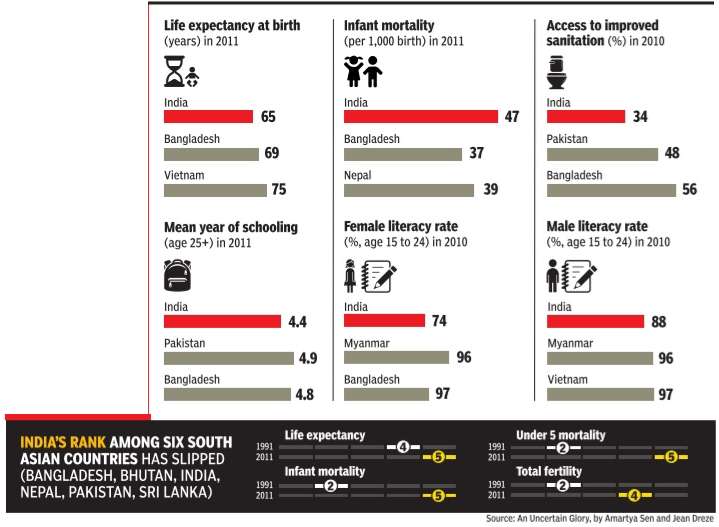
Welfare spending in India suffers from misallocation: as the pair of charts show, the districts with the most poor (in red on the left) are the ones that suffer from the greatest shortfall of funds (in red on the right) in social programs. The districts accounting for the poorest 40% receive 29% of the total funding.
Political Democracy but Fiscal Democracy?
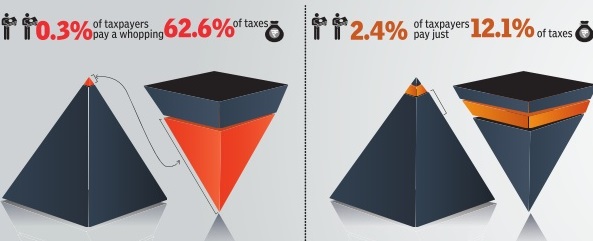
India has 7 taxpayers for every 100 voters ranking us 13th amongst 18 of our democratic G-20 peers.
India's Distinctive Demographic Dividend
India’s share of working age to non-working age population will peak later and at a lower level than that for other countries but last longer. The peak of the growth boost due to the demographic dividend is fast approaching, with peninsular states peaking soon and the hinterland states peaking much later.
India Trades More Than China and a Lot Within Itself
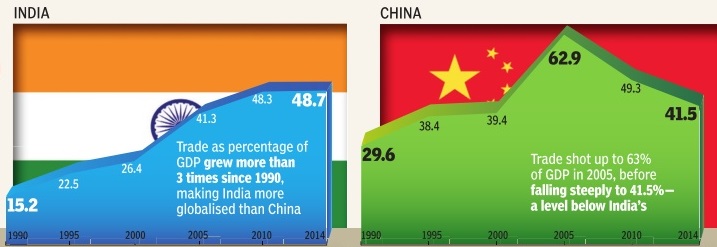
As of 2011, India’s openness - measured as the ratio of trade in goods and services to GDP has far overtaken China’s, a country famed for using trade as an engine of growth. India’s internal trade to GDP is also comparable to that of other large countries and very different from the caricature of a barrier-riddled economy.
Divergence within India, Big Time
Spatial dispersion in income is still rising in India in the last decade (2004-14), unlike the rest of the world and even China. That is, despite more porous borders within India than between countries internationally, the forces of “convergence” have been elusive.
Property Tax Potential Unexploited
Evidence from satellite data indicates that Bengaluru and Jaipur collect only between 5% to 20% of their potential property taxes.
2015-16: economy grew 7.9%
Eco grew 7.9% in '15-16, faster than estimated 7.6%, Feb 01 2017: The Times of India

The Central Statistics Office (CSO) said the economy grew by 7.9% in 2015-16, a shade faster than previously estimated 7.6%, on account of better perfor mance by the farm and industrial sectors. CSO, however, left the figure for 2014-15 unchanged at 7.2%.
The revised growth rate would be the fastest pace of expansion for the economy in five years as data for the new series introduced in 2011-12 is available now. It would give the government ammunition to counter the Opposition's charge that the NDA's handling of the economy has slowed down the growth rate.
CSO had said that the economy was estimated to grow 7.1% during the current financial year but did not factor in the impact of demonetisation. The Economic Survey , released on Tuesday , however, indicated that the growth rate could slip to 6.5% due to the cash squeeze.
Higher growth rate would push up the base and could result in a further slowdown during the current finnacial year. It would, however, help the government show a better fiscal performance since the base has expanded.
Separate data showed the fiscal deficit up to December-end has touched 94% of the full year estimate of Rs 5.3 lakh crore.Fiscal deficit during April-December 2015 was estimated at 88% of the budget estimate.
…vs. 2008-18 (GDP), 2018 (inflation), 2013-18 (deficit)

From: February 1, 2020: The Times of India
See graphic:
The Indian economy in 2019-20 vis-à-vis 2008-18 (GDP growth), 2018 (inflation) and 2013-18 (fiscal deficit).
The economy as in 2017
The Times of India, January 31, 2017
For the first time, along with a host of numbers and dry facts, the Economic Survey presented today also highlighted seven curious things about India, ranging from a perception bias against it to a fiscal disparity within it.
1. Indians on the move
New estimates based on railway passenger traffic data reveal annual work-related migration of about 9 million people, almost double what the 2011 Census suggests.
2. Biases in perception
China's credit rating was upgraded from A+ to AA- in December 2010 while India's has remained unchanged at BBB-. From 2009 to 2015, China's credit-to-GDP soared from about 142 percent to 205 percent and its growth decelerated. The contrast with India's indicators is striking.
3. New evidence on weak targeting of social programs
The Survey says that welfare spending in India suffers from misallocation. Districts with the most poor are the ones that suffer from the greatest shortfall of funds in social programs. The districts accounting for the poorest 40% receive 29% of the total funding.
4. Narrow tax base
India has seven taxpayers for every 100 voters, ranking us 13th amongst 18 of our democratic G-20 peers.
5. India trades more than China
As of 2011, India's openness - measured as the ratio of trade in goods and services to GDP - has far overtaken China's. India's internal trade is also comparable to that of other large countries.
6. India's distinctive demographic dividend
There will a steady rise in India's working age population. While it will be slower compared to other countries, it is expected to last for much longer. Peninsular states are fast approaching the peak of the growth boost due to the demographic dividend.
7. Income divergence within India
During the last decade (2004-14), spatial dispersion in income has been on the rise in India, unlike the rest of the world and even China. Despite more porous borders within India than between countries internationally, the geographical graph of per capita income is skewed.
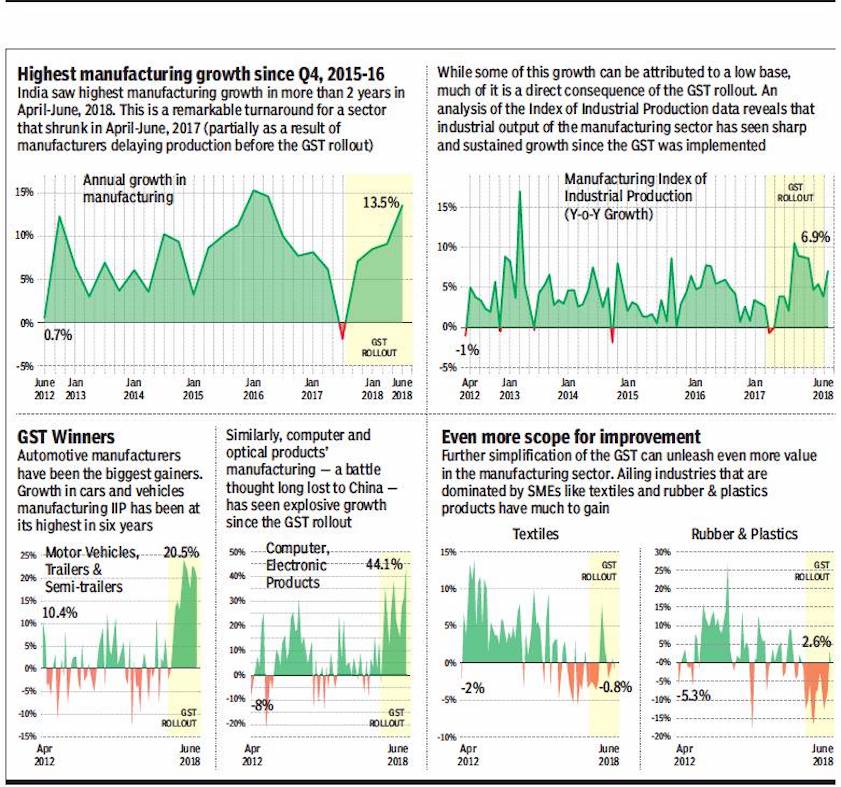
2012-18: impact of GST on manufacturing
From: September 3, 2018: The Times of India
See graphic:
2012-18- The impact of GST on manufacturing
Economic indicators: 2012-14 vs. 2014-17
See graphics:
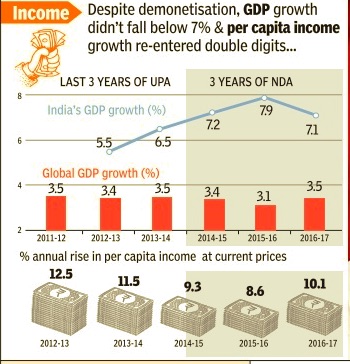
1. GDP growth, 2011-17, year-wise and % annual rise in per capita income at current prices, 2012-17, year-wise
2. Inflation dynamics, 2011-17, year-wise and merchandise exports, 2011-17, FDI inflows, 2013-17, Industrial production, 2012-17, year-wise
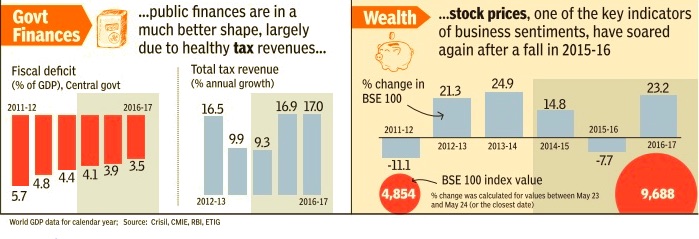
3. Fiscal deficit, 2011-17, total tax revenue, 2012-17, fluctuations in stock market (BSE), 2011-17, year-wise

Indicators 2013-18 (inflation, monsoons, crude prices)
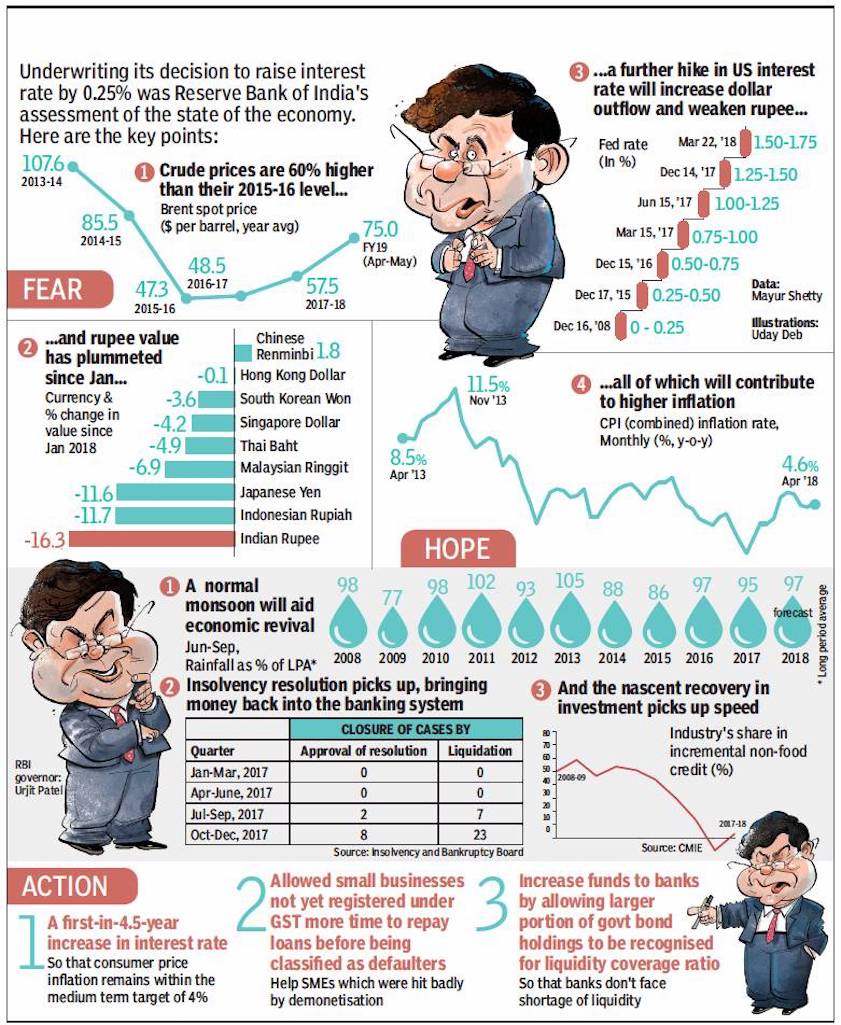
ii) Performance of monsoons, 2008-17;
iii) Value of rupee, Jan- June, 2018;
iv) Crude oil prices, 2013-18
From: June 8, 2018: The Times of India
See graphic:
i) Inflation in India (CPI): 2013-18;
ii) Performance of monsoons, 2008-17;
iii) Value of rupee, Jan- June, 2018;
iv) Crude oil prices, 2013-18
2014, May- 2018, May
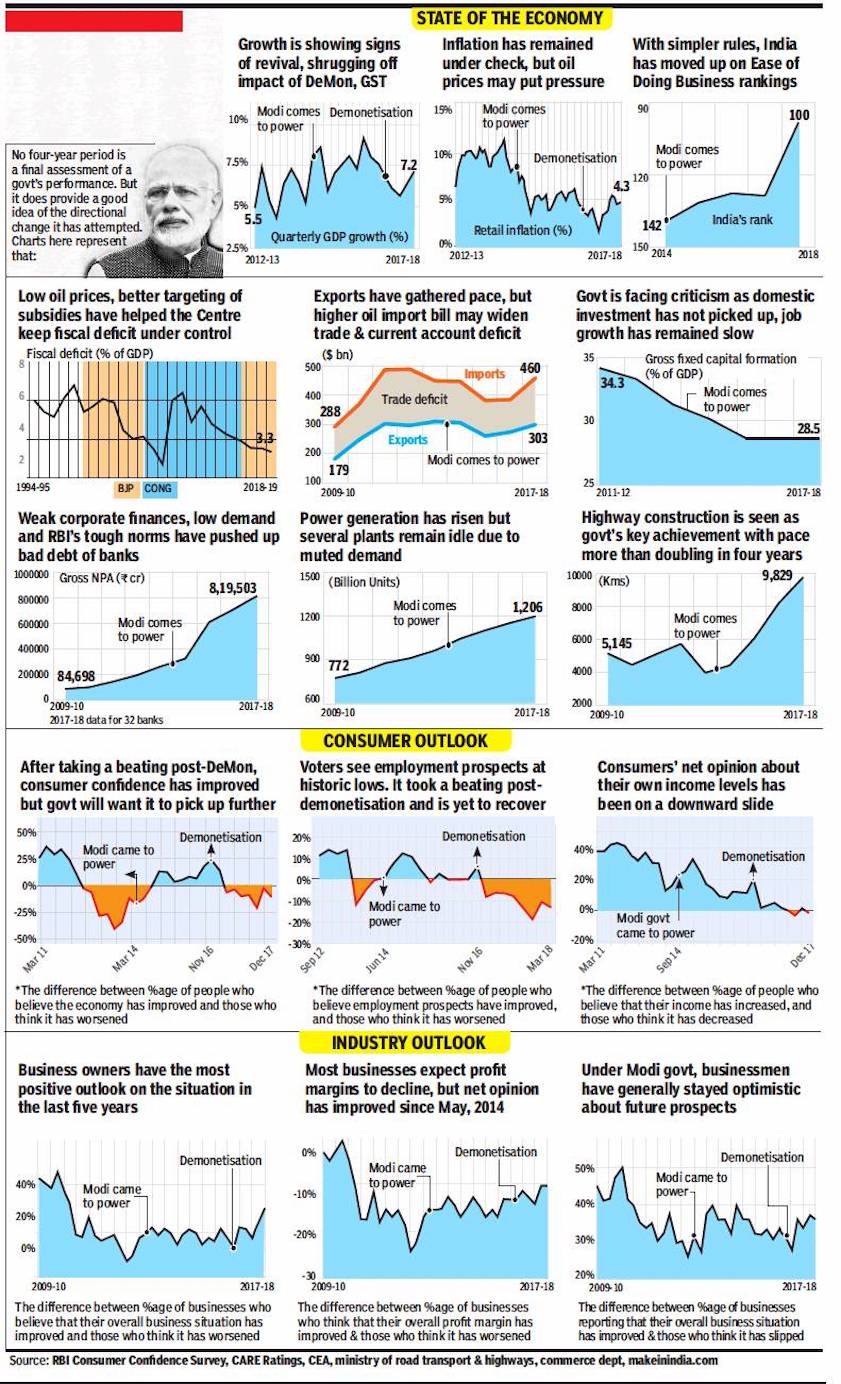
From: May 26, 2018: The Times of India
See graphic:
Four years of Modi government an economic report card
2014, May- 2019 Jan
For individual Indians
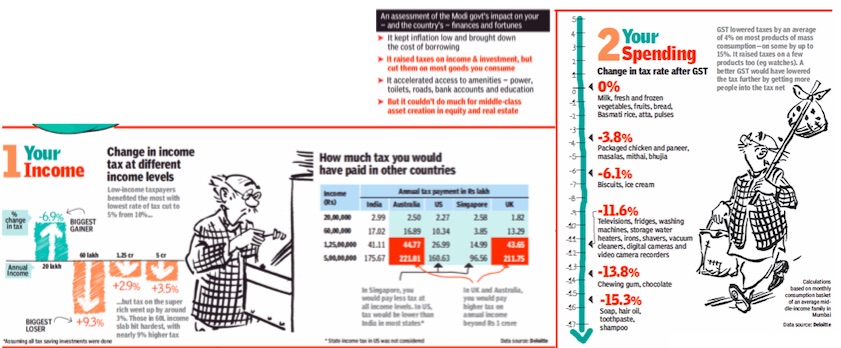
i) Income;
ii) Spending
From: February 2, 2019: The Times of India
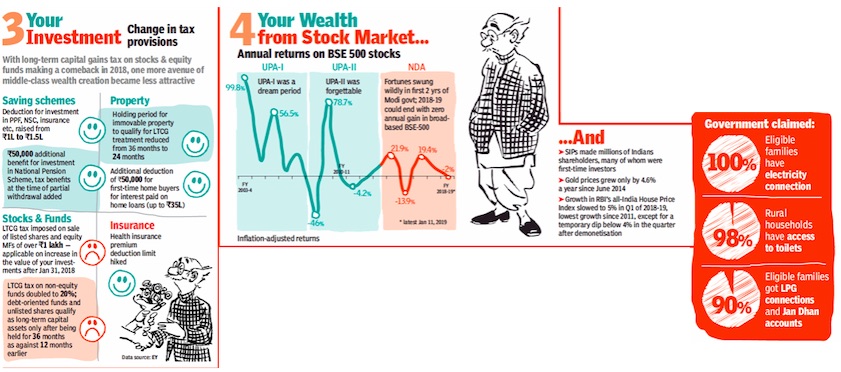
iii) Investment;
iv) Wealth from stock market
From: February 2, 2019: The Times of India
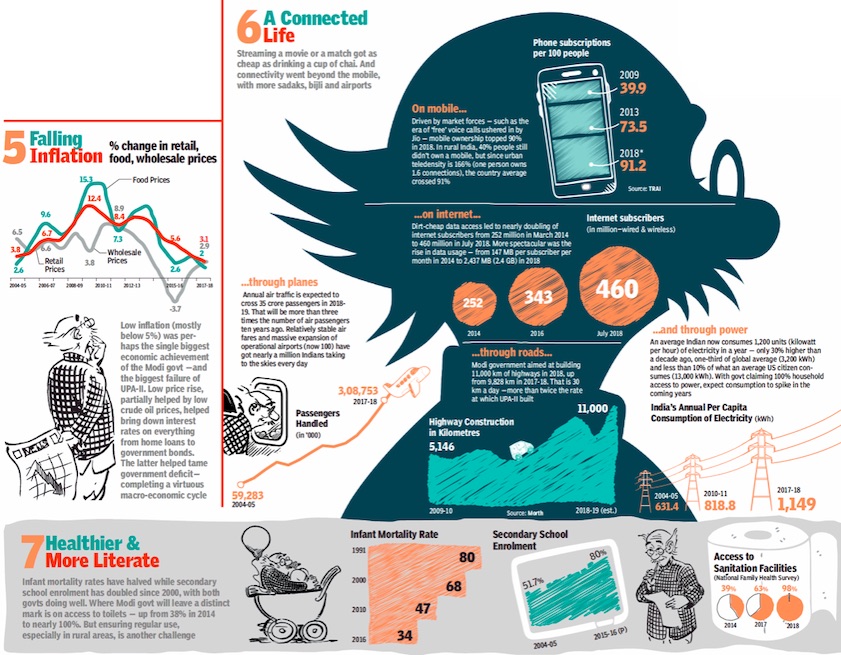
v) Falling inflation;
vi) A connected life and
vii) healthier and more literate
From: February 2, 2019: The Times of India
See graphics:
2014, May- 2019 Jan- an economic report card for individual Indians-
i) Income;
ii)Spending
2014, May- 2019 Jan- an economic report card for individual Indians-
iii) Investment;
iv) Wealth from stock market
2014, May- 2019 Jan- an economic report card for individual Indians-
v) Falling inflation;
vi) A connected life and
vii) healthier and more literate
For the country as a whole
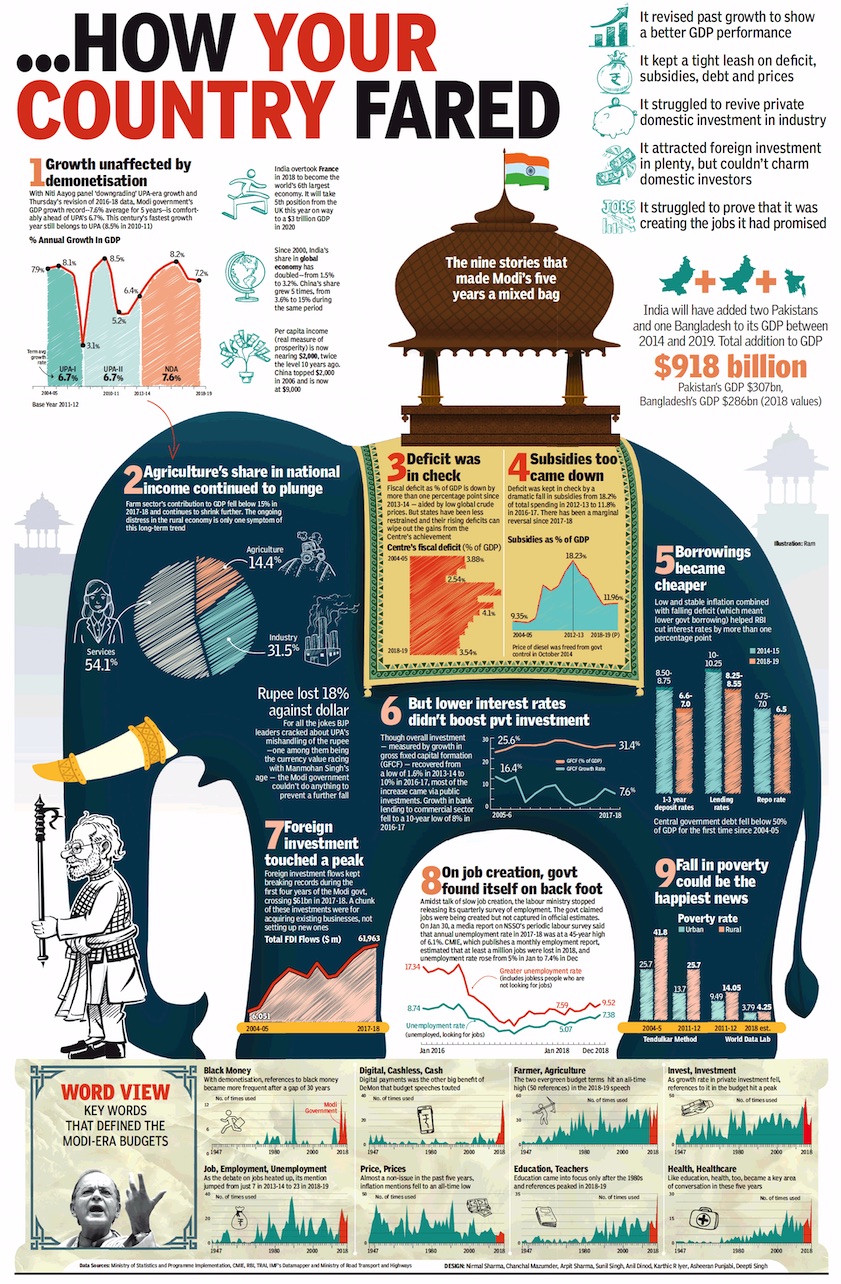
From: February 2, 2019: The Times of India
See graphic:
2014, May- 2019 Jan: an economic report card for the country as a whole
Oct 2016- Jan 2018: industry, manufacturing, inflation
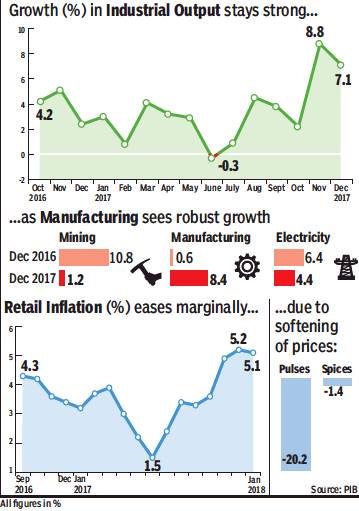
From: Retail prices ease, factory output beats expectations, February 13, 2018: The Times of India
Retail prices ease, factory output beats expectations, February 13, 2018: The Times of India
Retail inflation cooled in January on the back of slowing food prices, while industrial output growth in December was better than expected, thanks to robust manufacturing and capital goods sectors.
Data released by the Central Statistics Office (CSO) on Monday showed inflation, as measured by the consumer price index (CPI), rose an annual 5.1% in January, slower than previous month’s 5.2%. Consumer food prices also cooled and increased 4.7%, lower than near 5% increase in December. Housing prices remained firm, and surged 8.3% during the month.
Earlier this month, RBI kept interest rates unchanged and flagged risks to inflation from several factors, including the government missing the fiscal deficit target for 2017-18. Economist said inflation in non-food items continues to be worrisome, with clothing and footwear
(4.7%), housing (8.3%), fuel
(7.7%) household goods
(4.9%), all being high.
“However, elevated fuel prices and the base effect will keep CPI inflation in the vicinity of 5% for the rest of the year till March,” said Madan Sabnavis, chief economist at Care Ratings, adding that cooling food prices will have a calming effect on retail inflation.
Separate data released by the CSO showed industrial output growth rose 7.1% in December, slower than previous month’s upwardly revised 8.4% but still higher than market expectations. The manufacturing sector rose an annual 8.4% in December, compared to 0.6% in same month last year.
Several data sets in the past few months have pointed to a revival in the manufacturing sector as it shrugs off the impact of demonetization and rollout issues linked to the GST. Economist said the robust trend in factory output augured well for overall growth.
“Higher growth in vehicles and transport bodes well for the economy. We expect IIP growth to trend higher in January also as commercial vehicle sales have expanded by 36.6%. The positive contribution of cement, diesel and even two wheelers augurs well for economic recovery, especially for rural economy,” said Soumya Kanti Ghosh, group chief economic adviser at SBI.
2016 Nov-2018 Dec
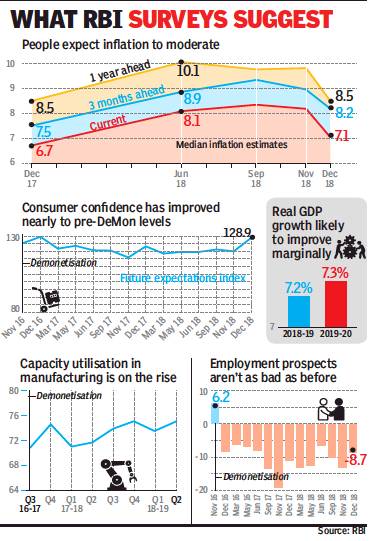
From: View within RBI: Rate cut needed now, inflationary fear not a worry, February 9, 2019: The Times of India
The Monetary Policy Committee (MPC) headed by RBI governor Shaktikanta Das has opted to pare key policy rates based on real-time analysis, leaning on findings of its surveys, prevailing market conditions and extensive consultations with stakeholders, instead of postponing a decision for fear of inflationary pressures flaring up.
Although Urjit Patel had not explicitly changed the monetary policy stance in his last policy announcement in December, the assessment was that the governor, who resigned later in the month, was dovish in his stance. Besides, the RBI’s inflation modelling has been under scrutiny for the last 18 months and critics have faulted the central bank for misreading the inflation situation.
While deputy governor Viral Acharya acknowledged the problems, he said the RBI has sought to fix them. “We started a little bit of grassroots work. We are talking to agri specialists, agri economists in the country to get a better sense. So, hopefully, we’ll get better with time. Not to mention we have had extensive consultations with a lot of experts over the last two months or so, and the effort is to fine tune the system as much as possible.”
Apart from retail inflation, which was estimated at 2.2%, the RBI’s internal survey showed that inflationary expectations were well-anchored. Although oil price pressure has remained for the last few months, agriculture economists reckon that food inflation will remain benign, especially in the wake of a good winter. In fact, Das pointed to higher wheat yield this year due to favourable weather conditions.
The other positive that weighed on the MPC was an improvement in consumer confidence as well as business confidence, amid an improvement in capacity utilisation by industry. In fact, there are pockets in the manufacturing space where capacity constraints have started to emerge and a lower interest rate is expected to help provide a boost to investment and bridge this gap in the coming months. With buyer sentiment improving, demand in several other sectors is expected to rise.
The consumer confidence survey suggests that respondents expect an improvement on almost all counts. The only exception is income, where the sentiment seemed to sour a little in December, compared to the previous month. But, they are upbeat on investment, employment and income a year down the line.
Similarly, on business expectations, more respondents now believe that there will be an improvement across the board — from production, to order book and capacity utilisation — with selling price and employment being two parameters on which they were less upbeat than the previous survey.
2017 Q4> 2019 Q1: growth
August 1, 2019: The Times of India
In trade war, India only Asian nation growing export share
NEW DELHI: The only major Asian economy that’s grown its export share since the start of the tariff wars in 2018 is the one with the fewest trade links to China.
India’s share of world exports rose to 1.71% in the first quarter of 2019 from 1.58% in the fourth quarter of 2017, data compiled by Bloomberg show. The share of every other economy among Asia’s 10 biggest exporting nations fell in the same period. Part of the reason for India’s outperformance is that it’s not as integrated into global manufacturing supply chains as peers, which means exporters are cushioned from rising trade tensions in the region.
It’s a sentiment that was flagged by Reserve Bank of India (RBI) governor Shaktikanta Das in a recent interview.
“India is not part of the global value chain,” he said. “So, US-China trade tension does not impact India as much as several other economies.”
China is the biggest buyer of goods from South Korea and Japan, whose share of world exports have fallen the most in Asia. For India, China is the third-largest market, after the US and the UAE.
“Our biggest advantage is that our product basket and market basket are both quite diversified,” said Rakesh Mohan Joshi, a professor at the Indian Institute of Foreign Trade in Delhi.
Trade tensions between the US and China have given India an opportunity to ramp up exports to both countries, according to Ajay Sahai, director general and chief executive officer of the Federation of Indian Export Organisations.
India’s exports to the US grew at the fastest pace in six years in the year ended March 2018, while exports to China surged 31%, the second highest annual pace of growth in more than a decade, data from ministry of commerce show.
“China is more willing to give market access to India than ever before,” said Sahai, pointing to increased access for products such as rice, fruits and vegetables, with potential for greater exports of pharmaceuticals and automobile components to China.
On the other hand, India’s exports to the US could lose momentum. US President Donald Trump has criticised India for its tariffs on US products, and withdrew trade concessions on $6.3 billion of Indian goods on June 1. India responded with higher tariffs on about 30 American products.
India’s relative immunity from trade tensions could be coming to an end. Exports plunged 9.7% in June from a year ago, the biggest decline in more than three years.
2017-18: rural demand slumps to lowest since 1973
Rural Consumer Demand Slumps To 4-Decade Low: Report
Consumer spending in the country's rural areas has plummeted to a four-decade low, a leading business daily reported, bringing more bad news for Prime Minister Narendra Modi's government that is struggling to revive a stuttering economy.
Consumer demand in villages fell 8.8 per cent between July 2017 and June 2018 - the sharpest 12-month drop since 1972-73, the Business Standard reported, using unpublished data recorded by the National Statistical Office (NSO).
Two-thirds of the 130 crore population live in rural areas, making it a key economic driver. But spending on food, education and clothing declined, with demand for essential items such as cereals plunging 20 per cent, the newspaper said.
The report should have been released in June, but was pushed back because of its "adverse" findings, Business Standard said citing sources familiar with the matter.
A government official told AFP the report was not finished.
"The NSO report is still under processing and not validated, and many officials are not privy to the data," said AK Mishra of the ministry of statistics.
The data "can only be confirmed once the ministry publishes the report", Mr Mishra added.
If the findings are confirmed, it would ring yet another alarm bell over Asia's third-largest economy, which has endured five consecutive quarters of slowing growth.
In January, Business Standard reported that unemployment had surged to a four-decade high during PM Modi's first term in power, citing unpublished data from the ministry.
The delay in releasing the jobs report prompted a top government statistician to quit in protest. The report confirming the joblessness data was finally released in May, after PM Modi was re-elected with a thumping majority.
Congress leader Rahul Gandhi attacked the government over the new report, accusing it of trying to bury unflattering data. "Modinomics stinks so bad, the government has to hide its own reports," he tweeted. To counter the fall in demand for everything from cars to cookies, the central bank has trimmed interest rates five times in a row, but to little effect.
Experts say India's economy has never recovered from PM Modi's surprise cash ban in 2016, which made 86 percent of the currency in circulation void.
The rollout of a nationwide Goods and Services Tax (GST) in July 2017 added to the crisis as businesses struggled to adjust to the new rules, say experts.
16 Comments In October, market researcher Nielsen said rural consumption had slumped to a seven-year low, highlighting falling income for farmers who are struggling with mounting debt.
Govt does not release consumer expenditure survey, 2017-18
Nov 15, 2019: The Times of India
NEW DELHI: The government said that it would not release the Consumer Expenditure Survey results of 2017-18 because of "data quality issues".
The Ministry of Statistics and Programme Implementation junked a media report citing a fall in consumption expenditure for the first time in more than four decades, saying that the ministry follows a rigorous "data vetting" process before releasing such reports.
"All such submissions which come to the Ministry are draft in nature and cannot be deemed to be the final report," it said in a statement.
The release said that results of the survey were examined and it was noted that there was a significant increase in the divergence in not only the levels in the consumption pattern but also the direction of the change when compared to the other administrative data sources like the actual production of goods and services.
"Concerns were also raised about the ability/sensitivity of the survey instrument to capture consumption of social services by households especially on health and education," it said.
The National Satistical Office has referred the matter to a committee of experts which noted the discrepancies and came out with several recommendations including refinement in the survey methodology and improving the data quality aspects on a concurrent basis.
"The recommendations of the committee are being examined for implementation in future surveys," the release said.
The NSS Consumer Expenditure Survey generates estimates of household monthly per capita consumer expenditure (MPCE) and the distribution of households and persons over the MPCE classes.
It said the Ministry is separately examining the feasibility of conducting the next Consumer Expenditure Survey in 2020-2021 and 2021-22 after incorporating all data quality refinements in the survey process.
The Consumer Expenditure Survey (CES) is usually conducted at quinquennial intervals and the last survey on consumer expenditure was conducted in the 68th round (July 2011 to June 2012).
It is designed to collect information regarding expenditure on the consumption of goods and services (food and non-food) consumed by households. The results, after release, are also used for rebasing of the GDP and other macro-economic indicators.
Congress slams government
Senior Congress leader Jairam Naresh lashed out at the government for not releasing the report.
Congress spokesperson Pawan Khera said at a press conference here that leaked report shows that the person who spent Rs 1501 in a month in 2011-12 was spending Rs 1446 in 2017-18.
He said the fall in spending was 8.8 per cent in rural India. "This is a serious issue. Rural India was spending Rs 643 in a month in 2011-12, it is spending Rs 580 in 2017-18," he alleged.
Khera said that a committee of statistics department had cleared the data to be released in June this year but the "government did not allow it".
Congress leaders Rahul Gandhi and Priyanka Gandhi Vadra also targeted the government on the issue.
Priyanka Gandhi alleged in tweets that consumer spending has collapsed.
"Successive govts have striven tirelessly to combat poverty and empower the people. This govt is making history by driving people into poverty: while rural India faces the dire consequences of their policies, the BJP ensures that their corporate friends become richer by the day. Usually, governments work towards eradicating poverty, not towards eliminating data," she said.
Earlier today, Rahul Gandhi had tweeted — "Modinomics stinks so bad, the government has to hide its own reports.”
2018 Aug vs. June: mixed trends

From: October 1, 2018: The Times of India

From: October 1, 2018: The Times of India
See graphics:
The growth of the Indian economy, June, July, Aug 2018: Passenger vehicles, Commercial vehicles, CIL output, Non-oil export
The growth of the Indian economy, June, July, Aug 2018: Rail freight, Airlines, Petrol, Bank deposits, Non-food bank credit
2018 to 19: growth declines
August 2, 2019: The Times of India
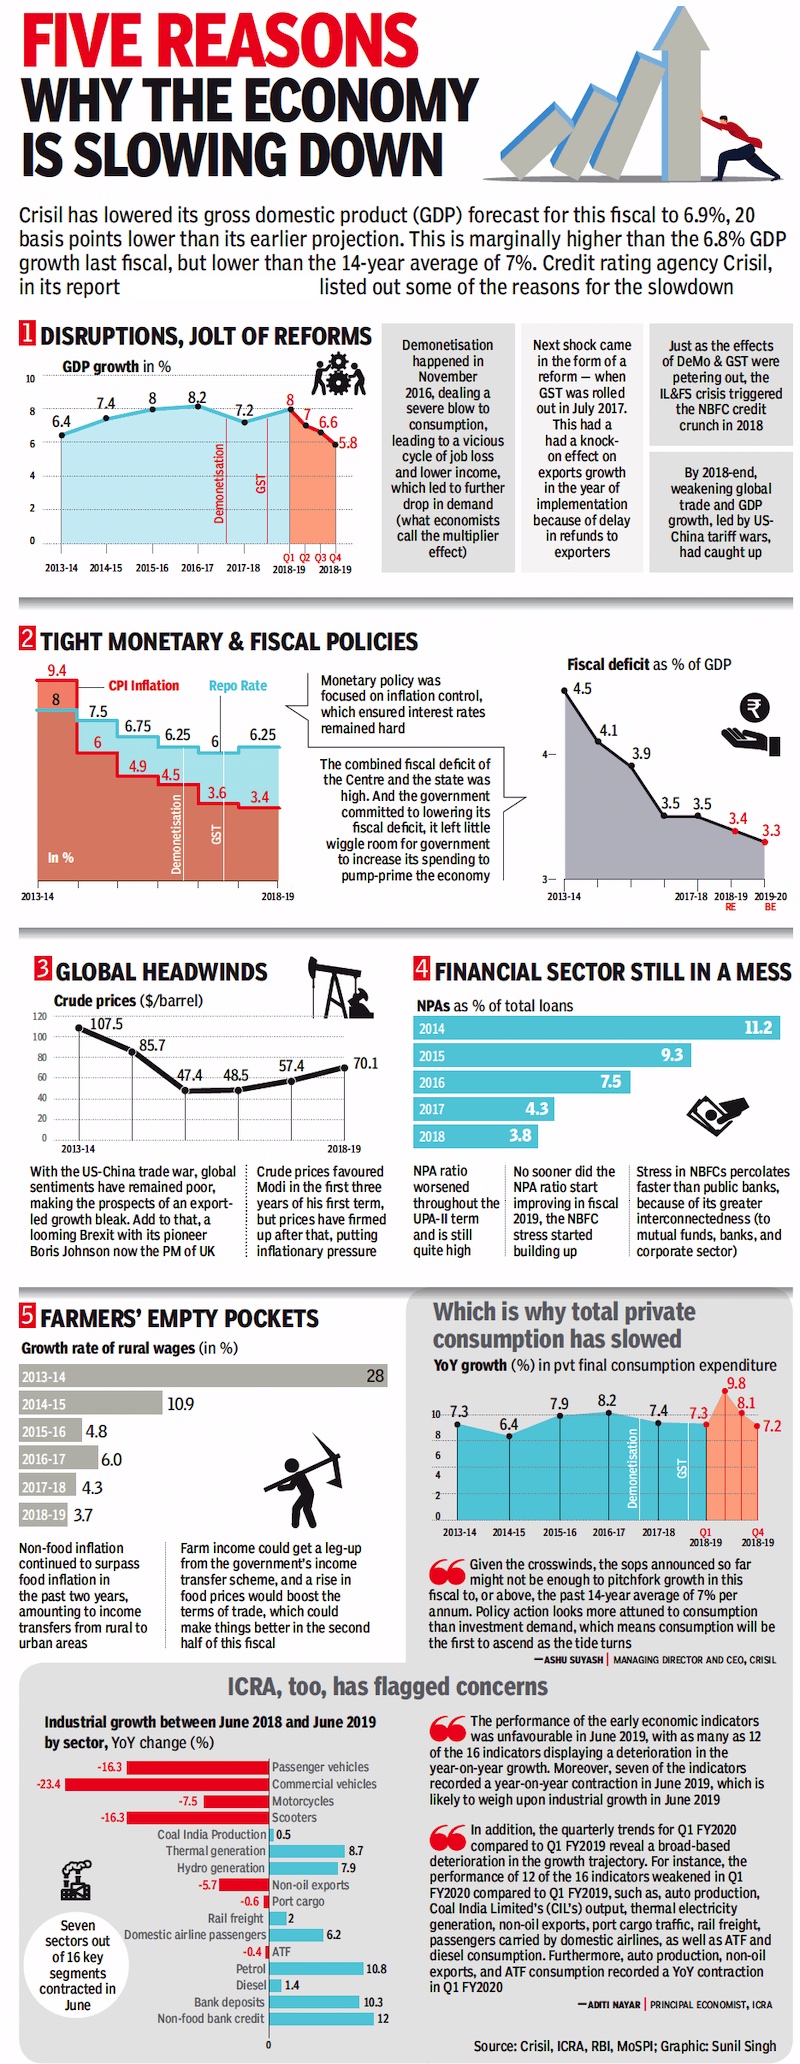
From: August 2, 2019: The Times of India
See graphic:
2018 to 19: Five reasons why the economy slowed down
2018-19: The main trends
Rupali Mukherjee, August 30, 2019: The Times of India
Real estate is the most preferred investment asset class for high net-worth individuals (HNIs) in next 3 years, followed by stock markets, according to the Hurun Indian Luxury Consumer Survey. This is despite the slowdown in real estate witnessed over the last three years, and turbulence in stock markets over the past 18 months. This is the first year of an India survey by Hurun Research Institute, which aims to track changes and preferences of lifestyle, consumption habits and brand cognition of HNIs.
Around 31% respondents believe that their investment allocation towards real estate sector will grow in the next two years. In line with IMF’s prediction of economic growth, equity markets followed by fixed income is the second and third choice, respectively. Interestingly, 21% respondents want to reduce allocation to real estate in the short term, and around 20% want to reduce exposure to gold. While 9.5% said investments into real estate will be at a status quo, the remainder believed that it would decline.
The UK is the most popular investment destination for HNIs. Singapore takes second place, and Canada along with the US, which is forecast to grow 2-4% (at constant exchange rates this year), rank third. Nearly a fourth (24%) are “very confident” about the Indian economy over the next three years, 40% “confident”, while around 36% are pessimistic. As many as 36% of HNIs said their investment philosophy for this year would be “avoiding risk”, while only 14% will make “active investments”.
Among collectibles, HNIs prefer to spend the most on art and jewellery. Nearly half the respondents have two to three cars, 37% have only one car and 6% have more than five cars. Up to 46% of them renew their car every three to four years.
How serious is India’s economic slowdown?
August 29, 2019: The Times of India
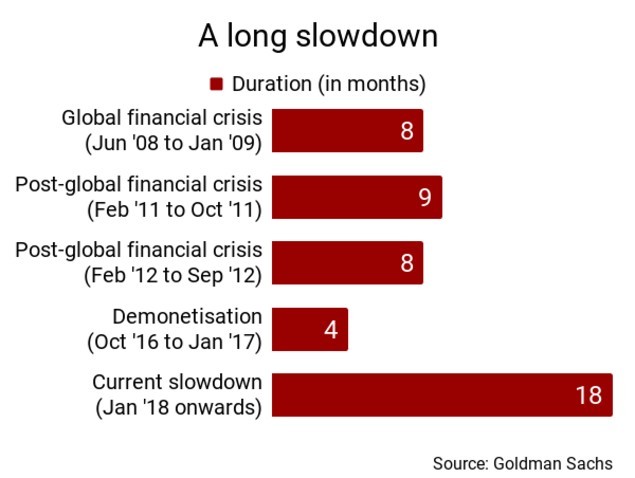
From: August 29, 2019: The Times of India
How serious is India’s economic slowdown?
NEW DELHI: According to global broking firm Goldman Sachs, as of June 2019, the current slowdown has lasted for 18 months, making it is the longest since 2006.
More than half of the decline in economic activity has been driven by a consumption slowdown, which appears to be broad-based, with components other than auto contributing more than twice the effect of autos to the total consumption decline, says the brokerage in a report.
Is it exaggerated?
A State Bank of India (SBI) report says that while stagnant rural wage growth reinforces the slowdown, other factors may be at play in specific sectors. Auto sector slowdown, for instance, may be part of the unfolding global crisis as auto sales in Asia-Pacific too are expected to fall.
Similarly, low FMCG volume growth in the last quarter may be due to the unusually high growth in the previous one and also because of a shift in consumer preferences towards healthier (for biscuits and snacks) or natural (beauty products) options, bigger packets (due to e-retailing) or good quality products of unlisted companies.
However, the SBI report also says that out of the 33 indicators it tracks, the number of those accelerating has fallen from 17 in March to 9 in June. The principal economic advisor to the government says "the slowdown does not mean economic crisis" and it is "not as bad as the 2008 Lehman crisis."
When will it end?
Goldman Sachs expects a moderate pick-up in economic activity by March next year if there is a "substantial improvement in consumer confidence over the course of the year, and a significant easing in domestic financial conditions."
The chief of another broking house, however, thinks that a global recession may start "by the end of 2020 or early 2021" and if that happens Indian economy will suffer too.
India Ratings, a Fitch group company, said on Wednesday that it expects GDP growth for 2019-20 to tumble to a six-year low at 6.7% instead of 7.3% it had said earlier because band-aid measures will not help the economy in the long term.
June 2017> June 2019
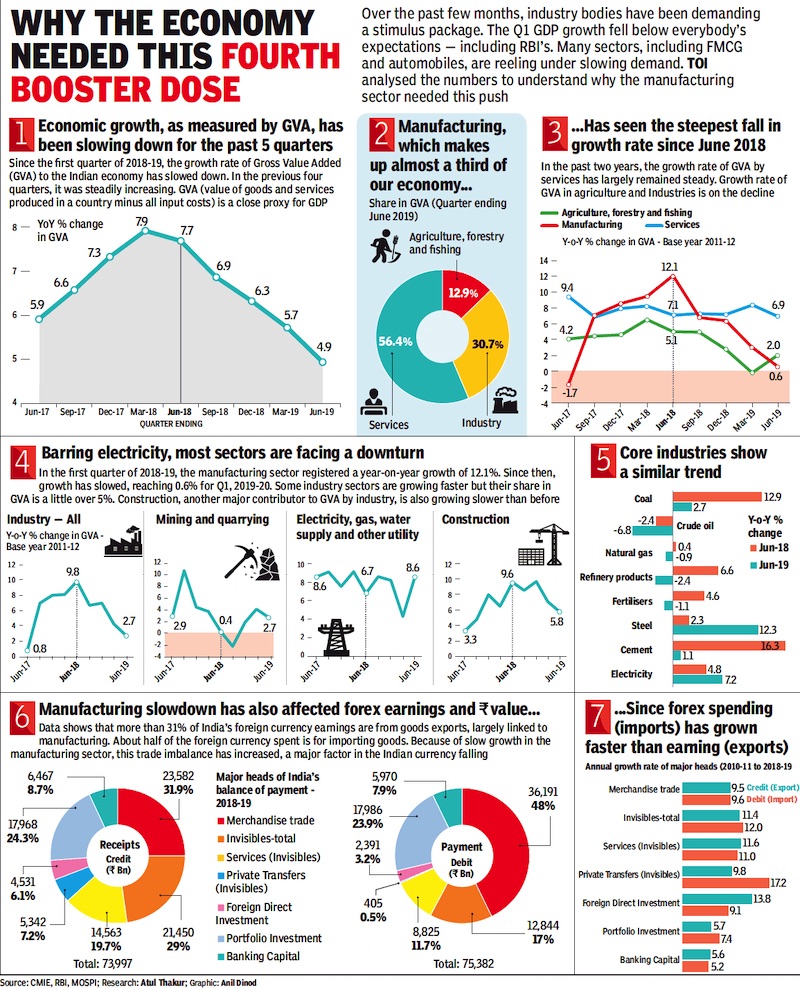
From: Sep 21, 2019: The Times of India
See graphic:
The Indian economy, June 2017> June 2019
2018-20
GVA growth 2019-20 vis-à-vis 2018-19
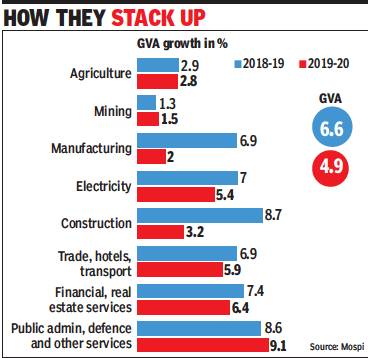
From: TNN, January 8, 2020: The Times of India
See graphic:
GVA growth 2019-20 vis-à-vis 2018-19
2019: Ports, railway freight slow down

From: Nov 16, 2019: The Times of India
See graphic:
The slowdown in freight handled by ports, railways.
Carbon footprint
2020: an all- India survey
Shobita Dhar, January 30, 2021: The Times of India
Getting people out of poverty will not lead to higher carbon emissions. Countering popular wisdom, a study has found that whether one goes by household expenditure or by socio-religious profile, it is the carbon burden of the wealthy that needs to be addressed first.
In a survey of 623 of the country’s 741 districts, covering over 2 lakh households, by researchers at Japan’s Research Institute for Humanity and Nature, Gurgaon emerged as the one with the highest carbon footprint — over 2 ton CO2/capita. That’s 10 times higher than the district with the smallest footprint in the study, Boudh in Odisha (0.21 ton CO2/capita), four times the national average (0.56 ton CO2/capita) and double that of Delhi (0.98 ton CO2/capita), the study, published in Elsevier journal ‘Global Environment Change’ this month, said.
“We wanted to find out if differences in standards of living or religions affect carbon emissions. Another objective was to estimate how much poverty alleviation contributes to increased carbon emissions,” lead author Lee Jemyung told TOI. “India’s results highlight the need to differentiate individual responsibilities for climate change in national and global climate policy.”
High expenditure households (who live on more than $4.93 a day) in India are responsible for nearly seven times higher carbon emissions than low expenditure households (living on $1.9 a day or less). “First, variations in individual expenditure result in different levels of absolute consumption and associated carbon emissions. Second, the profile of individual consumption activities also varies according to expenditure levels,” the study said.
1950-2011
June 6, 2019: The Times of India
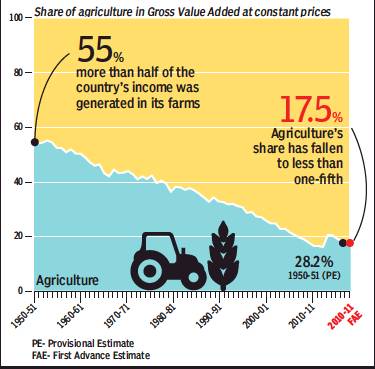
From: June 6, 2019: The Times of India
Indian Economy No More A Bet On Monsoon As Farming’s Role Shrinks
For years, India’s economy leaned heavily on agriculture, so a poor monsoon could rattle it. But agriculture’s share in the gross value addition (GVA) — value of goods and services minus input costs — to the economy has been steadily falling. It stood at 55% at the start of the first five-year plan in 1950-51, but dropped below 50% by 1961-62. Today, agriculture contributes less than a fifth of India’s GVA
Balance of payment/ current account deficit
2016-2017
Deficit widens due to lower remittances, March 24, 2017: The Times of India
Remittances from overseas Indians has been dropping continuously for the last five quarters, contributing to the widening of current account deficit (CAD). The trade gap has also widened due to lower software exports.
Balance of payment data released, shows that net personal transfers -which are largely remittances by Indians employed overseas--fell to $13.6 billion during the demonetisation quarter from $14.9 billion, a drop of 9.7%.
According to numbers released by the RBI, the current account deficit widened to $ 7.9 billion (or 1.4% of GDP) in Q3FY17 as compared to $ 7.1 billion (1.4% of GDP) in Q3FY16 and $ 3.4 billion in (0.6% of GDP) in Q2FY17. The CAD is the difference between income from exports and imports, plus the difference from between outbound and inbound investment income.
A statement issued by the Central bank said that the CAD widened despite a slightly lower trade deficit year-on-year, primarily on account of a decline in net invisibles receipts. Invisible includes remittances from software, services and money sent by Indians working oversea. Net services receipts moderated compared to Q3FY16, due to a fall in earnings from software, finan cial services and charges for intellectual property rights.
From April to December, however, the deficit halved to 0.7%, from 1.4% a year ago.
This was primarily because of fall in earnings from software, financial services and charges for intellectual property rights.
Earnings from software exports have been declining year-on-year, but the third quarter has seen a sequential increase in software exports over the second quarter.
The net foreign direct investment of $9.8 billion during the reporting quarter was marginally lower than last year. The RBI said that there was a net outflow of portfolio investment of about $11.3 billion during the period in both equity and debt segments, as against a net inflow of $0.6 billion in the year-ago period. During the current fiscal, net FDI rose 12.3% to $30.6 billion as compared to April-December 2016.
Governments and economic growth
1947-2018: India has performed better under ‘weak’ governments
According to the World Poverty Clock, an online database… About 41 Indians escape extreme poverty every minute.
India’s achievement is creditable by any yardstick. But it occurs against a backdrop of rising prosperity worldwide.
A political paradox of sorts has accompanied India’s upward economic arc. For the first four decades of independence, single-party majority governments delivered anaemic growth. India’s most dramatic assault on poverty has come in the coalition era that followed Rajiv Gandhi’s defeat in the 1989 general election.
Between 1950 and 1980, India’s economy expanded at an annualised average of 3.6%. Per capita income grew at a sluggish 1.5% per year. These figures ticked upward in the 1980s, but the real breakthrough only came after India embraced liberalisation and globalisation in 1991. Since then per capita income has grown on average by 4.9%. Since 2004, it has grown even faster – by over 6.1% annually. In this period, India has lifted more than 350 million people out of extreme poverty.
Why did weak governments deliver better results than strong ones? The simple answer: in India, the era of single-party majorities coincided with the heyday of state planning. After Independence, instead of embracing a market economy, where supply and demand determine production, India scurried down the rabbit hole of socialism where pointy-headed bureaucrats and their political masters called the shots.
Under both Jawaharlal Nehru and Indira Gandhi the government raised trade barriers, nationalised private enterprises, raised extortionate taxes on the rich, and told companies how to run their business. Had they instead used their power to build infrastructure, strengthen rule of law, encourage private enterprise and educate the masses, India need not have waited this long to nearly wipe out poverty.
But as four years of Modi have shown, a strong government’s tendency to overreach remains a recurring national problem.
Only a strong government could have come up with a cockamamie idea like demonetisation, deemed too crazy to try even by a basket case economy like Venezuela. In a less dramatic – but nonetheless destructive – vein the Modi government has armed tax inspectors with extortionate powers, escalating the tax terrorism the Bharatiya Janata Party (rightly) protested when in opposition.
On trade, tariff-loving bureaucrats have prevailed over liberalisers. And while an elegant simplicity marks a goods and services tax in most countries that have adopted it, in India it’s a hot mess designed to privilege discretion over clarity.
The writer is a resident fellow at American Enterprise Institute in Washington, DC.
Governments and economic policy
Policy uncertainty, 2004-19
July 5, 2019: The Times of India
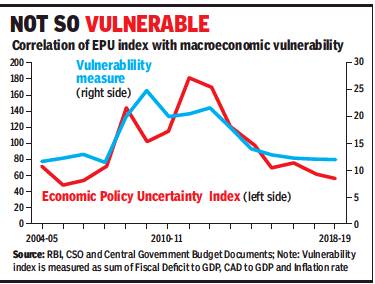
From: July 5, 2019: The Times of India
If there is one thing that businesses dread, it’s policy uncertainty and lack of predictability. And, the government also recognised this and suggested that an increase in economic policy uncertainty dampens investment growth for at least five quarters.
The Economic Policy Uncertainty (EPU) Index — prepared using certain keywords appearing in newspapers — shows that policy uncertainty in India that had peaked around April 2012 is now much lower. The Economic Survey seems to draw comfort from the fact that EPU in India is now decoupled from global uncertainty, a trend that began in 2015.
“Uncertainty seems to have stabilised at lower levels in case of India since last few years, which is noteworthy given the recent surge in global uncertainty, partly due to rising trade tensions between US and China, uncertainty about outcome of Brexit, slower world growth,” the annual economic report card tabled in Parliament said. In 2018, for instance, the global uncertainty index zoomed from 112 to 341, while it remained under 100 in India.
The survey suggested that lower uncertainty has started to show an improvement in the investment rate. Gross fixed capital formation is also showing an upward trend from April-June 2017-18 until around the first half of the last financial year.
At the same time, it recognised that uncertainty is not the only factor impacting investment decisions, with interest rates, borrowing cost, price rise and capacity utilisation being the other parameters. While the going may be better compared to the past, frequent policy changes and trust deficit are major concerns for businesses even now. To address this the survey has outlined several steps, including providing a forward guidance, apart from reducing ambiguity and arbitrariness in policy implementation.
“To ensure predictability, the horizon over which policies will not be changed must be mandatorily specified so that investor can be provided the assurance about future policy certainty. While this will generate some constraints in policy-making, such voluntary tying of policymakers’ hands is undertaken in several cases, including the Fiscal Responsibility and Budget Management Act, the Monetary Policy Framework of the Reserve Bank of India.”
The survey also proposed sub-indices of EPU to capture economic policy uncertainty stemming from fiscal policy, tax policy, monetary policy, trade policy, and banking policy, while suggesting monitoring at the “highest level”.
Although several government departments have in past got quality certifications, the survey made a case afresh, arguing that it will not just train officers and other employees but also ensure that policies are properly implemented at lower levels.
India's economy vis-à-vis the world
See Gross domestic product (GDP): India
Economy, India: international comparisons
Nature, dependence on
2017
January 24, 2020: The Times of India
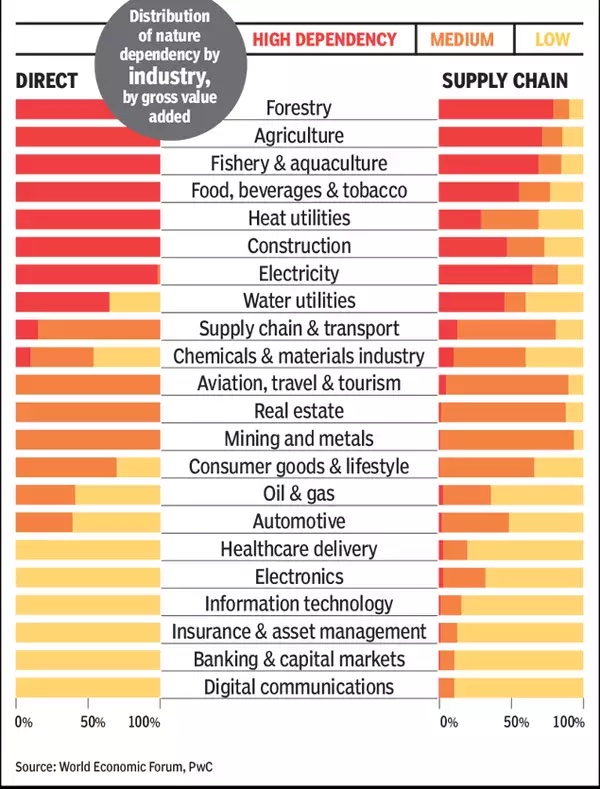
From: January 24, 2020: The Times of India
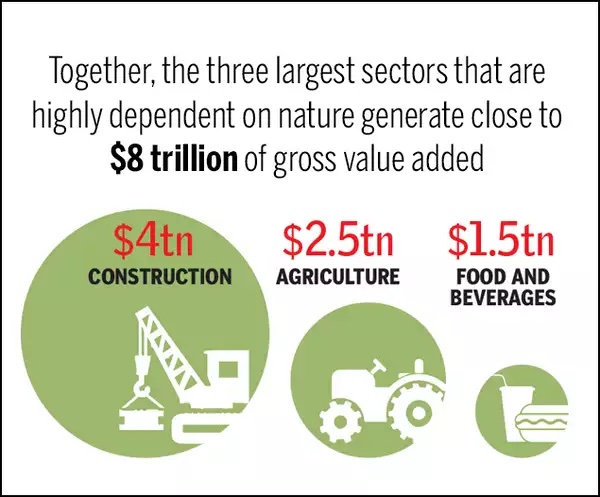
From: January 24, 2020: The Times of India
From: January 24, 2020: The Times of India
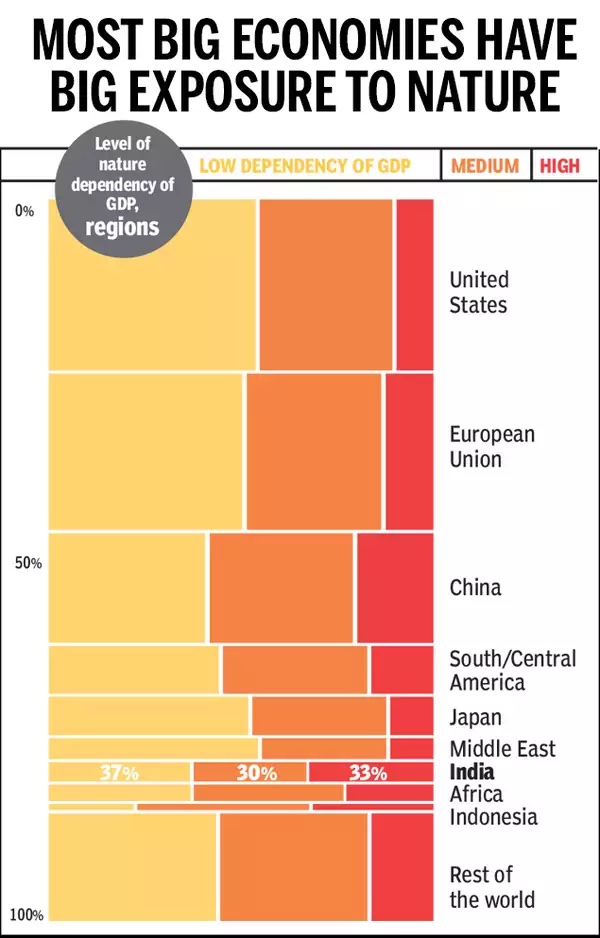
Economic growth and environmental sustainability can often appear framed as either/or phenomena, that is, as mutually exclusive, suggesting that the creation of prosperity has to come at the cost of ecological degradation. But a report by World Economic Forum suggests that it is businesses themselves that have far greater exposure to climate change than is immediately apparent as more than half of the global GDP coming from economic activities is dependent on nature. That means most businesses everywhere should worry more about supporting the response to climate change — to protect their profits and the planet.
$44 trillion — That's how much ecology means to global economy The WEF report says “all businesses depend on natural capital assets and ecosystem services either directly or through their supply chains”. It further adds that $44 trillion of economic value generation — more than half of the world’s total GDP of about $86 trillion — is moderately or highly dependent on nature and, hence, also exposed to risks from nature loss.
But even industries not so heavily reliant on nature have big exposure to it. Thus, chemicals and materials; aviation, travel and tourism; real estate; mining and metals; supply chain and transport retail; and consumer goods and lifestyle sectors — with less than 15% of their direct value highly dependent on nature — still have “hidden dependencies” through their supply chains.
Economies especially vulnerable to climate change are some of the fastest-growing economies in the world. A third of India, and Indonesia’s, GDP is “generated in sectors that are highly dependent on nature”. For all of Africa taken together, 23% of the combined GDP comes from such sectors The larger economies have the highest absolute amounts of GDP in nature-dependent sectors.
Coffee, a case in point of how businesses depend on nature…
While WEF notes that “nature is often hidden or incorrectly priced in supply chains”, it admits that “confusion persists on what amount of nature loss has occurred, why it relates to human prosperity...” The example of coffee gives an idea: 60% of coffee varieties are in danger of extinction due to climate change, disease and deforestation. If this were to happen, global coffee markets — with retail sales of $83 billion in 2017 — would be significantly affected.
...And staple crops show why sustainability is key
More than half of the world’s food comes from just three staples — rice, wheat and maize. But while agricultural crop diversification can improve resilience to pest and disease outbreaks, monocultures, encouraged mainly by economic incentives, are still the dominant form of industrial agriculture.
Macro-indicators
During global crises
2008-22

From: February 1, 2022: The Times of India
See graphic:
India’s Macro-indicators During global crises, 2008-22
Public vis-à-vis private sector

From: February 3, 2021: The Times of India
See graphic:
Public vis-à-vis private sector: Market share in 2020
Purchasing power of individuals/ Affordability of things
1991> 2019
From: July 6, 2019: The Times of India
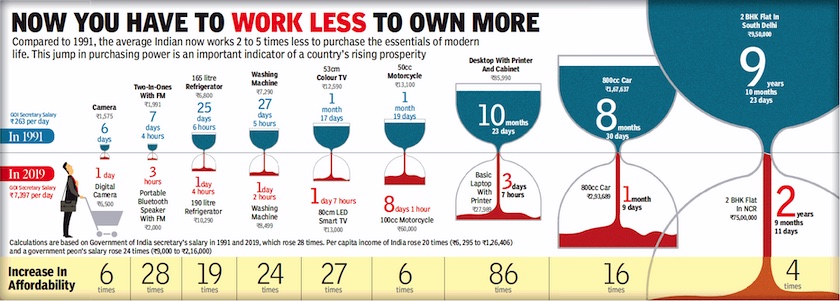
See graphic, '1991> 2019: The growth in the purchasing power of individuals/ The affordability of things '
Part B

From: February 3, 2021: The Times of India
See graphic:
1991> 2019: The growth in the purchasing power of individuals/ The affordability of things
Three levers of economy (inflation, deficit, GDP growth)
1970-2020
From: February 2, 2022: The Times of India
See graphic:
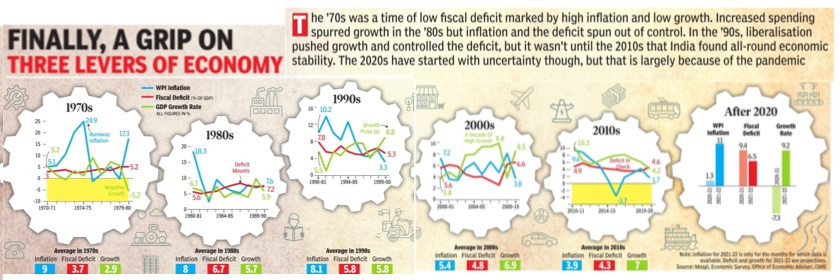
The Three levers of the Indian economy (inflation, deficit, GDP growth), 1970-2020
2016 : Demonetisation
Please see:
Demonetisation of high value currency- 1946, 1978: India
Demonetisation of high value currency- 2016: India
PART II OF THIS PAGE
Capital expenditure
…by the states, 2015-19

From: Oct 23, 2019: The Times of India
See graphic:
The states’ focus areas of capital expenditure, 2015-19
See also
Developmental indicators: India
Economy: India 1
Economy: India 2 (Ministry data)
Economy, India: international comparisons
Gross domestic product (GDP): India
Per capita Income: India and its states
And also...
Income Tax India: Expert advice, 2016-17
Income Tax India: Expert advice, 2017-18